mixing matrix
.
White Rose Research Online URL for this paper:
http://eprints.whiterose.ac.uk/115965/
Version: Accepted Version
Proceedings Paper:
Bai, L., Rossi, L., Cui, Lixin et al. (1 more author) (2016) A novel entropy-based graph
signature from the average mixing matrix. In: Davis, L., Bimbo, A. Del and Lovell, B., (eds.)
2016 23rd International Conference on Pattern Recognition (ICPR). IEEE Computer
Society Press , Los Alamitos, CA, USA , pp. 1339-1344.
https://doi.org/10.1109/ICPR.2016.7899823
eprints@whiterose.ac.uk
Reuse
Items deposited in White Rose Research Online are protected by copyright, with all rights reserved unless indicated otherwise. They may be downloaded and/or printed for private study, or other acts as permitted by national copyright laws. The publisher or other rights holders may allow further reproduction and re-use of the full text version. This is indicated by the licence information on the White Rose Research Online record for the item.
Takedown
If you consider content in White Rose Research Online to be in breach of UK law, please notify us by
A Novel Entropy-based Graph Signature from the
Average Mixing Matrix
Lu Bai
∗, Luca Rossi
†, Lixin Cui
∗, and Edwin R. Hancock
‡∗School of Information, Central University of Finance and Economics, 39 South College Road, Beijing, China †School of Engineering and Applied Sciences, Aston University, Birmingham, B4 7ET, UK
‡Department of Computer Science, University of York, York, YO10 5DD, UK
Abstract—In this paper, we propose a novel entropic sig-nature for graphs, where we probe the graphs by means of continuous-time quantum walks. More precisely, we characterise the structure of a graph through its average mixing matrix. The average mixing matrix is a doubly-stochastic matrix that encapsulates the time-averaged behaviour of a continuous-time
quantum walk on the graph, i.e., the ij-th element of the
average mixing matrix represents the time-averaged transition probability of a continuous-time quantum walk from the vertex vito the vertexvj. With this matrix to hand, we can associate a
probability distribution with each vertex of the graph. We define a novel entropic signature by concatenating the average Shannon entropy of these probability distributions with their Jensen-Shannon divergence. We show that this new entropic measure can encaspulate the rich structural information of the graphs, thus allowing to discriminate between different structures. We explore the proposed entropic measure on several graph datasets abstracted from bioinformatics databases and we compare it with alternative entropic signatures in the literature. The experimental results demonstrate the effectiveness and efficiency of our method.
I. INTRODUCTION
Graph-based representations have proven to be powerful tools in structural pattern recognition. Compared to vector based pattern recognition, a major drawback with graph rep-resentations is the lack of a natural correspondence order for vertices. This limits the direct application of standard machine learning algorithms to problems such as classifying or clustering graphs.
One way to overcome this problem is to embed graphs onto a vectorial space by computing some entropy-based vectorial signature. Several approaches have been proposed in the literature to associate an entropic complexity measure to a graph. Dehmer et al. [1], [2] have developed a means of computing entropies of undirected graphs by using information functionals. For a given graph, the information functional is de-rived from its topological structure and quantify its information content. Anand et al. [3] and Passerini et al. [4] have applied the von Neumann entropy or quantum entropy to graphs, by mapping quantum states into discrete graph Laplacians [5]. In particular, Passerini et al. note that if the discrete Laplacian [6] is scaled by the inverse of the volume of the graph the resulting matrix is a density matrix, whose entropy can be computed using the spectrum of the discrete Laplacian. Moreover, they indicate that when there is degree heterogeneity then the Shannon (classical) and von Neumann (quantum) entropies are correlated. Since the von Neumann entropy relies on the computation of the normalized Laplacian spectrum, its
computational complexity is cubic in the number of vertices. To render the computation of the von Neumann entropy more efficient, Han et al. [7] have shown how the computation can be rendered quadratic in the number of vertices of the graph by using a quadratic approximation of the Shannon entropy of the Laplacian eigenvalues. An analysis of the quadratic entropy reveals that it can be computed from a number of permutation invariant matrix trace expressions. This leads to a simple expression for the approximate entropy in terms of the degrees of adjacent vertices. Furthermore, to develop this work further, Ye et al. [8] have shown how the von Neumann entropy for undirected graphs can be generalized to directed graphs. To this end, they commenced by using Chung’s [9] definition of the normalized Laplacian on a directed graph. According to this definition, the normalized Laplacian matrix of a directed graph is Hermitian, and so the interpretation of Passerini et al. in [3] still holds for the domain of directed graphs. By observing that the Von Neumann entropy of the normalized Laplacian is essentially the Shannon entropy associated with the normalized Laplacian eigenvalues, the authors provide an expression for the von Neumann entropy of directed line graphs which depends on the in-degree and out-degree of pairs of connected vertices.
It should be noted that most of these entropy measures can only capture limited structural information of a graph. This is because the entropy based on information functionals of Dehmer et al. [1] and the Von Neumann entropy approxima-tions of Han et al. [7] and Ye et al. [8] are all based on the computation of relatively simple structural characteristics.
Another way to apply standard machine learning and pattern recognition techniques to graphs is to use kernels methods [10]. The idea underpinning graph kernels is to mea-sure the similarity between two graphs by first decomposing them into simpler substructures and then enumerating the number of substructures they share. For example, random walk graph kernels describe the structure of a graph using random walks [11]. More recently, graph kernels based on quantum walks have been shown to easily outperform their classical counterpart [12], [13]. Unlike explicit embedding methods, however, graph kernels provide an indirect embedding, where only the dot product of the graphs in the embedding space is known. With respect to entropic signature, graph kernels tend to have a higher computational cost.
A. Contribution
which is able to capture the structural information of graphs better than existing entropic signatures. With respect to existing quantum walk graph kernels, we propose to use the average mixing matrix [14] to summarize the time-averaged behaviour of the walk. The reason for using continuous-time quantum walks and the average mixing matrix is twofold. Firstly, quantum walks have been shown to discriminate between different structures better than their classical counterparts [12], [13]. For example, while the long-term behaviour of classical random walks is governed by the leading eigenvector of the graph Laplacian, all the eigenvectors of the Hamiltonian (i.e., the graph Laplacian or the adjacency matrix, depending on the setting) contribute to the long-term behaviour of a quantum walk. Secondly, the average mixing matrix concisely summa-rizes the time-averaged behaviour of continuous-time quantum walk. In this sense, the average mixing matrix represents the closest quantum analogue of the steady state of a classical random walk, which has been used to measure the Shannon entropy of a graph [15]. Therefore, the average mixing matrix represents a natural choice for our entropic signature based on quantum walks.
The proposed entropic signature is computed as follows. Given a graph, we commence by computing the average mixing matrix associated wit it. We then show how this allows us to associated a probability distribution over the graph vertices, for each vertex of the graph. Then, we define our entropic signature by concatenating the average Shannon entropy of these probability distributions with their Jensen-Shannon divergence. We show that this new entropic measure can encaspulate the rich structural information of the graphs, thus allowing to discriminate between different structures. We explore the proposed entropic measure on several graph datasets abstracted from bioinformatics databases and we com-pare it with alternative entropic signatures in the literature. The experimental results demonstrate the effectiveness and efficiency of our method.
The remainder of this paper is organized as follows. Section II introduces the concepts of continuous-time quantum walks and average mixing matrix. We then show how this allows us to associate a probability distribution with each vertex of the graph. Section III gives the definition of the proposed entropic signature for graphs. Section IV provides experiments, while Section V concludes our work.
II. PRELIMINARYCONCEPTS
In this section, we commence by introducing the concepts of continuous-time quantum walka and average mixing matrix. We then proceed to show how to associated a probability distri-bution with each vertex of a graph based on the corresponding average mixing matrix.
A. Continuous-time Quantum Walks
The continuous-time quantum walk represents the quan-tum analogue of the continuous-time random walk [16]. A continuous-time random walk models a Markovian diffusion process over the vertices of a graph, where transitions are only allowed between adjacent vertices. Let G = (V, E) be an undirected graph with vertex set V and edge set E, and let p(t)∈Rn denote the state of walk at time t, i.e, thei-th
component ofp(t)is the probability of the random walker to be at vertex vi at time t.In a continuous-time random walk
the state vector evolves according to the equation
p(t) =e−Ltp(0), (1) where the graph Laplacian L = D −A is the infinitesimal generator matrix of the underlying continuous-time Markov process,Adenotes the adjacency matrix andDis the diagonal matrix with the vertex degrees as diagonal elements.
Similarly to its classical counterpart, the state space of the continuous-time quantum walks is the vertex set of the graph. The state vector of classical random walks is replaced by a vector of complex amplitudes over V whose squared norm sums to unity, and as such the state of the system is not constrained to lie in a probability space, thus allowing interference to take place. The state of the quantum walk at timetis a complex linear combination of the basis states |ui
|ψ(t)i= X
u∈V
αu(t)|ui, (2)
where the amplitude αu(t) ∈ C and |ψ(t)i ∈ C|V| are
both complex. Moreover, we have that αu(t)α∗u(t) gives the
probability that at time t the walker is at the vertex u, and thus Pu∈V αu(t)α∗u(t) = 1 and αu(t)α∗u(t) ∈ [0,1], for all
u∈V,t∈R+ .
Unlike the classical random walk, the evolution of the quantum walk is governed by the Schr¨odinger equation ∂/∂t|ψti=−iH|ψti, whereH denotes the system
Hamilto-nian. This is usually either the adjancency matrix or the graph Laplacian.
B. The Average Mixing Matrix
Given a graphG= (V, E), the behaviour of a continuous-time quantum walk at continuous-time t can be summarized using the mixing matrix [14]
M(t) =U(t)◦U(−t) (3) =eiHt◦e−iHt,
where◦denotes the Schur-Hadamard product of two matrices, i.e.,[A◦B]uv=AuvBuv. SinceU is unitary,M(t)is a doubly
stochastic matrix, i.e., a non-negative real matrix such that its rows and columns sum to 1. Intuitively, the entry M(t)uv is
equal to the probability that at time t a quantum walker that started from vertexuis found at vertex v.
SinceU(t)is unitary and thus norm-preserving,M(t)does not converge. However, we can enforce convergence by taking a time average. More specifically, we can introduce the average mixing matrix by taking the Ces`aro mean
c M = lim
T→∞ Z T
0
M(t)dt. (4)
The entryMcvivj can be interpreted as the average probability
that a quantum walker that started from the vertex vi is
found at vj. Note that the average mixing matrix is still
H =PMj=1λjPj, where theλjs are theM distinct eigenvalues of H andPm is the matrix representation of the orthogonal
projection on the eigenspace associated with λm. Then, the
average mixing matrix can be written as c
M(t) =
M
X
j=1
Pj◦Pj. (5)
C. Shannon Entropy from the Average Mixing Matrix
In this subsection, we show how to associate a Shannon entropy with each vertex of a graph. Let G = (V, E) be a sample graph and Mc(t) be the average mixing matrix of G. For the i-th vertex vi ∈ V, the corresponding row of
the average mixing matrix gives time-averaged probability for the quantumw walker to reach the vertices v1, . . . , v|V| ∈ V starting fromvi, i.e.,
Pi={pi(v1), . . . , pi(vj), . . . , pi(v|V|)}. (6)
where pi(vj) = Mcvivj is the time-averaged probability of
going fromvi tovj.
Thus, the Shannon entropy associated with the vertex vi
can be computed as HS(vi) =−
X
vj∈V
pi(vj) logpi(vj). (7)
III. ANENTROPICSIGNATURE FROM THEAVERAGE MIXINGMATRIX
In this section, we propose a define the proposed entropic signature. We commence by introducing the concept of Jensen-Shannon divergence. With the Jensen-Jensen-Shannon divergence to hand, we then proceed to show how to define a novel graph entropic signature.
A. The Jensen-Shannon Divergence
The Jensen-Shannon divergence is a dissimilarity measure defined between probability distributions [17]. Consider two (discrete) probability distributionsP = (p1, . . . , pm, . . . , pM)
and Q = (q1, . . . , qm, . . . , qM), then the Jensen-Shannon
divergence betweenP andQ is defined as DJ S(P,Q) =HS(
P+Q
2 )−
HS(P) +HS(Q)
2
=−
M
X
m=1
pm+qm
2 log
pm+qm
2
+
M
X
m=1
pmlogpm+ M
X
m=1
qmlogqm. (8)
whereHS(P) =P M
m=1pmlogpmis the Shannon entropy of the probability distributionP. For a mixture ofN probability distributions P1, . . . ,PN associated with mixing proportions
π1, . . . , πN, the Jensen-Shannon divergence defined in Eq.(8)
can be re-written as
DJ S(P1, . . . ,PN) =HS( N
X
i=1
πiPi)− N
X
i=1
πiHS(Pi). (9)
Note that the Jensen-Shannon divergenceDJ S, both in Eq.(8)
or Eq.(9), is always well defined, symmetric, negative definite and bounded, i.e.,0≤DJ S ≤1.
B. Graph Entropic Signature
LetG(V, E)be a sample graph. We commence by comput-ing the average mixcomput-ing matrixMc(t)forG. As observed in the previous Section, thei-th row ofMc(t)corresponds to the time-averaged probability distributionPi induced by a
continuous-time quantum walk starting from vi ∈ V. We define the
mixture of |V| probability distributions corresponding to the
|V| vertices of G by associating a weight πi = 1/|V| with
each row of the average mixing matrix. The entropic signature of Gis then computed as
EG= [DJ S(P1, . . . , P|V|),HbS(v1, . . . , v|V|)], (10)
whereDJ S(P1, . . . , P|V|)is the entropic dissimilarity ofG
DJ S(P1, . . . , P|V|) =HS(
|V| X
i=1
πiPi)−
|V| X
i=1
πiHS(Pi), (11)
andHbS(v1, . . . , v|V|)is the average entropic measure ofG
b
HS(v1, . . . , v|V|) =
|V| X
i=1
πiHS(Pi). (12)
Note that, forEG the elementDJ S(P1, . . . , P|V|)reflects
the entropic dissimilarity between the probability distribution associated with the graph vertices. On the other hand, the ele-mentHbS(v1, . . . , v|V|)encapsulates the average mixing
Shan-non entropy of the vertices. Both the elements of our entropic measure rely on the average mixing matrix of continuous-time quantum walks. As we have stated, quantum walks encapsulate rich interior graph information. As a result, the proposed entropic signature not only encapsulates the rich information from the Shannon entropies of the distributions induced by the quantum walk, but also captures the interior dissimilarity information between vertices.
C. Computational Complexity
For a graph G(V, E) having n vertices, computing the entropic characteristics measure has time complexity O(n3). This is because the required average mixing matrix from continuous-time quantum walks relies on the eigen-decomposition of the graph Laplacian, that requires time complexity O(n3). This indicates that the proposed entropic characteristics measure for a graph can be computed in a polynomial time. Note that this is the same complexity of the von Neumann entropy computation. However, as our experimental results show, the proposed signature is better able to discriminate between different graph structures.
IV. EXPERIMENTALRESULTS A. Graph Datasets
We demonstrate the performance of our new kernel on six standard graph datasets from bioinformatics databases. These datasets include: MUTAG, NCI1, NCI109, ENZYMES, PPIs and PTC(MR). More details are shown in Table.I.
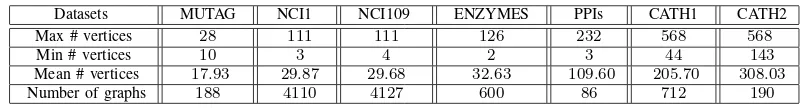
TABLE I. SUMMARY STATISTICS FOR THE SELECTED GRAPH DATASETS
Datasets MUTAG NCI1 NCI109 ENZYMES PPIs CATH1 CATH2
Max # vertices 28 111 111 126 232 568 568
Min # vertices 10 3 4 2 3 44 143
Mean # vertices 17.93 29.87 29.68 32.63 109.60 205.70 308.03
Number of graphs 188 4110 4127 600 86 712 190
NCI1 and NCI109: The NCI1 and NCI109 datasets consist of graphs representing two balanced subsets of datasets of chemical compounds screened for activity against non-small cell lung cancer and ovarian cancer cell lines respectively. There are 4110 and 4127 graph based structures in NCI1 and NCI109 respectively.
ENZYMES:This dataset consists of graphs representing pro-tein tertiary structures consisting of 600 enzymes from the BRENDA enzyme database. In this case the task is to correctly assign each enzyme to one of the 6 EC top-level classes.
PPIs:The PPIs dataset consists of protein-protein interaction networks (PPIs). The graphs describe the interaction relation-ships between histidine kinase in different species of bacteria. Histidine kinase is a key protein in the development of signal transduction. If two proteins have direct (physical) or indirect (functional) association, they are connected by an edge. There are 219 PPIs in this dataset and they are collected from 5 different kinds of bacteria with the following evolution order (from older to more recent) Aquifex4 and thermotoga4 PPIs from Aquifex aelicus andThermotoga maritima, Gram-Positive52 PPIs fromStaphylococcus aureus,Cyanobacteria73 PPIs from Anabaena variabilis and Proteobacteria40 PPIs from Acidovorax avenae. There is an additional class ( Aci-dobacteria46 PPIs) which is more controversial in terms of the bacterial evolution since they were discovered. We select Proteobacteria40 PPIs andAcidobacteria46 PPIs as the second group test graphs.
CATH1 and CATH2:The CATH1 dataset consists of proteins in the same class (i.e Mixed Alpha-Beta), but the proteins have different architectures (i.e. Alpha-Beta Barrel vs.2-layer Sandwich). CATH2 contains proteins in the same class (i.e. Mixed Alpha-Beta), architecture (i.e. Alpha-Beta Barrel), and topology (i.e. TIM Barrel), but in different homology classes (i.e. Aldolase vs. Glycosidases). The CATH2 dataset is harder to classify, since the proteins in the same topology class are structurally similar. There are 712 and190 test graphs in the CATH1 and CATH2 datasets.
B. Experiments on Graph Classification
Experimental Setup: We compare the proposed entropic signature with several state-of-the-art entropy-based graph complexity measure. These include 1) the von-Neumann graph entropy (VNGE) [7], 2) the Shannon graph entropy associated with the steady state random walk (SGE) [15], 4) the Shannon entropy associated with the information functionals,fV2
(FV2) and fP2 (FP2) [2], 5) the von Neumann entropy associated
with the normalized Laplacian matrix [4], 6) the backtraceless random walk kernel using the Ihara zeta function based cycles (BRWK) [18], and 7) the graphlet count graph kernels with graphlet of size3(GCGK) [19]. For the proposed method and the entropy-based graph complexity methods, we calculate the characterization values of graphs as features. We then evaluate
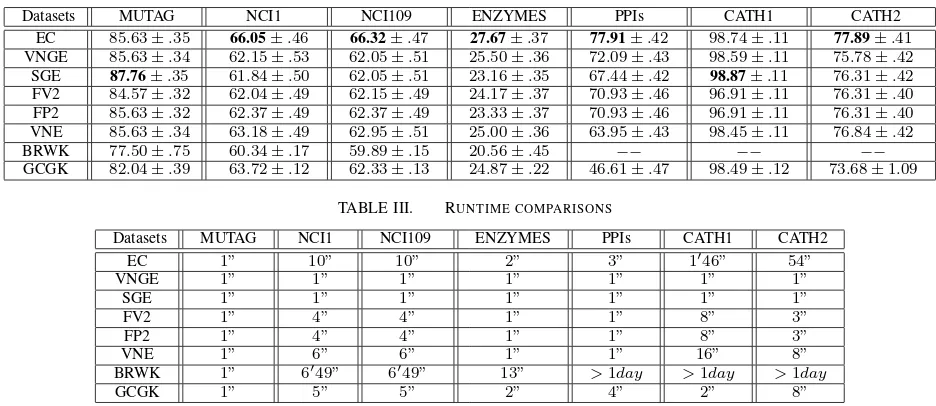
the performance of the signatures in a graph classification task by performing 10-fold cross-validation using a Support Vector Machine (SVM) with Sequential Minimal Optimization (SMO) [20] and the Pearson VII Universal Kernel (PUK) [21]. For the BRWK and GCGK kernels, evaluate the classification performance by performing 10-fold cross-validation using a C-SVM associated with the kernel matrix. For any method, We use nine folds for training and one fold for testing. We evaluate the performance of our method and the alternative methods. For each method, we repeat the experiments 10 times. We report the average classification accuracies of each method in Tables II. The runtime is measured under a Matlab R2011a running on a2.5GHz Intel2-Core processor (i.e., i5-3210m). Table III, on the other hand, shows the runtime evaluation for each of method and dataset.
Results and Discussions:In terms of classification accuracy, the proposed entropic signature easily outperforms the alterna-tive entropy-based complexity measures, the BRWK kernel and the GCGK kernel. Only the classification accuracy of the SGE entropy on the MUTAG and CATH1 datasets is a marginally better than that of the proposed method, but the proposed method is still competitive with respect to the SGE entropy measure on the MUTAG and CATH1 datasets. On the other hand, the classification accuracy of the proposed method is significantly greater than that of the SGE entropy measure on the remaining datasets. These observations indicate that the proposed entropic measure is more effective than the state-of-the-art entropy-based complexity measures and the graph kernels. The reason for this effectiveness is that both the two elements of the proposed entropic signature rely on the average mixing matrix of continuous-time quantum walks, which in turn can reflect rich interior graph information. By contrast, either the alternative entropy-based complexity measures or the alternative graph kernels rely on the graph vertex degrees, informational functionals, cycles and graphlet substructures, which encapsulate structurally simple features. As a result, the proposed method can reflect richer graph characteristics than the alternative methods.
In terms of runtime, it is clear that the proposed method is not the most efficient method. However, the proposed method can still finish the computation in a polynomial time on all the datasets. At the same time, the effectiveness of the proposed method is better than any alternative entropy-based complexity measure method. This indicates that the proposed method is applicable on real-world datasets.
C. Stability Evaluation
In this subsection, we explore the relationship between the graph edit distance and the proposed entropic signature. The edit distance between two graphs Gp and Gq is the
TABLE II. AVERAGE CLASSIFICATION ACCURACY(IN%±STANDARD ERROR).
Datasets MUTAG NCI1 NCI109 ENZYMES PPIs CATH1 CATH2
EC 85.63±.35 66.05±.46 66.32±.47 27.67±.37 77.91±.42 98.74±.11 77.89±.41
VNGE 85.63±.34 62.15±.53 62.05±.51 25.50±.36 72.09±.43 98.59±.11 75.78±.42
SGE 87.76±.35 61.84±.50 62.05±.51 23.16±.35 67.44±.42 98.87±.11 76.31±.42
FV2 84.57±.32 62.04±.49 62.15±.49 24.17±.37 70.93±.46 96.91±.11 76.31±.40
FP2 85.63±.32 62.37±.49 62.37±.49 23.33±.37 70.93±.46 96.91±.11 76.31±.40
VNE 85.63±.34 63.18±.49 62.95±.51 25.00±.36 63.95±.43 98.45±.11 76.84±.42
BRWK 77.50±.75 60.34±.17 59.89±.15 20.56±.45 −− −− −− GCGK 82.04±.39 63.72±.12 62.33±.13 24.87±.22 46.61±.47 98.49±.12 73.68±1.09
TABLE III. RUNTIME COMPARISONS
Datasets MUTAG NCI1 NCI109 ENZYMES PPIs CATH1 CATH2
EC 1” 10” 10” 2” 3” 1′46” 54”
VNGE 1” 1” 1” 1” 1” 1” 1”
SGE 1” 1” 1” 1” 1” 1” 1”
FV2 1” 4” 4” 1” 1” 8” 3”
FP2 1” 4” 4” 1” 1” 8” 3”
VNE 1” 6” 6” 1” 1” 16” 8”
BRWK 1” 6′49” 6′49” 13” >1day >1day >1day
GCGK 1” 5” 5” 2” 4” 2” 8”
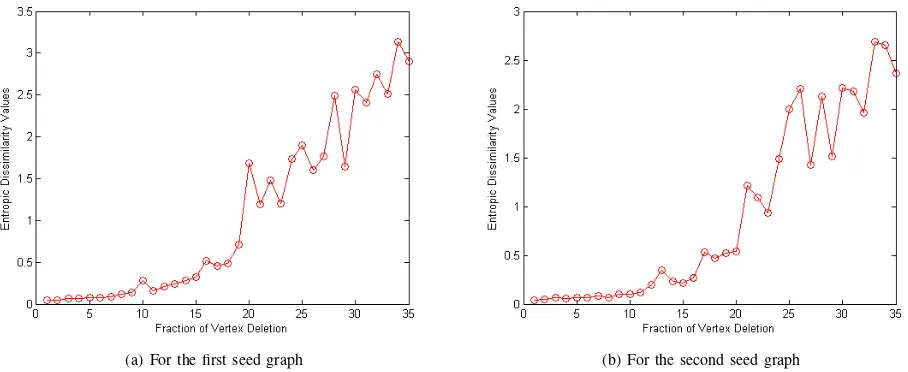
a new graph by deleting a fraction of vertices from a seed graph. The evaluation employs two seed graphs each having 400 vertices. For each of the seed graph, we randomly delete a predetermined fraction of vertices to simulate the effects of noise. We apply the edit operation on the seed graph 35 times, and generate 35 edit operated graphs as the noise corrupted counterparts. Given the seed graph, we delete 4 vertices (i.e., 1%vertices) each time, respectively. Recall that the proposed entropic signature of a graph consists of two elements. One is the Jensen-Shannon divergence between the graph vertices, the other one is the average Shannon entropy of the graph vertices. To evaluate the effect of structural perturbations on the proposed entropic signature, we investigate how these two components vary under the edit operations. Fig.1 and Fig.2 shows the fluctuations of the signature elements for increasing amounts of structural noise. In each plot, the x-axis denotes the fraction of vertices deleted, and the y-axis denotes the value of the value of the entropic signature components.
We observe that there is an approximately linear relation-ship between both the entropic characteristics elements and the fraction of the deleted vertices. Moreover, we observe that when less than10%of vertices are deleted the fluctuations are relatively small and the value of the signature is stable. How-ever, when around20%of vertices are deleted the fluctuations become moderate. These indicate that the proposed entropic signature measure is robust even when the seed graph struc-ture undergoes relatively large perturbations. Furthermore, the proposed method also possesses a good ability to distinguish graphs under controlled amounts of structural errors.
V. CONCLUSION ANDFUTUREWORK
In this paper, we have proposed a novel entropic signa-ture for graphs, based on the average mixing matrix from continuous-time quantum walks. More specifically, we have associated a probability distribution with each vertex of a graph using the average mixing matrix. The resulting entropic signature is computed by concatenating the average Shannon entropy of these probability distributions with their Jensen-Shannon divergence. The new entropic measure encapsulates
the rich structural information of graphs, and thus has a good ability of discriminating different graph structures. We have empirically demonstrated the effectiveness of the proposed entropic measure on several standard graph-based datasets abstracted from bioinformatics databases.
In the future work, we will extend our analysis in a number of ways. First, in our previous work [15], [12] we have developed a family of graph kernels using both the classical and quantum Jensen-Shannon divergence associated with classical and quantum walks. It would be interesting to use the average mixing matrix to develop a new Jensen-Shannon graph kernel. Second, in our previous work [22], we have developed a novel framework for computing depth-based complexity traces of graphs associated with entropy measures. It would be interesting to develop a new complexity trace method for graphs using the average mixing matrix.
Acknowledgments
This work is supported by the National Natural Science Foundation of China (Grant no.61503422), the Open Projects Program of National Laboratory of Pattern Recognition, and the program for innovation research in Central University of Finance and Economics. Edwin R. Hancock is supported by a Royal Society Wolfson Research Merit Award.
REFERENCES
[1] M. Dehmer, “Information processing in complex networks: Graph entropy and information functionals,”Applied Mathematics and Com-putation, vol. 201, no. 1, pp. 82–94, 2008.
[2] M. Dehmer and A. Mowshowitz, “A history of graph entropy measures,”
Information Sciences, vol. 181, no. 1, pp. 57–78, 2011.
[3] K. Anand, G. Bianconi, and S. Severini, “Shannon and von neumann entropy of random networks with heterogeneous expected degree,”
Physical Review E, vol. 83, no. 3, p. 036109, 2011.
[4] F. Passerini and S. Severini, “Quantifying complexity in networks: the von neumann entropy,”International Journal of Agent Technologies and Systems, vol. 1, pp. 58–67, 2009.
(a) For the first seed graph (b) For the second seed graph
Fig. 1. Stability evaluation of Jensen-Shannon divergence under vertex edit operations
[image:7.595.71.522.280.468.2](a) For the first seed graph (b) For the second seed graph
Fig. 2. Stability evaluation of the average Shannon entropy under vertex edit operations
[6] C. Godsil and G. Royle, “Algebraic graph theory, volume 207 of graduate texts in mathematics,” 2001.
[7] L. Han, F. Escolano, E. R. Hancock, and R. C. Wilson, “Graph char-acterizations from von neumann entropy,”Pattern Recognition Letters, vol. 33, pp. 1958–1967, 2012.
[8] C. Ye, R. C. Wilson, C. H. Comin, L. d. F. Costa, and E. R. Hancock, “Entropy and heterogeneity measures for directed graphs,” in Similarity-Based Pattern Recognition. Springer, 2013, pp. 219–234.
[9] F. Chung, “Laplacians and the cheeger inequailty for directed graphs,”
Annals of Combinatorics, vol. 9, pp. 1–19, 2005.
[10] D. Haussler, “Convolution kernels on discrete structures,” inTechnical Report UCS-CRL-99-10, 1999.
[11] H. Kashima, K. Tsuda, and A. Inokuchi, “Marginalized kernels between labeled graphs,” inICML, 2003, pp. 321–328.
[12] L. Bai, L. Rossi, A. Torsello, and E. R. Hancock, “A quantum jensen-shannon graph kernel for unattributed graphs,” Pattern Recognition, vol. 48, no. 2, pp. 344–355, 2015.
[13] L. Rossi, A. Torsello, and E. R. Hancock, “Measuring graph similarity through continuous-time quantum walks and the quantum jensen-shannon divergence,”Physical Review E, vol. 91, no. 2, p. 022815, 2015.
[14] C. Godsil, “Average mixing of continuous quantum walks,”Journal of Combinatorial Theory, Series A, vol. 120, no. 7, pp. 1649–1662, 2013.
[15] L. Bai and E. R. Hancock, “Graph kernels from the jensen-shannon divergence,”Journal of Mathematical Imaging and Vision, vol. 47, no. 1-2, pp. 60–69, 2013.
[16] E. Farhi and S. Gutmann, “Quantum computation and decision trees,”
Physical Review A, vol. 58, p. 915, 1998.
[17] A. F. T. Martins, N. A. Smith, E. P. Xing, P. M. Q. Aguiar, and M. A. T. Figueiredo, “Nonextensive information theoretic kernels on measures,”
Journal of Machine Learning Research, vol. 10, pp. 935–975, 2009. [18] F. Aziz, R. C. Wilson, and E. R. Hancock, “Backtrackless walks on a
graph,”IEEE Trans. Neural Netw. Learning Syst., vol. 24, no. 6, pp. 977–989, 2013.
[19] N. Shervashidze, S. V. N. Vishwanathan, T. Petri, K. Mehlhorn, and K. M. Borgwardt, “Efficient graphlet kernels for large graph compari-son,”Journal of Machine Learning Research, vol. 5, pp. 488–495, 2009. [20] J. C. Platt, “Fast training of support vector machines ssing sequential minimal optimization,”Sch¨olkopf, B., Burges, C.J.C., and Smola, A.J. (Eds.) Advances in Kernel Methods, pp. 185–208, 1999.
[21] W. Sanders, C. Johnston, S. Bridges, S. Burgess, and K. Willeford, “Prediction of cell penetrating peptides by support vector machines,”
PLoS Computational Biology, vol. 7, p. e1002101, 2011.
[22] L. Bai and E. R. Hancock, “Depth-based complexity traces of graphs,”