Theme 2
Economy and finance Series Β
Short-term trends
ISSN 1011-0844
ECU-EMS information
4 D 1990
Monthly
THE ECU IS TO BE THE OFFICIAL CURRENCY OF THE EUROPEAN BANK FOR
THE R E C O N S T R U C T I O N AND D E V E L O P M E N T OF EAST-EUROPEAN
COUNTRIES.
The European Bank for the Reconstruction and Development of EastEuropean countries -known by the French acronym BERD - will grant loans to seven East European countries. BERD's capital (10 000 million ecus) will be held by 40 c o u n t r i e s t o g e t h e r w i t h the European C o m m i s s i o n and the EIB. Its' Articles of Association will be signed in Paris on 30th May next and it will begin operating on 31st March 1991.
The ecu will be the bank's reference currency for both capital and transactions.
However, capital contributions may be made in dollars or yen, at the ecu-dollar and ecu-yen exchange rates which have been set for five years on the basis of the average exchange rate for the six-month period running from 30th September 1989 to 31st March 1990, i.e. approximately 1.17 dollars/170 yen = 1 ecu.
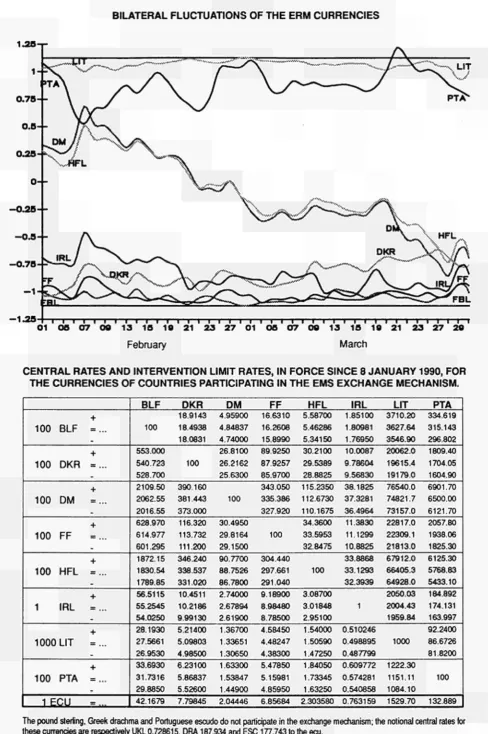
W i t h i n the EMS, the Italian lira in March remained close to its new upper limits set at the beginning of January. However, the relative weakness of the German mark allowed an alignment of most of the currencies in the exchange rate mechanism, thereby continuing the trend from January and February (see graph on page 3). The strength of the French franc in relation to the mark enabled the Banque de France to reduce its intervention rate by 0.25 points from 10% to 9.75% on 2nd April.
Outside the exchange rate mechanism, sterling continued to depreciate during March (-2.4% against the ecu). From January 1989 to the end of March 1990, sterling fell nearly 13% against the ecu.
The market for ecu issues was particularly buoyant in March and at the start of April.
In addition to the issues reported in the last bulletin, Italy launched a ten-year Euro-issue of 1 000 million ECU on 30th March. Then, on 10th April, the French Treasury issued a new OAT ('Obligation Assimilable du Trésor') in ecu at 9.5% over ten years. 494 million ecu of this OAT (not included in the tables on pages 4 and 5 of this bulletin, since it is considered to be a domestic instrument) were placed with an average yield on the issue price of 10.61%, i.e. 0.15 points less than the yield of the recent Italian Euro-issue on the secondary market. The EEC loan of 350 million Ecu for Hungary which had been postponed for a long time -was launched on 2nd April.
On 29th March, Belgium issued a 300 million ecu bond over ten years at the three month LIM EAN (average of London inter-bank bid and offered rates). The ten-year, 150 million ecu loan launched on 6 April by the Banca Nazionale del Lavoro carries an interest rate calculated on the basis of the s i x - m o n t h LIBOR (London Inter-Bank Offered Rate) minus 1/32%.
eurostat
OFICINA ESTADÍSTICA DE LAS COMUNIDADES EUROPEAS DE EUROPÆISKE FÆLLESSKABERS STATISTISKE KONTOR STATISTISCHES AMT DER EUROPÄISCHEN GEMEINSCHAFTEN ΣΤΑΤΙΣΤΙΚΗ ΥΠΗΡΕΣΙΑ ΤΩΝ ΕΥΡΩΠΑΪΚΩΝ ΚΟΙΝΟΤΗΤΩΝ
STATISTICAL OFFICE OF THE EUROPEAN COMMUNITIES OFFICE STATISTIQUE DES COMMUNAUTÉS EUROPÉENNES ISTITUTO STATISTICO DELLE COMUNITÀ EUROPEE
BUREAU VOOR DE STATISTIEK DER EUROPESE GEMEENSCHAPPEN SERVIÇO DE ESTATÍSTICA DAS COMUNIDADES EUROPEIAS
L-2920 Luxembourg - Tél. 43011 - Télex : Comeur Lu 3423
B-1049 Bruxelles, bâtiment Berlaymont, rue de la Loi 200 (bureau de liaison) - Tél. 2351111
Note For any TEL:
FAX:
information on 4301-4785 4301-3288 4301-4770 4301-4150
the statistics in this bulletin T. MATHISSE
G. THOUVENIN S. ANSION
contact Luxembourg:
Contents
I. A graph of the bilateral fluctuations of the ERM currencies. II. Yearly and monthly issues of ecu bonds.
III. EMCF rate, interest rates on ecu deposits and yields on ecu bonds. IV. Last month's ecu bond issues.
V. Consumer price indices in national currencies. VI. Consumer price indices in ecus.
VII. Yearly, monthly and daily ecu exchange rates.
© ECSC-EEC-EAEC, Brussels · Luxembourg, 1990
Reproduction is authorized, except for commercial purposes, provided the source is acknowledged.
TABLE I
BILATERAL FLUCTUATIONS OF THE ERM CURRENCIES
τ—ι—ι—Γ
08 07 M
February March
CENTRAL RATES AND INTERVENTION LIMIT RATES, IN FORCE SINCE 8 JANUARY 1990, FOR THE CURRENCIES OF COUNTRIES PARTICIPATING IN THE EMS EXCHANGE MECHANISM.
100
100
100
100
100
1
BLF
DKR
DM
FF
HFL
IRL
1000 LIT
100 PTA
1ECU
+
= ... .
+
= ... -+ = .
+
= .., .
+
= .
+
= .., -+ —
-+ =
-BLF
100
553.000 540.723 528.700 2109.50 2062.55 2016.55 628.970 614.977 601.295 1872.15 1830.54 1789.85 56.5115 55.2545 54.0250 28.1930 27.5661 26.9530 33.6930 31.7316 29.8850 42.1679
DKR
18.9143 18.4938 18.0831
100
390.160 381.443 373.000 116.320 113.732 111.200 346.240 338.537 331.020 10.4511 10.2186 9.99130 5.21400 5.09803 4.98500 6.23100 5.86837 5.52600 7.79845
DM
4.95900 4.84837 4.74000 26.8100 26.2162 25.6300
100
30.4950 29.8164 29.1500 90.7700 88.7526 86.7800 2.74000 2.67894 2.61900 1.36700 1.33651 1.30650 1.63300 1.53847 1.44900 2.04446
FF
16.6310 16.2608 15.8990 89.9250 87.9257 85.9700 343.050 335.386 327.920
100
304.440 297.661 291.040 9.18900 8.98480 8.78500 4.58450 4.48247 4.38300 5.47850 5.15981 4.85950 6.85684
HFL
5.58700 5.46286 5.34150 30.2100 29.5389 28.8825 115.2350 112.6730 110.1675 34.3600 33.5953 32.8475
100
3.08700 3.01848 2.95100 1.54000 1.50590 1.47250 1.84050 1.73345 1.63250 2.303580
IRL
1.85100 1.80981 1.76950 10.0087 9.78604 9.56830 38.1825 37.3281 36.4964 11.3830 11.1299 10.8825 33.8868 33.1293 32.3939
1
0.510246 0.498895 0.487799 0.609772 0.574281 0.540858 0.763159
LIT
3710.20 3627.64 3546.90 20062.0 19615.4 19179.0 76540.0 74821.7 73157.0 22817.0 22309.1 21813.0 67912.0 66405.3 64928.0 2050.03 2004.43 1959.84
1000
1222.30 1151.11 1084.10 1529.70
PTA
334.619 315.143 296.802 1809.40 1704.05 1604.90 6901.70 6500.00 6121.70 2057.80 1938.06 1825.30 6125.30 5768.83 5433.10 184.892 174.131 163.997 92.2400 86.6726 81.8200
100
132.889
TABLE II
ECU BOND ISSUES (Mio ECU) '
1984 1985 1986 1987 1988 1989
1988
1989
1990 II III IV
1 II III IV
1 Janvier Février March
TOTAL
3 569 9 462 6840 7336 9 188 11 127
1848 2560 3 725
2056 3 461 2 700 2 910
2 575 660 1545 370
European Community
Total
2 274 5 301 4226 4403 5 275 6 461
1075 1570 1875
1 205 2161 1485 1610
1375 60 1 195 120
Business sector
1 119 3 361 2358 2058 3 230 4400
750 950 975
670 1 195 1 285 1 250
615 0 495 120
Govern-ments
205 1040 558 1000 300 500
100 0 150
150 350 0 0
200 0 200 0
Insti-tutions
950 900 1310 1345 1845 1561
225 620 800
385 616 200 360
560 60 500 0
Non-European Community
Total
1 295 4 161 2614 2 933 3 913 4666
773 990 1850
851 1300 1215 1300
1 200 600 350 250
Business sector
795 3 401 2204 2 180 3 138 4141
773 890 1 300
851 1 150 1 140 1 000
1025 425 350 250
Govern-ments
225 200 350 453 575 425
0 0 450
0 150 75 200
0 0 0 0
Insti-tutions
275 560 60 300 200 100
0 100 100
0 0 0 100
175 175 0 0
Q Recording based on the payment date
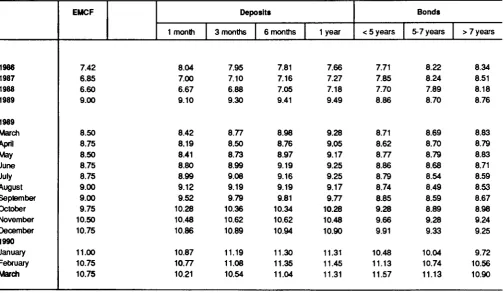
TABLE III
OPERATIONS RATES OF THE EMCF (CALCULATION MONTH) AND INTEREST RATES AND YIELDS OF ECU INVESTMENTS (%)
1986 1987 1988 1989
1989 March April May June July August September October November December 1990 January February March
EMCF Deposits
1 month
7.42 8.04 6.85 7.00 6.60 6.67 9.00 9.10
8.50 8.42 8.75 8.19 8.50 8.41 8.75 8.80 8.75 8.99 9.00 9.12 9.00 9.52 9.75 10.28 10.50 10.48 10.75 10.86
11.00 10.87 10.75 10.77 10.75 10.21
3 months
7.95 7.10 6.88 9.30
8.77 8.50 8.73 8.99 9.08 9.19 9.79 10.36 10.62 10.89
11.19 11.08 10.54
6 months
7.81 7.16 7.05 9.41
8.98 8.76 8.97 9.19 9.16 9.19 9.81 10.34 10.62 10.94
11.30 11.35 11.04
1 year
7.66 7.27 7.18 9.49
9.28 9.05 9.17 9.25 9.25 9.17 9.77 10.28 10.48 10.90
11.31 11.45 11.31
Bonds
< 5 years
7.71 7.85 7.70 8.86
8.71 8.62 8.77 8.86 8.79 8.74 8.85 9.28 9.66 9.91
10.48 11.13 11.57
5-7 years
8.22 8.24 7.89 8.70
8.69 8.70 8.79 8.68 8.54 8.49 8.59 8.89 9.28 9.33
10.04 10.74 11.13
> 7 years
8.34 8.51 8.18 8.76
8.83 8.79 8.83 8.71 8.59 8.53 8.67 8.98 9.24 9.25
[image:4.595.48.553.485.778.2]TABLE IV
LAST MONTH'S ECU BOND ISSUES
Issue
Payment
Date
06/03/90
24/04/90
07/03/90
02/04/90
13/03/90 27/03/90
13/03/90
10/04/90
14/03/90 19/04/90
15/03/90
18/04/90
16/03/90
19/04/90
20/03/90
26/04/90
20/03/90 19/04/90
22/03/90 11/04/90
30/03/90
18/04/90
29/03/90 27/04/90
27/03/90 11/05/90
02/04/90
20/05/90
06/04/90
30/04/90
Borrower
(country)
Banque Internationale à LUXEMBOURG
E.I.B.
B.E.I.
I.B.J.
(JAPAN)
Credit local de
FRANCE
Landeskreditbank Baden-Wuerttemberg
(DEUTSCHLAND)
Kreditanstalt Fuer
Wiederaufbau (DEUTSCHLAND)
General Electric C. C.
(U.SA)
British Gas International
Finance B.V.
(UNITED KINGDOM)
General Motors Corp. (U.SA)
Kontrolibank (AUSTRIA)
ITAUA
BELGIQUE
Cie Bancaire
(FRANCE)
E.E.C. C E E .
B.N.L
(ITAUA)
Listing :
Issued (Mio ECU)
20
300
100
75
75
200
100
100
100
150
1000
300
60
350
150
Issue Price
101.625
94.800
101.750
99.050
101.800
101.875
101.790
101.575
101.625
101.700
101.150
100.000
101.950
101.600
100.000
Coupon Term (years)
111/2 2
10 7
11 5
101/4 5
11 1/4 3
10 7/8 5
11 3
11 3
111/8 4
103/4 5
103/4 10
Var. 10
111/2 2
105/8 5
Var. 10
LX = Luxembourg LN = London PA = Paris F F M = Frankfurt
Maturity
24/04/92
14/02/97
27/03/95
08/02/95
19/04/93
18/04,-95
19/04/93
26/04/93
19/04/94
11/04/95
18/04/00
../04/00
11/05/92
20/04/95
30/04/00
Yields
%
10.56
11.34
10.52
10.50
10.53
10.38
10.28
10.36
10.61
10.30
10.57
10.37
10.50
Lead
Manager
B.I.L
U.B.S. P.&D.
I.B.J.
C.C.F.
C.S.F.B.
Deutsche Bank
Swiss Bank
Merrill Lynch
C.S.F.B.
Paribas
Paribas
Paribas
Paribas
Paribas
Merill Lynch
Listing
LX
LX
LX
PA-LX
LN
LX-FFM
LX
LN
LN
LX
LX
LX
LX
LX-FFM PA-LN
LX
Notice
■
Swap
Swap
Swap
Swap
Swap
Swap
Swap
Swap
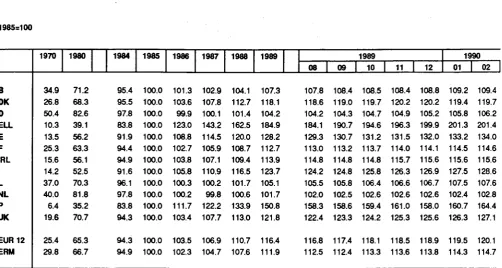
TABLE V
CONSUMER PRICE INDICES IN NATIONAL CURRENCY
1985=100 B DK D ELL E F IRL I L NL Ρ UK EUR 12 ERM 1970 34.9 26.8 50.4 10.3 13.5 25.3 15.6 14.2 37.0 40.0 6.4 19.6 25.4 29.8
1980 1984
71.2 95.4
68.3 95.5
82.6 97.8
39.1 83.8
56.2 91.9
63.3 94.4
56.1 94.9
52.5 91.6
70.3 96.1
81.8 97.8
35.2 83.8
70.7 94.3
65.3 94.3
66.7 94.9
1985 100.0 100.0 100.0 100.0 100.0 100.0 100.0 100.0 100.0 100.0 100.0 100.0 100.0 100.0 1986 101.3 103.6 99.9 123.0 108.8 102.7 103.8 105.8 100.3 100.2 111.7 103.4 103.5 102.3 1987 102.9 107.8 100.1 143.2 114.5 105.9 107.1 110.9 100.2 99.8 122.2 107.7 106.9 104.7 1988 104.1 112.7 101.4 162.5 120.0 108.7 109.4 116.5 101.7 100.6 133.9 113.0 110.7 107.6
1989 1989
08
107.3 107.8 118.1 118.6 104.2 104.2 184.9 184.1 128.2 129.3 112.7 113.0 113.9 114.8 123.7 124.2 105.1 105.5 101.7 102.0 150.8 158.3 121.8 122.4
116.4 116.8 111.9 112.5
09 108.4 119.0 104.3 190.7 130.7 113.2 114.8 124.8 105.8 102.5 158.6 123.3 117.4 112.4 10 108.5 119.7 104.7 194.6 131.2 113.7 114.8 125.8 106.4 102.6 159.4 124.2 118.1 113.3 11 108.4 120.2 104.9 196.3 131.5 114.0 115.7 126.3 106.6 102.6 161.0 125.3 118.5 113.6 12 108.8 120.2 105.2 199.9 132.0 114.1 115.6 126.9 106.7 102.6 158.0 125.6 118.9 113.8 1990 01 109.2 119.4 105.8 201.3 133.2 114.5 115.6 127.5 107.5 102.4 160.7 126.3 119.5 114.3 02 109.4 119.7 106.2 201.4 134.0 114.6 115.6 128.6 107.6 102.8 164.4 127.1 120.1 114.7
Annual rate of increase (%)
Β DK D ELL E F IRL I L NL Ρ UK EUR 12 ERM EUR 12 ERM EUR 12 ERM 61-70 3.0 6.0 2.7 2.1 6.1 4.1 4.8 4.0 2.6 4.2 4.5 4.1 3.7 3.3 0.8 0.7 1.7 1.2
71-80 1984
7.4 6.3
9.8 6.3
5.1 2.4
14.5 18.3
15.4 11.2
9.7 7.3
13.7 8.6
14.1 10.8
6.7 6.5
7.4 3.2
18.7 29.3
13.8 5.0
9.9 7.2
8.4 6.7
3.5 3.3
3.0 3.0
4.8 5.0
3.3 4.2
1985 4.9 4.7 2.2 19.4 7.8 5.9 5.4 9.2 4.1 2.3 19.3 6.1 6.1 5.4 2.5 2.3 4.0 3.0 1986 1.3 3.6 -0.2 23.1 8.8 2.7 3.8 5.8 0.3 0.3 11.7 3.4 3.2 2.2 2.8 1.8 Dis 3.9 2.5 1987 1.6 4.0 0.2 16.1 5.3 3.1 3.1 4.8 -0.1 -0.2 9.4 4.1 3.4 2.4 Aver. 1.9 1.8 parity be 3.8 2.8 1988 1.2 4.6 1.2 13.5 4.8 2.7 2.1 5.1 1.4 0.9 9.6 4.9 3.6 2.7 ige devi« 1.8 1.4 tween th 2.8 1.9
1989 1989
os I!
3.1 3.2
4.8 4.9
2.8 28
13.8 13.6
6.8 6.7
3.7 3.4
4.1 4.5
6.2 6.3
3.3 3.4
1.1 1.1
12.6 13.7
7.8 7.3
5.1 5.1
4.0 3.9
atìon around the mean
2.2 2.2
1.4 1.4
09 !
3.5 4.7 2.8 14.3 6.8 3.4 4.5 6.3 3.6 1.3 12.7 7.6 5.1 3.9 2.2 1.3
e average and the minimum
4.1 4.0
2.9 2.8
3.9 2.6
10 |
3.6 5.1 3.1 13.8 7.1 3.6 4.5 6.3 3.9 1.3 12.3 7.3 5.2 4.4 2.0 1.5 4.0 3.1 11 3.6 4.8 3.0 14.0 7.4 3.7 4.7 6.0 3.8 1.2 11.7 7.7 5.3 4.4 2.1 1.5 4.0 3.2 12 3.6 4.8 3.0 14.8 6.9 3.6 4.6 6.2 3.9 1.3 11.6 7.7 5.2 4.3 2.1 1.5 4.0 3.0 1990
01 1
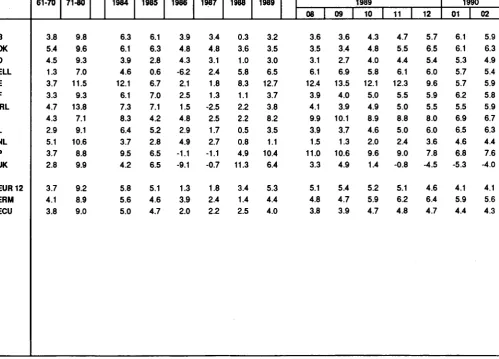
TABLE VI
CONSUMER PRICE INDICES IN ECU
1985=100 Β DK D ELL E F IRL I L NL Ρ UK EUR 12 ERM ECU 1970 30.9 28.0 30.0 35.2 24.5 30.1 16.4 32.2 32.5 27.1 28.3 27.0 29.4 30.3 30.2
1980 1984
78.7 94.3 70.0 94.1 72.9 97.3 69.7 99.4 72.8 93.7 73.1 93.5 58.5 93.3 63.9 96.0 77.7 95.0 74.4 97.2 65.9 93.9 69.8 93.9 70.9 95.2 71.2 95.6 71.7 95.6 1985 100.0 100.0 100.0 100.0 100.0 100.0 100.0 100.0 100.0 100.0 100.0 100.0 100.0 100.0 100.0 1986 103.9 104.8 104.3 93.8 102.1 102.5 101.5 104.8 102.9 104.9 98.9 90.9 101.3 103.9 102.0 1987 107.4 109.7 107.5 96.1 103.9 103.8 98.9 107.3 104.6 107.7 97.8 90.0 103.1 106.4 104.2 1988 107.6 113.7 108.6 102.5 112.6 105.0 100.6 109.7 105.2 108.3 102.5 100.2 106.8 107.9 106.8
1989 1989
08 111.1 111.5 117.7 117.9 112.1 111.8 107.5 107.1 126.8 128.3 108.9 109.5 104.5 105.1 118.5 120.4 108.8 109.1 109.4 109.5 112.9 115.0 106.5 106.7 112.5 113.1 112.6 113.0 111.1 111.3 09 112.1 118.4 112.0 110.5 129.8 109.8 105.6 120.9 109.4 110.1 115.0 107.2 113.6 113.5 111.7 10 112.8 119.8 113.4 110.9 129.3 110.8 106.5 120.6 110.6 111.0 114.6 105.3 113.8 114.9 112.9 11 113.3 121.2 114.1 110.7 129.9 111.3 106.7 121.6 111.4 111.5 115.1 103.6 114.1 115.5 113.2 12 114.4 122.1 115.3 111.1 129.7 111.6 107.3 121.7 112.2 112.3 115.2 101.1 114.2 115.9 113.4 1990 01 I 115.0 121.4 115.8 110.2 130.2 112.4 107.5 121.7 113.2 112.1 116.5 102.1 114.7 116.0 113.5 02 115.3 121.9 115.8 108.9 131.0 112.3 108.1 122.7 113.3 112.2 118.7 104.1 115.3 116.2 113.9
Annual rate of increase (%)
Β DK D ELL E F IRL I L NL Ρ UK EUR 12 ERM ECU 61-70 3.8 5.4 4.5 1.3 3.7 3.3 4.7 4.3 2.9 5.1 3.7 2.8 3.7 4.1 3.8
71-80 1984
9.8 6.3 9.6 6.1 9.3 3.9 7.0 4.6 11.5 12.1 9.3 6.1 13.8 7.3 7.1 8.3 9.1 6.4 10.6 3.7 8.8 9.5 9.9 4.2 9.2 5.8 8.9 5.6
9.0 5.0
1985 6.1 6.3 2.8 0.6 6.7 7.0 7.1 4.2 5.2 2.8 6.5 6.5 5.1 4.6 4.7 1986 3.9 4.8 4.3 -6.2 2.1 2.5 1.5 4.8 2.9 4.9 -1.1 -9.1 1.3 3.9 2.0 1987 3.4 4.8 3.1 2.4 1.8 1.3 -2.5 2.5 1.7 2.7 -1.1 -0.7 1.8 2.4 2.2 1988 0.3 3.6 1.0 5.8 8.3 1.1 2.2 2.2 0.5 0.8 4.9 11.3 3.4 1.4 2.5
1989 1989
08 3.2 3.6 3.5 3.5 3.0 3.1 6.5 6.1 12.7 12.4 3.7 3.9 3.8 4.1 8.2 9.9 3.5 3.9 1.1 1.5 10.4 11.0 6.4 3.3 5.3 5.1 4.4 4.8
4.0 3.8
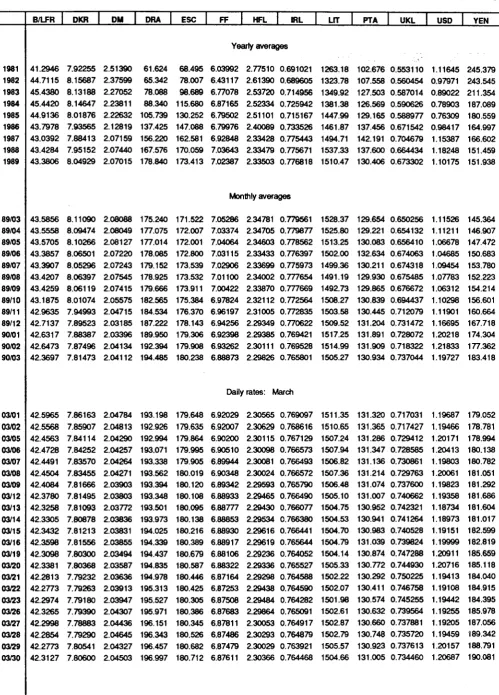
TABLE VII
ECU EXCHANGE RATES
1981 1982 1983 1984 1985 1986 1987 1988 1989 89/03 89/04 89/05 89/06 89/07 89/08 89/09 89/10 89/11 89/12 90/01 90/02 90/03 03701 03/C2 03/05 03/06 03/07 03/08 03/09 03/12 03/13 03/14 03/15 03/16 03/19 03/20 03/21 03/22 03/23 03/26 03/27 03/28 03/29 03/30 B/LFR 41.2946 44.7115 45.4380 45.4420 44.9136 43.7978 43.0392 43.4284 43.3806 43.5856 43.5558 43.5705 43.3857 43.3907 43.4207 43.4259 43.1875 42.9635 42.7137 42.6317 42.6473 42.3697 42.5965 42.5568 42.4563 42.4728 42.4491 42.4504 42.4084 42.3780 42.3258 42.3305 42.3432 42.3598 42.3098 42.3381 42.2813 42.2773 42.2974 42.3265 42.2998 42.2854 42.2773 42.3127 DKR 7.92255 8.15687 8.13188 8.14647 8.01876 7.93565 7.88413 7.95152 8.04929 8.11090 8.09474 8.10266 8.06501 8.05296 8.06397 8.06119 8.01074 7.94993 7.89523 7.88387 7.87496 7.81473 7.86163 7.85907 7.84114 7.84252 7.83570 7.83455 7.81666 7.81495 7.81093 7.80878 7.81213 7.81556 7.80300 7.80368 7.79232 7.79263 7.79180 7.79390 7.78883 7.79290 7.80541 7.80600 DM 2.51390 2.37599 2.27052 2.23811 2.22632 2.12819 2.07159 2.07440 2.07015 2.08088 2.08049 2.08127 2.07220 2.07243 2.07545 2.07415 2.05575 2.04715 2.03185 2.03396 2.04134 2.04112 2.04784 2.04813 2.04290 2.04257 2.04264 2.04271 2.03903 2.03803 2.03772 2.03836 2.03831 2.03855 2.03494 2.03587 2.03636 2.03913 2.03947 2.04307 2.04436 2.04645 2.04327 2.04503 DRA 61.624 65.342 78.088 88.340 105.739 137.425 156.220 167.576 178.840 175.240 177.075 177.014 178.085 179.152 178.925 179.666 182.565 184.534 187.222 189.950 192.394 194.485 193.198 192.926 192.994 193.071 193.338 193.562 193.394 193.348 193.501 193.973 194.025 194.339 194.437 194.835 194.978 195.313 195.527 195.971 196.151 196.343 196.457 196.997 ESC 68.495 78.007 98.689 115.680 130.252 147.088 162.581 170.059 173.413 171.522 172.007 172.001 172.800 173.539 173.532 173.911 175.384 176.370 178.143 179.306 179.908 180.238 179.648 179.635 179.864 179.995 179.905 180.019 180.120 180.108 180.095 180.138 180.216 180.389 180.679 180.587 180.446 180.425 180.305 180.386 180.345 180.526 180.682 180.712
FF HFL IRL
Yearly averages 6.03992 6.43117 6.77078 6.87165 6.79502 6.79976 6.92848 7.03643 7.02387 2.77510 2.61390 2.53720 2.52334 2.51101 2.40089 2.33428 2.33479 2.33503 0.691021 0.689605 0.714956 0.725942 0.715167 0.733526 0.775443 0.775671 0.776818 Monthly averages 7.05286 7.03374 7.04064 7.03115 7.02906 7.01100 7.00422 6.97824 6.96197 6.94256 6.92398 6.93262 6.88873 Daily 6.92029 6.92007 6.90200 6.90510 6.89944 6.90348 6.89342 6.88933 6.88777 6.88853 6.88930 6.88917 6.88106 6.88322 6.87164 6.87253 6.87508 6.87683 6.87811 6.87486 6.87479 6.87611 2.34781 2.34705 2.34603 2.33433 2.33699 2.34002 2.33870 2.32112 2.31005 2.29349 2.29385 2.30111 2.29826 0.779561 0.779877 0.778562 0.776397 0.775973 0.777654 0.777669 0.772564 0.772835 0.770622 0.769421 0.769528 0.765801 rates: March 2.30565 2.30629 2.30115 2.30098 2.30081 2.30024 2.29593 2.29465 2.29430 2.29534 2.29616 2.29619 2.29236 2.29336 2.29298 2.29438 2.29484 2.29864 2.30053 2.30293 2.30029 2.30366 0.769097 0.768616 0.767129 0.766573 0.766493 0.766572 0.765790 0.766490 0.766077 0.766380 0.766441 0.765644 0.764052 0.765527 0.764588 0.764590 0.764282 0.765091 0.764917 0.764879 0.763921 0.764468
UT
I
EXPLANATORY NOTES
Bilateral currency deviation (graph on page 3).
The various curves should be compared in pairs. To find the differential between two currencies, subtract the (positive or negative) values along the y-axis corresponding to each currency.
The graph is drawn with the curve of the strongest currency above that of the weakest. It shows therefore the relative position of each currency vis-à-vis the other currencies.
When two curves intersect or merge over a period of time there is no differential between the two currencies and their market exchange rate equals their bilateral central rate.
The graph is drawn within a horizontal band corresponding to the maximum 2,25% margin of fluctuation applying at any given moment to market exchange rates and the bilateral central rates of the ERM currencies, with the exception of the PTA, which has a maximum authorized fluctuation of 6%. This band is divided symmetrically by a horizontal axis along which the points would be plotted if all currencies were at their bilateral central rate and there were therefore no fluctuations.
The daily market exchange rates of all currencies are compared with the relevant bilateral central rates and the differentials between the two calculated.
The maximum fluctuation between two currencies (with the exception of the PTA) is shown within the band, symmetrical with the horizontal axis. The fluctuations of the other currencies in relation to either of the two currencies in question are shown within the maximum permissible fluctuation.
The curves are drawn by linking the daily points showing the relative positions of each currency.
Exchange rate grid (Table I).
The intervention limit rates fixed in the official grid do not always correspond exactly to + or 2.25% (+ or -6% for the peseta) of the central rates, since for each currency pair (whose exchange rates are inversely proportional to one another) the lower limit of the one corresponds to the upper limit of the other.
Ecu bond Issues (Table II & IV).
In the table II, the issues are recorded as at the payment date. This bulletin only covers international and foreign issues in ecus, including ecu issues offering the option of conversion into other currencies. Main source: International Financing Review
Table II shows, under the headings:
- Business sector and Governments: national issuers, both private and public.
- Institutions: the European Investment Bank and the Commission of the European Communities (EEC, ECSC, Euratom).
- Organizations: the specialist institutions of the United Nations, the World Bank, the Council of Europe, etc
Table IV shows detailled information of the latest known issues, whatever the payment date.
Interest rates and yields on ecu investments (Table III).
The interest rates for 1, 3 and 6 month and 1 year deposits are calculated on the basis of the Friday London market rates (source: Financial Times, London Money Rates, ECU Linked Deposit Bid). The bonds are classified according to three types of terms: under 5 years, from 5 to 7 years and more than 7 years. The redemption yields of ecu bonds are calculated each Wednesday from a sample of fixed interest bonds, denominated in ecus and listed on the Luxembourg Stock Exchange. These yields are weighted by amounts in circulation, (source: Luxembourg Stock Exchange).
The monthly and yearly averages are the arithmetic means of these weekly interest rates and bond yields.
Operations rates of the EMCF (Table III).
The interest rate for transactions in EMCF (European Monetary Cooperation Fund) ecus, is the weighted average of the most representative rates on the domestic money market of the countries whose currencies make up the ecu basket. It is based on the weighting of the currencies in the ecu basket as derived from the ecu central rates in force. The rate thus calculated for a given month applies to EMCF transactions for the following month. In table 3, this rate relates to the month upon wich the calculations are based and not to the (following) month during which it is used by the EMCF.
Consumer price Indices In national currency (Table V).
The consumer price indices in the national currency of each country measure changes in the purchasing power of one unit of national currency spent in the country concerned.
These indices are calculated as weighted arithmetic means (chain indices) of the national indices, the weighting for each Member State being its relative share in the final consumption of households of the group of countries in question (EUR 12, ERM), expressed in purchasing power standards, at current prices and purchasing power parities.
At the foot of the table, the average weighted fluctuations around the mean and the minimum are given for the same groups of countries, with the same weightings. (These are calculated as weighted averages of the absolute fluctuations in relation to the mean and the minimum respectively). They show the degree to which price movements in the Member States in the Community converge.
Consumer price indices In ecus (Table VI).
For each country the index of consumer prices in ecus is calculated by dividing the national consumer price index by the average movement of the national currency in relation to the ecu during the month. It measures the change in the purchasing power of one ecu in the country concerned.
Three composite indices are calculated, covering all the Member States of the Community (EUR 12 and
ECU), the 9 Member States participating in the European Monetary System exchange rate mechanism (ERM). Although the peseta has been participating in the exchange rate mechanism since 19/06/89, and the peseta and the escudo have been included in the calculation of the ecu since 21/09/89, these two currencies are only taken into account in the indices contained in this bulletin for data after 30/09/89.)
These three indices are calculated as weighted arithmetic means (chain-indices). The weightings are defined as follows: for the EUR 12 and ERM indices, the relative share of each Member State in the final consumption of households for the group of countries in question (EUR 12 or ERM), expressed in ecus at current prices and exchange rates (annual weighting). For the ecu index, the relative share of each Member State's currency in the calculation of the ecu (monthly weighting).
Ecu exchange rates (Table VII).
The exchange rates for the ecu against the national currencies of the Member States of the Community, the USD and yen are shown as annual averages, monthly averages (for the current year), and daily rates (for the latest available month).
1 ecu= Σ
100= Σ
BFR DKR DM DRA* ESC* FF HFL iRL LFR LIT From 09/21/89 the ecu basket was made as follows :
3.301 0.1976 0.6242 1.44 1.393 1.332 0.2198 C.0O8552 0.13 151.8
Ecu central rates from 01/08/90.:
42.1679 7.79845 2.04446 187.934 177.743 6.85684 2.30358 0.763159 42.1679 1529.70
PTA
6.885
132.889
Weights of currencies on 09/21/89, calculated on the basis of current central rates, expressed in %.
7.83 2.53 30.53 0.77 0.78 19.43 9.54 1.12 0.31 9.92 5.18
UKL*
0.08784
0.728615
12.06
* does not participate to the exchange rates mechanism
Venta y suscripciones · Salg og abonnement · Verkauf und Abonnement · Πωλήσεις και συνδρομές Sales and subscriptions · Vente et abonnements · Vendita e abbonamenti
Verkoop en abonnementen · Venda e assinaturas
BELGIQUE / BELGIË FRANCE UNITED KINGDOM
Moniteur belge / Belgisch Staatsblad Rue de Louvain 42 / Leuvenseweg 42 1000 Bruxelles/ 1000 Brussel Tel. (02)512 00 26
Fax 511 01 84
CCP / Postrekening 000-2005502-27 Autres distributeurs / Overige verkooppunten Librairie européenne /
Europese Boekhandel Avenue Albert Jonnart 50 / Albert Jonnartlaan 50 1200 Bruxelles / 1200 Brussel Tél. (02) 734 02 81
Fax 735 08 60 Jean De Lannoy
Avenue du Roi 202 /Koningslaan 202 1060 Bruxelles / 1060 Brussel Tél. (02) 538 51 69
Télex 63220 UNBOOK Β CREDOC
Rue de la Montagne 34 / Bergstraat 34 Bte 11 / Bus 11
1000 Bruxelles / 1000 Brussel
DANMARK
J. H. Schultz Information A/S EF-Publlkatloner
Ottiliavej 18 2500 Valby
Tlf. 36 44 2 2 66
Fax 36 44 01 41 Girokonto 6 00 08 86
BR DEUTSCHLAND Bundesanzeiger Verlag Breite Straße
Postfach 10 80 06 5000 Köln 1 Tel. (0221) 20 29-0 Fernschreiber:
ANZEIGER BONN 8 882 595 Fax 20 29 278
GREECE
G.C. Eleftheroudakls SA International Bookstore Nikis Street 4 10563 Athens Tel. (01) 322 63 23 Telex 219410 ELEF Fax 323 98 21
ESPANA
Boletfn Oficial del Estado Trafalgar, 27
28010 Madrid Tel. (91) 446 60 00 Mundi-Prensa Libros, S.A. Castellò, 37
28001 Madrid
Tel. (91) 431 33 99 (Libras) 431 32 22 (Suscripciones) 435 36 37 (Dirección) Télex 49370-MPLI-E
Fax (91) 275 39 98 Sucursal:
Libreria Internacional AEDOS Consejo de Ciento, 391 08009 Barcelona Tel. (93) 301 86 15 Fax (93) 317 01 41 Generalität de Catalunya: Llibreria Rambla dels estudis Rambla, 118 (Palau Moja) 08002 Barcelona Tel. (93) 302 68 35
302 64 62
Journal officiel
Service des publications des Communautés européennes 26, oie Desalx
75727 Paris Cedex 15 Tél. (1) 40 58 75 00 Fax (1) 40 58 75 74 IRELAND
Government Publications Sales Office Sun Alliance House
Molesworth Street Dublin 2 Tel. 71 03 09 or by post
Government Stationery Office EEC Section
6th floor Bishop Street Dublin 8 Tel. 78 16 66 Fax 78 06 45 ITALIA Licosa Spa
Via Benedetto Fortini, 120/10 Casella postale 552 50125 Firenze
Tel. (055) 64 54 15 Fax 64 12 57
Telex 570466 LICOSA I CCP 343 509 Subagenti:
Libreria scientifica Lucio de Biasio - AEIOU Via Meravigli, 16
20123 Milano Tel. (02) 80 76 79 Herder Editrice e Libreria Piazza Montecitorio, 117-120 00186 Roma
Tel. (06) 679 4 6 28/679 53 04
Librerìa giurìdica Via 12 Ottobre. 172/R 16121 Genova Tel. (010) 59 56 93
GRAND-DUCHÉ DE LUXEMBOURG Abonnements seulement
Subscriptions only Nur für Abonnements Messageries Paul Kraus 11, rue Christophe Plantin 2339 Luxembourg Tél. 499 88 88 Télex 2515 CCP 49242-63 NEDERLAND SDU uitgeverij
Christoffel Plantijnstraat 2 Postbus 20014
2500 EA 's-Gravenhage Tel. (070) 78 98 80 (bestellingen) Fax (070) 47 63 51
PORTUGAL Imprensa Nacional Casa da Moeda, EP
Rua D. Francisco Manuel de Melo, 5 1092 Lisboa Codex
Tel. (01) 69 34 14
Distribuidora de Livros Bertrand, Ld.' Grupo Bertrand, SARL
Rua das Terras dos Vales, 4-A Apartado 37
2700 Amadora Codex
Tel. (01) 493 90 50 - 494 87 88
Telex 15798 BERDIS Fax 491 02 55
HMSO Books (PC 16) HMSO Publications Centre 51 Nine Elms Lane London SW8 5DR Tel. (01) 873 9090 Fax GP3 873 8463 Sub-agent:
Alan Armstrong Ltd 2 Arkwright Road Reading, Berks RG2 OSO Tel. (0734) 75 18 55 Telex 849937 AAALTD G Fax (0734) 75 51 64
SCHWEIZ / SUISSE / SVIZZERA OSEC
Stampfenbachstraße 85 8035 Zürich
Tel. (01) 365 51 51 Fax (01) 365 52 21 ÖSTERREICH Manz'sche Verlags·
und Universitätsbuchhandlung Kohlmarkt 16
1014 Wien Tel. (0222) 531 61-0 Telex 11 25 00 BOX A Fax (0222) 531 61-81 TURKIYE
Dünya eüpor veb ofset A.S. Narlibahçe Sokak No. 15
Cagai oglu
Istanbul Tel. 512 01 90 Telex 23822 DSVO-TR UNITED STATES OF AMERICA UNIPUB
4611-F Assembly Drive Lanham, MD 20706-4391 Tel. Toll Free (800) 274 4888 Fax (301) 459 0056 Telex 7108260418 CANADA
Renouf Publishing Co., Ltd 61 Sparks Street
Ottawa
Ontario K1P 5R1
Tel. Toll Free 1 (800) 267 41 64 Ottawa Region (613) 238 89 85-6
Telex 0 5 3 - 4 9 3 6
JAPAN
Klnokunlya Company Ltd 17-7 Shinjuku 3-Chome Shiniuku-ku
Tokyo 160-01 Tel. (03) 354 01 31 Journal Department PO Box 55 Chitóse
Tokyo 156 Tel. (03) 4 3 9 01 2 4
SVERIGE BTJ Box 200 22100 Lund Tel. (046) 18 00 00 Fax (046) 18 01 25 AUTRES PAYS OTHER COUNTRIES ANDERE LÄNDER
Office des publications officielles dea Communautés européennes 2, rue Mercier
L-2985 Luxembourg Tél. 49 92 81
Télex PUBOF LU 1324 b Fax 48 85 73
Price (excl. VAT) in Luxembourg: Single copy ECU 6 · Subscription ECU 51
. * . OFICINA DE PUBLICACIONES OFICIALES DE LAS COMUNIDADES EUROPEAS ISSN 1011 "0844
• O « *. KONTORET FOR DE EUROPÆISKE FÆLLESSKABERS OFFICIELLE PUBLIKATIONER
· ■ » - . AMT FÜR AMTLICHE VERÖFFENTLICHUNGEN DER EUROPÄISCHEN GEMEINSCHAFTEN
ΥΠΗΡΕΣΙΑ ΕΠΙΣΗΜΩΝ ΕΚΔΟΣΕΩΝ ΤΩΝ ΕΥΡΩΠΑΪΚΩΝ ΚΟΙΝΟΤΗΤΩΝ
OFFICE FOR OFFICIAL PUBLICATIONS OF THE EUROPEAN COMMUNITIES OFFICE DES PUBLICATIONS OFFICIELLES DES COMMUNAUTÉS EUROPÉENNES UFFICIO DELLE PUBBLICAZIONI UFFICIALI DELLE COMUNITÀ EUROPEE BUREAU VOOR OFFICIËLE PUBLIKATIES DER EUROPESE GEMEENSCHAPPEN SERVIÇO DAS PUBLICAÇÕES OFICIAIS DAS COMUNIDADES EUROPEIAS