ISSN 1017-6004
I
eurostat
EXTERNAL TRADE
Monthly statistics
eurostat
OFICINA ESTADÍSTICA DE LAS COMUNIDADES EUROPEAS
DE EUROPÆISKE FÆLLESSKABERS STATISTISKE KONTOR
STATISTISCHES AMT DER EUROPÄISCHEN GEMEINSCHAFTEN
ΣΤΑΤΙΣΤΙΚΗ ΥΠΗΡΕΣΙΑ ΤΩΝ ΕΥΡΩΠΑΪΚΩΝ ΚΟΙΝΟΤΗΤΩΝ
STATISTICAL OFFICE OF THE EUROPEAN COMMUNITIES
OFFICE STATISTIQUE DES COMMUNAUTÉS EUROPÉENNES
ISTITUTO STATISTICO DELLE COMUNITÀ EUROPEE
BUREAU VOOR DE STATISTIEK DER EUROPESE GEMEENSCHAPPEN
SERVIÇO DE ESTATÍSTICA DAS COMUNIDADES EUROPEIAS
L2920 Luxembourg Tél. 43011 Télex : Comeur Lu 3 4 2 3
B1049 Bruxelles, bâtiment Berlaymont, rue de la Loi 2 0 0 (bureau de liaison) Tél. 2351111
Las publicaciones de Eurostat están clasificadas por temas y por series. La clasificación se encuentra al
final de la obra. Para mayor información sobre las publicaciones, rogamos se pongan en contacto con
Eurostat.
Para los pedidos, diríjanse a las oficinas de venta cuyas direcciones figuran en la página interior de la
contracubierta.
Eurostats publikationer er klassificeret efter emne og serie. En oversigt herover findes bag i hæftet.
Yderligere oplysninger om publikationerne kan fås ved henvendelse til Eurostat.
Bestilling kan afgives til de salgssteder, der er anført på omslagets side 3.
Die Veröffentlichungen von Eurostat sind nach Themenkreisen und Reihen gegliedert. Die Gliederung ist
hinten in jedem Band aufgeführt. Genauere Auskünfte über die Veröffentlichungen erteilt Eurostat.
Ihre Bestellungen richten Sie bitte an die Verkaufsbüros, deren Anschriften jeweils auf der dritten
Umschlagseite der Veröffentlichungen zu finden sind.
Οι εκδόσεις της Eurostat ταξινομούνται κατά θέμα και κατά σειρά. Η ακριβής ταξινόμηση αναφέρεται στο
τέλος κάθε έκδοσης. Για λεπτομερέστερες πληροφορίες σχετικά με τις εκδόσεις, μπορείτε να απευθύνεσθε
στην Eurostat.
Για τις παραγγελίες μπορείτε να απευθύνεσθε στα γραφεία πώλησης, των οποίων οι διευθύνσεις αναγράφονται
στη σελίδα 3 του εξωφύλλου.
Eurostat's publications are classified according to themes and series. This classification is indicated at the
end of the publication. For more detailed information on publications, contact Eurostat.
Orders are obtainable from the sales offices mentioned on the inside back cover.
Les publications d'Eurostat sont
classées par thème et par série. Cette classification est précisée à la fin
de l'ouvrage. Pour des informations plus détaillées sur les publications, contactez Eurostat.
Pour les commandes, adressez-vous aux bureaux de vente dont les adresses sont indiquées à la page 3
de la couverture.
Le pubblicazioni dell'Eurostat sono classificate per tema e per serie. Tale classificazione è precisata alla
fine dell'opera. Per informazioni più dettagliate sulle pubblicazioni rivolgersi all'Eurostat.
Per eventuali ordinazioni rivolgersi a uno degli uffici di vendita i cui indirizzi figurano nella 3
apagina
della copertina.
De publikaties van Eurostat zijn ingedeeld naar onderwerp en serie. Deze indeling is achter in het boek
opgenomen. Voor nadere informatie over de publikaties kunt u zich wenden tot Eurostat.
Luxembourg: Office for Official Publications of the European Communities, 1991
Catalogue number: CA-AR-91-011-EN-C
Foreword
Two Important changes have taken place in 1988 with regard
to the collection of external trade statistics:
(i) The introduction of the Single Administrative Document,
which not only covers trade in Community goods
between Member States but Is also intended to be used
for the corresponding formalities in trade with
non-member countries. This simplification of declaration pro
cedures in the exchange of goods marks an important
step towards completion of the internal market.
(ii) The simultaneous entry into force of a new goods classi
fication known as the Combined Nomenclature (CN),
which is intended to meet Common Customs Tariff and
statistical requirements alike. This nomenclature is
based on the Harmonized Commodity Description and
Coding System (HS), whose aim is to enhance the world
wide comparability of external trade statistics.
As a result of both these changes, customs and statistical
departments were faced with a considerable amount of work
until the procedures had been properly introduced and
tested and formed part of normal working practice.
This meant that there were delays in the forwarding of data
in all the Member States. In addition, there was bound to be
a higher quota of errors and corrections, so that the first
month's data are not directly comparable with those of the
preceding year and therefore need to be interpreted with
caution.
In particular, it should be noted that considerable diver
gences have arisen at subheading level between the Combi
ned Nomenclature and the formerly used Nimexe, leading to
a break in the goods-related time series between 1987 and
1988. Up to December 1987 this Bulletin used the SITC Rev.
2, which was worked out using the 6-digit Nimexe, while
from January 1988 it uses the SITC Rev. 3, which has been
drawn up using the 8-digit subheadings of the Combined
Nomenclature.
As an aid to interpretation of the statistics, Eurostat has
published in Theme 6 'Foreign Trade, Series E: Methods'
brochures entitled 'Nomenclature of goods, CN-Nimexe cor
relation tables'. These provide a comparison between the old
and new nomenclatures as well as showing the links bet
ween the Combined Nomenclature (CN) and its offshoots.
Eurostat will be glad to provide users of European statistics
with any further information or explanations they may require
with regard to these new developments.
Important note
As from October 1990 the foreign trade figures of the Federal Republic of Germany, the other Member States and of EUR 12
concern the Federal Republic of Germany as constituted from 3 October 1990.
Table of contents
Commentary
Charts
General summary of trade by country:
Tab. 1 : Yearly and quarterly data
Tab. 2: Monthly data
General summary of trade by commodities:
Tab. 3: Yearly and quarterly data
Tab. 4: Monthly data
Trends in trade by country:
Tab. 5: World, intra- and extra-EC
Tab. 6: Intra-EC by member countries
Tab. 7: Major areas
Trends in trade by commodities:
Tab. 8: SITC sections
Trade by partner countries:
Tab. 9: All commodities (monthly cumulative data)
Tab. 10: SITC sections and main partner countries (quarterly cumulative data)
Indices:
Tab. 11: Volume and unit value indices
Trade of main non-Community countries:
Tab. 12: Trends in total trade and with the EC (EUR 12)
Conversion rates:
Tab. 13: Member countries, United States of America, Japan and Switzerland
EC trade in agricultural products:
Tab. 14: Main product groups
Tab. 15: Products subject to common agricultural policy regulations
EC trade in petroleum products:
Tab. 16: Petroleum and petroleum products
EC and world trade:
Tab. A: World, Community and main non-Community countries
Trade of the FR of Germany, including West Berlin, as constituted prior to 3 October 1990:
Tab. B: Trade by countries
Tab. C: Trade by products
Catalogue of regular publications of external trade
XVII
2
5
8
11
16
24
30
52
92
94
98
100
101
104
107
Symbols and abbreviations used
EUR 12:
UEBL:
DK:
D:
GR:
E:
F:
IRL:
I:
NL:
P:
UK:
Total of the EC member countries
Belgo-Luxembourg Economic Union
Denmark
Federal Republic of Germany
Greece
Spain
France
Ireland
Italy
Netherlands
Portugal
United Kingdom
0: Data less than half the unit used
Mio: Million
Mrd: 1000 million
ECU: European currency unit
Eurostat: Statistical Office of the European Communities
Commentary and graphs
(The commentary refers to the state of the CRONOS database on 31. 10. 1991)
Available data in this issue:
May 1991
June 1991
July 1991
August 1991
(The tables refer to the sta
Analysis and commentary:
Methodological notes:
EUR 12
X
UEBL
X
X
X
X
DK
X
X
X
X
D
X
Χ
Χ
GR
Χ
Χ
χ
χ
Ε
Χ
χ
χ
χ
F
X
χ
χ
χ
IRL
Χ
Ι
X
X
Χ
X
NL
Χ
Χ
Χ
Χ
e of the CRONOS database on 6. 11. 1991)
Page VI
See Glossarium 1991
As from the beginning of January 1988: SITC, Revision 3
Ρ
Χ
Χ
Χ
Χ
υκ
χ
Χ
Χ
Seasonal Adjustment: Results
Due to a considerable delay in the availability of
Ireland's external trade figures, the trade series for
the European Community as a whole have not been
updated. Trade figures for the European
Community as a whole are only available up to May
1991.
Between 1987 and the beginning of 1990, the sea
sonally adjusted European Community exports to
the rest of the world (extraEC) showed a smooth
upward trend. Since the beginning of 1990,
however, the trend is clearly heading downwards, a
tendency which is confirmed by our forecasts up to
the beginning of 1992. The effects of the German
unification and of the creation of the EC single
market and the lacklustre economic situation in the
United States help explain this phenomenon
Seasonally adjusted European Community imports
from the rest of the world (extraEC) showed a
clearly upward movement between the beginning of
1987 and the beginning of 1989. Between 1989 and
the end of 1990, seasonally adjusted imports
stabilised but they picked up again at the beginning
of 1991. A further stabilisation around this new
higher level is expected for the second half of 1991.
EUR 12 Exports ExtraEC
EUR 12 Imports ExtraEC
Mrd. ECUMrd. ECU
1984 1985 1 1989 1990 1991
1984 1985 1986 1987 1988
— Unadjusted — Seasonally Adjusted
— Unadjusted — Seasonally Adjusted
EUR 12 Imports IntraEC
Mrd. ECUι A . ^
, Λ ft JjrV?
i
y w f
u U f n '
/νΤΠ
Λ Λ « Ρ ^ 1
1
LWÍ
Ï
"
» . . . Λ
JwVi
'
J L N W I ¿ MTV ν
A
Jí^r^ri\
! '
Mlf
y
Π " y '
wj
V
y
J
y
|
5
4
3
2
1
0
•1
2
3
4
■5
6
7
■a
9
EUR 12 Trade Balance ExtraEC
Mrd. ECU1984 1985 1986 1887 1988 1989 1990 1991
— Unadjusted — SMsonaly Adjusted 19*4 1»&6 1β«β 1987 1988 1949 1990 1991
TABEL O - EUR 12 EXPORTS, IMPORTS, TRADE BALANCE (1)
Seasonally Adjusted Serles(2) - Mrd. ECU
Period
Jan-88
Feb-88
Mar-88
Äpr-88
May-ββ
Jun-88
Jul-88
Aug-68
Sep-88
Oct-88
Nov-88
Dec-88
Jan-89
Feb-89
Mar-89
Apr-89
May-89
Jun-89
Jul-89
Aug-89
Sep-83
Oct-89
Nov-89
Dec-89
Jan-90
Feb-90
Mar-90
Apr-90
May-90
Jun-90
Jut-90
Aug-90
Sep-90
Oct-90
Nov-90
Dec-90
Jan-91
Feb-91
Mar-91
Apr-91
May-91
Exports
Not Adjusted
22,7
27,1
31,5
27,8
29,7
31,9
30,6
28,5
31,1
32,6
33,1
35,8
30,3
30,9
34,8
33,7
33,4
37,4
34,0
31,3
34,4
37;e
37,1
37,4
34,1
33,6
37,7
33,3
35,6
35,1
35,5
31,4
31,2
38,8
36,9
35,4
32,6
31,7
34,4
34,5
34,4
Extra-EC
Seasonally
Adjusted
25,8
28,3
28,6
29,4
30,2
30,6
30,4
31,4
31,6
31,5
31,1
32,9
33,4
33,1
34,2
33,6
33,5
36,0
34,3
34,1
36,3
34,6
35,0
34,9
36,9
36,0
35,6
35,0
35,2
35,0
34,5
34,5
33,3
35,2
35,0
33,7
34,5
33,9
34,0
34,4
34,2
Imports
Not Adjusted
25,9
29,5
34,4
30,2
31,9
33,0
31,9
31,1
34,2
35,4
34,7
34,1
35,4
34,3
38,0
37,6
39,1
40,1
35,3
34,4
37,7
40,6
39,1
34,8
39,6
35,6
40,2
37,1
39,4
37,8
36,8
35,2
36,6
43,9
41,9
36,0
43,0
37,3
39,2
43,3
42,3
Extra-EC
Seasonally
Adjusted
26,6
30,0
31,3
30,5
31,9
32,2
33,4
33,9
33,8
34,2
33,1
35,5
35,2
36,0
36,9
37,0
38,4
38,9
37,6
36,9
38,2
37,6
37,9
37,0
38,5
37,6
38,2
37,7
38,0
37,6
37,3
38,3
37,9
40,2
40,3
38,9
41,1
39,5
38,9
41.1
41,2
Imports
Not Adjusted
35,2
42,9
49,2
42,4
45,6
47,3
43,2
37,5
46,3
50,1
49,3
48,9
47,7
49,1
54,1
52,0
52,5
57,3
50,4
42,5
50,8
58,1 ·
56,4
51,5
53,9
52,3
60,6
54,4
56,6
54,7
54,8
44,5
53,3
62,3
61,1
52,6
59,3
56,0
59,6
60,0
59,1
Intra-EC
Seasonally
Adjusted
38,1
42,1
42,8
43.0
45,0
45,2
44,8
46,9
46,1
47,4
47,4
49,2
49,3
49,9
50,5
50,5
51,7
54,1
52,5
52,0
53,0
52,8
53,8
53,6
55,4
53,3
54,5
54,5
54,5
54,0
54,8
55,4
56,0
56,8
56,3
53,2
59,2
57,2
56,8
57,2
57,7
Trade Balance Extra-EC
Not Adjusted
-3,2
-2.4
-2,9
-2,4
-2,2
-1,1
-1.2
-2,6
-3,1
-2,7
-1,7
1,6
-5,1
-3,4
-3.2
-3,9
-5,7
-2,7
-1,3
-3,0
-3,3
-3,0
-2,0
2,5
-5,5
-2,0
-2,5
-3,7
-3,8
-2,7
-1,3
-3,8
-5.3
-5,2
-5,0
-0,6
-10,5
-5,7
-4,9
-8,8
-7,9
Seasonally
Adjusted
-0,7
-1,8
-2,7
-1,1
-1.7
-1,7
-3,0
-2,4
-2,2
-2,7
-2,1
-2.6
-1,8
-2,9
-2,7
-3,3
-4,9
-2,9
-3,2
-2,8
-1.9
-3,0
-2,9
-2,1
-1,6
-1,6
-2.6
-2,7
-2,8
-2,6
-2,8
-3,8
-4,6
-5,0
-5,3
-5,1
-6,6
-5,7
-5,0
-€,7
-7,0
(1 ) As from October 1990, the territory of the Federal Republic of Germany includes the territory of the former German Democratic Republic, including East Berlin.
GLOBAL TRENDS: Results for July 1991.
The gap between the import and export growth rates for the Community In July
was over 12 points.
In July 1991 the Community's external trade deficit
was 5.3 billion ecus. Although less than the average
deficit for the first quarter of 1991, it was a net
deterioration (of 4.5 billion) compared with July 1990.
This was due partly to Germany's extraCommunity
trade, which fell from a surplus of 2.2 billion ecus in
July 1990 to virtual equilibrium in July of this year.
The domestic energy deficit made inroads into the
surplus, but was not the main factor. The Com
munity's crude oil bill was $17.97 per barrel in July
1991, which was close to the average for the second
quarter of 1991. This cost went up by 14% in dollar
terms between July 1990 and July 1991, which is an
increase of less than 5% in ecu terms.
Community imports exploded with an increase of
21.1% over July 1990, under the impact of products
imported into the Community by unified Germany
(+32.4%). Imports into the Netherlands, Spain and
Denmark increased substantially over July 1990.
This can be explained either in terms of a sudden
spurt after slow increases in May and June or as an
upturn in activity after the check caused by the Gulf
war.
Exports increased by 9% over July 1990, and fol
lowed the same pattern as imports, i.e. following an
upturn in April there was a downturn in May and June
compared with the corresponding periods in 1990.
ExtraCommunity exports from Denmark and the
Netherlands increased substantially, while those
from Greece were more than half as much again as
exports in July 1990. However, over the period
JanuaryJuly 1991 exports remained some 2%
below those for the first seven months of 1990.
In July 1991 the United States had a deficit of 8.2
billion ecus, an improvement of 1.6 billion ecus over
July 1990. Imports in July continued the upturn re
corded after the first quarter, i.e. +9.2%
in ecu terms,
which is equivalent to virtual stagnation in dollar
terms compared with July 1990. Exports increased
by nearly 20% in ecu terms, which in dollar terms is
equivalent to 10%.
Japan had a surplus of 5.2 billion ecus in July 1991,
1.5 billion ecus up on July 1990. Japanese imports
increased by 19.6%
in ecu terms between July 1990
and July 1991, i.e. less than 1% in terms of the yen
and nearly 10% in dollar terms.
Exports grew by 23.4% in ecu terms, which is less
than 5% in yen and nearly 14% in dollars.
GR.
IMPORTS AND EXPORTS (CIF.FOB)
annual
%
change In value
10
Jl
10
¡pi
20
90
90
91
90 91
0107
07
EÜR12
90
91
0107
USA
90
91
07
Import
•10
■20
90
91
90 91
0107
07
JAPAN
COUNTRIES
EUR-12(2)
United States
Japan
BLEU
Denmark
Germany
Greece
Spain
France
Ireland
Italy
Netherlands
Portugal
United Kingdom
EUR-12(2)
United States
Japan
BLEU
Denmark
Germany
Greece
Spain
France
Ireland
Italy
Netherlands
Portugal
United Kingdom
EUR-12(2)
United States
Japan
BLEU
Denmark
Germany
Greece
Spain
France
Ireland
Italy
Netherlands
Portugal
United Kingdom
Memorandum item
1 USDs.-ECU
1YEN = ...ECU
1989
-33,7
-116,1
58,4
-2,2
1,2
64,0
-7,8
-19,3
-14,9
3,1
-11,2
3,5
-5,6
-41,1
15,2
14,6
20,6
15,2
10,5
15,4
40,0
27,3
16,6
19,8
18,7
14,2
13,4
7,8
13,8
21,3
11,3
16,7
11,3
13,1
48,6
16,0
16,2
18,6
17,6
16,7
23,5
11,7
7,3
-0,3
TABLE 1
-1990
-42,9
-95,2 "
41,2
-5,6
2,4
47,4
-9,2
-20,1
-17,3
2,3
-9,3
0,3
-6,7
-31,9
TRADE BALANCE, IMPORTS AND EXPORTS (1)
1991
1
1991
II
1990
01-07
1991
01-07
TRADE BALANCE (Mrd ECU)
-20,9
-13,2 "
12,9
-1,5
0,5
3,0
-2,5
-4,7
-5,0
0,4
-4,2
-0,2
-1,8
-6,8
-22,5 '
-13,5
15,9
-1,6
0,6
-1,0
-2,3
-5,7
-3,2
-3,4
-1,3
-2,2
-5,7
-21,5
-52,8 "
27,5
-2,8
1,1
35,0
-6,0
-12,8
-9,3
1,8
-6,2
0,9
-3,7
-22,1
IMPORTS
-48,7 "
-34.9 "
33,9
-3,6
1,2
2,0
-5,3
-12,8
-9,6
-7,5
-2,2
-4,6
-14,6
1990
07
-0,8
-9.8 "
3,7
0,1
-0,0
3,9
-0,8
-1,6
-1,3
0,3
1,3
0,1
-0,5
-3,0
%
change on the corresponding period of the previous year
3,6
-9,3 "
-3,9
6,0
2,9
10,3
6,0
7,7
4,9
3,8
2,9
5,3
14,0
-1,6
3,0
-13,7 "
1,4
2,6
-0,4
19,8
-2,1
5,4
0,8
3,6
-1,4
2,0
8,1
-6,3
10,0
1,4
"
8,1
5,2
7,6
24,9
-6,5
9,0
4,6
5,4
5,1
6,7
-4,9
2,7
-6,8 "
-5,2
6,4
3,7
7,3
29,2
7,6
5,5
3,5
4,0
6,2
16,8
-2,1
EXPORTS
8,5 '
-4,0
6,8
5,5
5,9
23,3
-4.3
8,7
3,8
3,3
5,9
8,7
-4A
1,1
-9,1 "
-9,0
4,0
2,3
11,8
-8,2
1,0
12,9
3,0.
2,0
3,9
9,7
-3,3
% change on the corresponding period of the previous year
1,6
-6,2 "
-9,8
2,3
7,3
2,8
-7,8
9,3
3.9
-0,6
4,7
2,0
11,7
4,6
-6,6
-6,1 "
1,2
1,6
-1.2
-2.4
-12,6
14,7
-0,7
-3,6
4,2
-1,6
0,9
0,3
-0,7 '
10,4
15,5
5,8
7,7
2,0
14,1
13,8
6,2
0,1
0,1
-2.4
3,8
4,6
-2,7 "
-9,6
2,9
8,9
3,9
10,0
8,8
5,1
3,9
7,1
5,6
18,1
3,6
EXCHANGE RATE
-1,9 '
4,5 "
10,2
4,3
5,8
1,1
7,8
12,9
3,9
1,9
0,8
0,4
3,6
5,4
-7,1
-14,8
5,1
3,5
4,2
9,5
40,9
8,6
-3,5
3,0
5,8
22,6
6,7
% change on the corresponding period of the previous year
-13,5
-17,3
-10,1
-0,4
3,0
15,5
-9,9
-20,1
-2,0
8,8
-13,2
-18,3
1991
07
-5,3 '
-8,2 "
5,2
-0,5
0,0
-0,0
-0,5
-2,3
-1,4
0,1
-0,8
-0,7
-2,0
21,1 '
9,2 "
19,6
17,4
22,3
28,9
-3,3
17,0
11,0
11,7
22,0
16,1
2,7
9,0 '
19,8 "
23,4
8,9
25,4
9,7
58,4
5,3
11,3
1,5
11,7
6,4
12,1
9,8
18,8
(1 ) External Trade Statistics (Imports CIF, Exports FOB).
(2) EUR-12 includes only extra flows. Figures for Member States include world flows.
* Estimate.
EXTRA-COMMUNITY TRADE BY PARTNER COUNTRY: Results for July 1991.
Growing Community deficit with the United States.
Upturn in trade with developing countries.
The worsening of the deficit compared with July 1990
was due to a reduction of 3.7 billion ecus in the
Community's trade with the industrialized countries,
mainly with the United States (2.2 billion), and to a
lesser extent with Japan (0.8 billion). The trade
bal-ance with EFTA worsened slightly (by 0.2 billion).
Imports from the United States were nearly a third up
on July 1990, following the low growth rates in May
and June compared with 1990. The rise in the dollar
(+10%) between July 1990 and July 1991 only partly
explains this surge. The higher cost of imports from
the United States did not discourage Community
purchases. The growth rate in imports from Japan
was 22.3%, which to a great extent reflects the rise
in the yen against the ecu (+18.8%). Community
exports to the industrialized countries again
in-creased in July 1991 compared with July 1990, with
a fallback at the start of the year compared with the
corresponding period in 1990. Exportsto Japan and
the EFTA countries recovered slightly (by +3.7% and
+5.7% respectively over July 1991), while there was
a downturn in exports to the United States (-3.1%).
The balance of the Community's trade with the
de-veloping countries was in surplus for the first time
since the beginning of 1991. It fell by 0.5 billion ecus
from its July 1990 level, to a level of +0.2 billion.
Trade flows with this area increased substantially
between July 1990 and July 1991, in terms of both
imports (+20.8%) and exports (+15.2%), thus
reflect-ing the resumption of commercial activity after the
war. Imports from the Asian NICs continued to grow
(+30.7%) under the pressure of Community demand
for industrial products. Community imports from the
OPEC countries grew by one third. Since the price
of Community's oil supplies rose by 5% in ecu terms
between July 1990 and July 1991, it seems that the
increase in imports was due mainly to replenishment
of petroleum product stocks. Imports from both the
Mediterranean, and the ACP countries increased by
22%. Exports to the Asian NICs grew at
approxi-mately the same rate as imports (+28.1% and
+30.7% respectively), thus maintaining an
equili-brium in the Community's balance of trade with this
area. Exports to the OPEC countries seemed to
recover from the second quarter of 1991 onwards,
and were 19.7% above the July 1990 figure. This
increase was +16.1% for the ACP countries,
follow-ing a fall in the first quarter of 1991 compared with
1990. Community exports to the Mediterranean
countries were sluggish (+3.3%).
The Community's balance of trade with Central and
Eastern Europe was stable in relation to July 1990
(-0.4%). There was strong growth in the trade
be-tween these countries and the Community following
the unification of Germany in October 1990.
GR . II - EXTRA TRADE BALANCE (MAIN PARTNERS)
(BIO ECU)
JAPAN
JAPAN
TABLE II - EUR-12 TRADE BALANCE AND TRADE FLOWS BY MAIN PARTNERS (1)
EXTRA-EC whose
INDUSTRIALIZED THIRD
COUNTRIES
- United States
-Japan
- E R A
DEVELOPING COUNTRIES
-Asian NICs (2)
-OPEC
- Mediterranean Basin
-ACP
COUNTRIES IN MIDDLE
AND EASTERN EUROPE
EXTRA-EC whose
INDUSTRIALIZED THIRD
COUNTRIES
- United States
-Japan
-EFTA
DEVELOPING COUNTRIES
-Asian NICs (2)
-OPEC
- Mediterranean Basin
-ACP
COUNTRIES IN MIDDLE
AND EASTERN EUROPE
INTRA-EC
EXTRA-EC whose
INDUSTRIALIZED THIRD
COUNTRIES
- United States
-Japan
-EFTA
DEVELOPING COUNTRIES
-Asian NICs (2)
-OPEC
- Mediterranean Basin
-ACP
COUNTRIES IN MIDDLE
AND EASTERN EUROPE
1990
STRUC-TURE
%
-100,0
59,7
18,4
10,0
23,2
31,1
6,3
9,7
9,1
4,3
6,5
-100,0
59,8
18,2
5,4
26,5
32,0
5,5
8,4
10,9
4,0
6,5
(1 ) External Trade Statistics (Imports CIF, Export
(2) Asian NICs include the following countries: Si
* Estimate.
1989
-33,7
-22,2
-5,6
-25,2
5,4
-5,9
-3,7
-5,8
3,5
- 3 , 0
-3,1
15,2
13,4
22,4
11,3
13,2
17,6
8,3
28,2
23,1
11,7
16,4
15,5
13,8
12,0
8,7
24,1
12,0
15,5
16,4
12,3
14,9
6,9
24,3
5 FOB).
1990
1991
I
1991
II
1990
01-07
1991
01-07
1990
07
T R A D E BALANCE (Mrd ECU)
-42,9 -20,9 -22,5
-25,5 -12,5 -17,0
-8,6 -5,9 -7,6
-23,5 -6,4 - 8 , 2
2,8 -0,4 -0,9
-9,5 -5,3 -2,6
-3,1 -1,4 -0,8
-9,5 -3,4 -1,4
3,3 -0,4 0,7
-3,5 -1,3 -0,6
-2,9 - 1 , 0 -0,9
-21,5 -48,7
-15,2 -33,8
- 6 , 2 -15,1
-13,2 -17,1
2,7 -1,6
-1,5 -7,6
' - 0 , 9 -2,3
' -2,4 -5,1
3,1 0,7
' -0,8 - 2 , 2
' -2,1 -2,3
-0,8
-0,7
0,6
' -1,7
-0,2
0,7
- 0 , 0
0,1
0,9
' -0,1
' -0,4
IMPORTS
% change on the corresponding period of the previous year
3,6 3,0 10,0
2,0 0,7 8,7
1,8 - 3 , 0 8,7
- 0 , 2 5,5 16,1
5,9 2,4 4,9
5,0 1,7 9,9
-1,3 12,5 18,5
10,1 3,7 16,9
13,8 5,1 8,2
2,7 3,3 6,6
10,1 28,2 18,9
2,7 8,5
2,6 6,7
4,0 6,5
-0,6 12,6
5,3 4,3
2,1 7,7
-3,3 17,6
4,5 12,7
10,0 8,5
- 5 , 0 7,1
2,9 24,3
1,1
2,8
1,3
-1,3
8,5
-4,8
-6,1
-1,2
2,7
-8,3
10,9
6,3 5,3 6,7 ' 6,8 6,9 ' 8,4
EXPORTS
% change on the corresponding period of the previous year
1,6 -6,6 -0,7
0,9 -8,1 -5,1
-1,9 -18,7 -8,7
7,5 -8,8 -2,4
3,2 -2,6 -4,7
2,5 -7,7 3,0
1,5 -3,4 13,7
1,2 -7,1 4,1
12,1 -2,1 -2,4
0,1 -13,0 -8,5
12,6 19,9 30,1
4,6 -1,9
4,3 -5,2
2,1 -12,1
13,0 -4,3
6,3 -2,4
6,7 0,2
5,4 8,4
8,6 1,6
17,3 -1,4
2,0 -7,3
5,6 26,8
5,4
4,5
5,8
11,4
3,1
9,6
10,5
9,6
18,9
-15,4
-2,3
ngapore, South Korea, Taiwan and Hong Kong.
1991
07
-5,3
-4,4
-1,6
-2,5
-0,4
0,2
-0,1
-0,3
0,4
-0,2
-0,4
19,5
31,8
22,4
8,2
20,8
30,7
33,0
21,7
22,2
29,3
12,6
7,6 '
9,0
2,8
-3,1
3,7
5,7
15,2
28,1
19,7
3,3
16,1 '
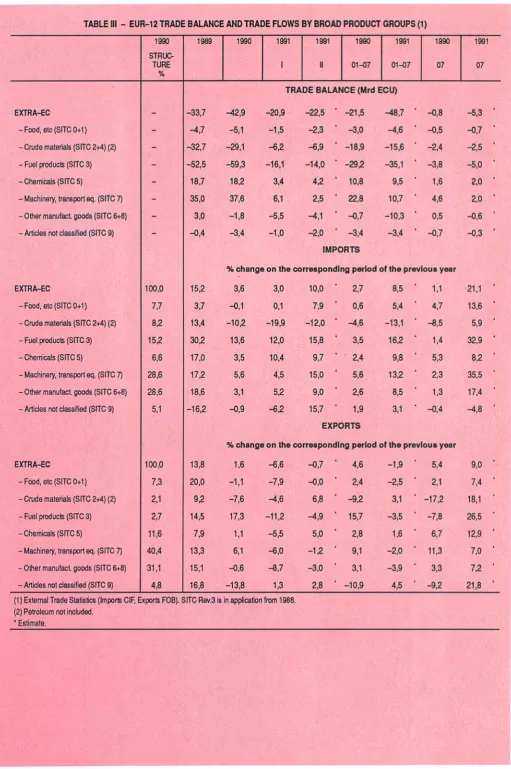
EXTRACOMMUNITY TRADE BY PRODUCT: Results for July 1991
The growth In Imports of machinery/transport equipment (SITC 7), and to a lesser extent
fuel products (SITC 3), contributed to the worsening extraCommunity balance of trade.
Of the increase in the extraCommunity deficit,
2.6 billion was due to the reduction of the surplus on
machinery/transport equipment, 1.2 billion to the
higher energy bill, and 1 billion to the balance of other
manufactured goods (SITC 6+8). The only improve
ment over July 1990 was in chemicals (SITC 5), the
surplus having increased by 0.4 billion.
Imports of machinery/transport equipment increased
by 35.5% over July 1990 under the impetus of the
demand from unified Germany, which also caused
imports of other manufactured goods (SITC 6+8) to
rise (+17.4%). Exports of machinery/transport equip
ment and other manufactured goods increased by
7% over July 1990, which was a modest increase
following a first halfyear in which levels were below
the corresponding period in 1990.
Imported energy products were onethird higher in
value terms in July 1991 than in July 1990. Following
an easing of tension on the petroleum market, the
Community's oil bill was $17.97 per barrel in July
1991, i.e. approximately the same level as the aver
age for the first half of 1990. The Member States
appear to be taking advantage of the more stable
prices to replenish their stocks. Exports of energy
products, which are still very low, were one quarter
higher than in July 1990.
Imports of food, etc. (SITC 0+1) grew by 13.6%
between July 1990 and 1991, following a decrease
in June 1991 compared with June 1990. Growth in
exports of food (+7.4%) was down to nearly half that
for imports.
Exports of chemicals continued to follow the upward
trend which started at the end of the first quarter.
With a growth rate of nearly 13% between July 1990
and July 1991, chemicals are a dynamic component
of Community exports. Imports of these products
were 8.2% higher in July 1991 than in July 1990.
GR. Ill
EXTRA TRADE BALANCE (PRODUCT GROUPS)
(BIO ECU)
Manufactures
so
»
15
0
• 1 5 ·
•30 · ·
■ 4 5
60
15"
■3D·
Manufactures
Manufactures
TABLE III - EUR-12 TRADE BALANCE AND TRADE FLOWS BY BROAD PRODUCT GROUPS (1)
EXTRA-EC
-Food, etc (SITC 0+1)
-Crude materials (SITC 2+4) (2)
- Fuel products (SITC 3)
- Chemicals (SITC 5)
- Machinery, transport eq. (SITC 7)
- Other manufact goods (SITC 6+8)
- Articles not classified (SITC 9)
EXTRA-EC
-Food, etc (SITC 0+1)
- Crude materials (SITC 2+4) (2)
- Fuel products (SITC 3)
- Chemicals (SITC 5)
- Machinery, transport eq. (SITC 7)
- Other manufact goods (SITC 6+8)
- Articles not classified (SITC 9)
EXTRA-EC
-Food, etc (SITC0+1)
- Crude materials (SITC 2+4) (2)
- Fuel products (SITC 3)
-Chemicals (SITC 5)
- Machinery, transport eq. (SITC 7)
- Other manufact goods (SITC 6+8)
- Articles not classified (SITC 9)
(1 ) External Trade Statistics (Imports CIF, E
(2) Petroleum not included.
* Estimate.
1990
STRUC-TURE
%
-~
100,0
7,7
8,2
15,2
6,6
28,6
28,6
5,1
100,0
7,3
2,1
2,7
11.6
40,4
31,1
4,8
¿ports FOB). !
1989
-33,7
-4,7
-32,7
-52,5
18,7
35,0
3,0
-0,4
15,2
3,7
13,4
30,2
17,0
17,2
18,6
-16,2
13,8
20,0
9,2
14,5
7,9
13,3
15,1
16,8
1990
1991
I
1991
II
1990
01-07
1991
01-07
T R A D E BALANCE (Mrd ECU)
-42,9 -20,9 -22,5
-5,1 -1,5 -2,3
-29,1
- 6 , 2 -6,9
-59,3 -16,1 -14,0
18,2 3,4
4,2
37,6 6,1 2,5
-1,8 -5,5 -4,1
-21,5 -48,7
- 3 , 0 -4,6
-18,9 -15,6
-29,2 -35,1
10,8 9,5
22,8 10,7
-0,7 -10,3
-3,4 - 1 , 0 - 2 , 0 ' -3,4 -3,4
IMPORTS
1990
07
-0,8
-0,5
-2,4
-3,8
1,6
4,6
0,5
-0,7
% change on the corresponding period of the previous year
3,6 3,0 10,0
-0,1
0,1 7,9
-10,2 -19,9
-12,0
13,6 12,0 15,8
3,5 10,4 9,7
5,6
4,5
15,0
3,1 5,2
9,0
2,7 8,5
0,6 5,4
-1,6 -13,1
3,5 16,2
2,4 9,8
5,6 13,2
2,6 8,5
-0,9 - 6 , 2
15,7
'
1,9 3,1
EXPORTS
1,1
4,7
-8,5
1,4
5,3
2,3
1,3
-0,4
% change on the corresponding period of the previous year
1,6 -6,6 -0,7 '
-1,1 -7,9 -0,0 '
-7,6 -4,6 6,8
'
17,3 -11,2
-4,9
"
1,1 -5,5 5,0 '
6,1 -6,0 -1,2 '
-0,6 -8,7 -3,0 '
4,6 -1,9 '
2,4 -2,5 ·
- 9 , 2 3,1 '
15,7 -3,5 "
2,8 1,6 "
9,1 -2,0 '
3,1 -3,9 "
-13,8 1,3 2,8 ' -10,9 4,5 '
3 ITC Rev.3 is in application from 1988.
5,4
2.1
-17,2
-7,8
6,7
11,3
3,3
-9,2
1991
07
-5,3
-0,7
-2,5
-5,0
2,0
2,0
-0,6
-0,3 '
21,1
13,6
5,9
32,9
8,2
35,5
17,4
-4,8 '
9,0
7,4
18,1
26,5
12,9
7,0
7,2
INDIVIDUAL MEMBER STATES' AND INTRACOMMUNITY TRADE: Results for July 1991.
Reduction of 2 billion in Germany's intra and extraCommunity balances affects the
Community's balances.
The Community's deficit increased in July 1991 com
pared with July 1990: Germany's surplus on extra
Communitv trade fell from 2.2 billion ecus in July
1990 to 0.1 billion ecus in July 1991. The demand
for industrial products stimulated imports, while more
domestic production was routed more to the internal
market than to exports. The balances of the Nether
lands, the United Kingdom and Spain fell by 0.7 bil
lion, 0.5 billion and 0.5 billion respectively. Greece's
extraCommunity balance increased by 0.2 billion
due to a substantial rise in exports.
In July 1991 intraCommunity trade was up by 12.6%
over July 1990, and grew faster than in the previous
six months. This rate was below the 21.1% growth
rate for extraCommunity imports. These were ex
ceptionally high, reflecting the slowdown in activity
caused by the Gulf war. The effect on intraCom
munity trade was less pronounced.
Germany's intraCommunity trade showed a deficit
of 0.2 billion in July 1991, i.e. a drop of 1.9 billion
compared with July 1990. Overthe same period Italy
moved from a surplus of 0.9 billion to a position of
virtual equilibrium (+0.1 billion). The United Kingdom
improved this position as regards intraCommunity
trade and reducing its deficit by 1.5 billion in July
1991.
GR
.
IV
MEMBER STATES' EXTRA AND INTRA TRADE BALANCES
(BIO ECU)
:I_JP£JB
E C BL· OK
E X T R A I I Ol 07/Ö0
D Q R
Ol 0 7 / 9 1
^ IRL· I NL F» U K
I N T R A |g3 0 1 0 7 / 9 0 H i 01-07νβΊ
E C E X T R A
ES-L
o
O K 0 7 / 9 0
D
Η
Q R 0 7 / 9 1
E R
I N T R A
I R L
E3
TABLE IV - EXTRA - AND INTRA - EC TRADE BALANCE (1 )
EUR-12
-extra
-intra (2)
BLEU
-extra
-intra
DENMARK
-extra
-Intra
GERMANY
-extra
- intra
GREECE
-extra
-intra
SPAIN
-extra
-intra
FRANCE
-extra
-intra
IRELAND
-extra
-intra
ITALY
-extra
-intra
NETHERLANDS
-extra
-intra
PORTUGAL
-extra
-intra
UNITED
KINGDOM
-extra
-intra
1989
-33,7
1,2
-5,4
2,7
1,0
0,2
25,0
38,6
- 3 , 2
-4,7
-10.8
-8,9
0,9
-15,4
0,1
3,0
-4,4
-6,8
-15,7
18,5
-2,3
- 3 , 4
-18,8
-22,5
1990
-42,9
-6,9
-6,3
0,1
1,6
0,8
23,0
24,0
-3,3
-5,9
-11,5
- 9 , 2
-2,0
-14.9
-0,1
2,4
-5,0
-4,3
-18,5
18,0
-2,8
-4,1
-18,0
-14,0
1991
I
1991
II
1990
01-07
1991
01-07
TRADE BALANCE (Mrd ECU)
-20,9
-2,6
-2,2
0,5
0,2
0,4
2,0
0,9
-1.0
-1,5
- 3 , 2
-1,7
-2,5
-2,4
-0,2
0,5
-2,9
-1,4
-5,1
4,7
-0,6
- 1 , 2
-5,4
-1,4
-22,5
-3,0 '
-2,1
0,4
0,1
0,5
-0,6
-0.5
-0,9
-1.5
-3,4
-2,4
- 1 , 2
-1,8
-2,0
-1,4
-5,6
4,2
-0,8
-1,4
-5,8
0,1
-21,5
-3,6
-3,6
0,5
0,9
0,2
15,5
19,3
-2,3
-3,8
-6,9
-6,1
-0,1
-9,1
0,1
1,7
-2,7
-3,4
-9,8
10,3
-1,5
-2,2
-11,1
-11,0
-48,7
-8,2 '
^ . 6
0,7
0,2
0,9
1,6
0,2
-2.0
-3,3
-7,9
- 5 , 2
-3,7
-5,5
^ , 9
-2,7
-12,6
• 9,9
-1,7
-3,1
-12,8
-1,8
1990
07
-0,8
-0,9
- 0 , 2
0,3
0,0
-o.o
2,2
1,7
-0,3
-0,5
-0,7
-0,9
0,2
-1,4
0,0
0,2
0,4
0,9
- 1 . 2
1,2
-0,2
-0.3
-1,1
-1,9
1991
07
-5,3
-2,6 '
-0,3
- 0 , 2
-0,1
0,1
0,1
-0,2
-0,1
-0,4
-1,2
-1,1
-0,1
-1,3
!
:
0,0
0,1
-1,9
1,1
-0,3
-0.5
-1.6
-0,4
(1) External Trade Statistics (Imports CIF, Exports FOB).
(2) Intra trade balance not zero due to C IF/FOB recording and asymétrie recording of bilateral Hows by individual Member States.
* Estimate.
Trade of the EC with the countries of the Arab League
IMPORT
EXPORT
Countries of the Arab League:
Morocco, Algeria, Tunisia, Libya, Egypt, Sudan,
Mauritania, Djibouti, Somalia, Lebanon, Syria, Iraq,
Jordan, Saudi Arabia, Kuwait, Bahrain, Qatar,
United Arab Emirates, Oman, North Yemen,
South Yemen.
Food, beverages and tobacco
of which:
1. Dairy products and birds' eggs
2. Cereal and cereal preparations
3. Others
Fuel products
Raw materials
Chemicals
Machinery and transport equipment
of which:
4. Machinery
5. Transport equipment
Other manufactured goods
of which:
6. Textile yarns, fabrics, made-up articles,
etc.
7. Non-metallic mineral manufactures,
n.e.s.
8. Iron and steel
9. Manufactures of metal, n.e.s.
10. Others
Goods not classified
11. Others
TRADE OF THE EC BY COMMODITY CLASSES
MIO ECU
Impor t e I n t r a - E C
Impo r t s E x t r a - E C
E x p o r t s E x t r a - E C
BOOO
7000
6000
5000
4000
3000
2000
0 + 1
— /
N
^.'
/ ">
ry^z>^f^
I I I I I I I 1 I I I
: F o o d , b e v e r a g e s and t o b
*./
ι ι I ι ι I ι ι I ι ι
acco
x*
ι , I ι ι I ι
—
ι I ι ι
1989
1990
1991
8000
7000
6000
5000
4000
- 3000
- 2000
1500
8200
7000
6000
5000
4000
3000
2000
1500
1000
750
—
—
s
m— .\
1 —
·*"
~~ Λ.
/ \
J
ι ι I ι ι I ι ι I ι ι
3 : Fuel p r o d u c t s
/
"Ν /
^ /
\ /
X»
/
Nx
' \
/x ' \ / >
v , '
ι ι I ι ι I ι ι I ι ι
\
\
" N X *
X ^
x*~
s
ι ι Ι ι ι I ι
—
—
—
—
—
—
—
ι I ι ι
1989
1990
1991
8200
7000
6000
5000
4000
3000
2000
1500
- 1000
- 750
600
20000
17500
15000
12500
10000 —
7500
6000
6+8 : Other m a n u f a c t u r e d goods
1989
m
S ·πι I — l o g a r I I h m l o ( O l i t1990
TRADE OF THE EC BY COMMODITY CLASSES
MIO ECU
I m p o r t s
I n t r a E C
I m p o r t s E x t r a E C
E x p o r t s
E x t r a E C
5000
4000
3000
2000
1500
1000
750
2+4 : Raw mat er I a l s
5000
4000
3000
2000
1500
1000
750
l0
,
ι
ι I
ι
ι
I
ι
ι
I
ι
ι
I
ι
ι I
ι
ι
I
ι
ι
I
ι
ι
ι
ι
ι ι
ι
ι
ι
ι
ι
ι
ι
L _ _ ,
η η1989
1990
1991
10000
7500
5000
2500
2000
1500
—
Φ ^
ι
ι Ι
ι
ι
Ι
ι
ι
Ι
ι ι
5 : C h e m i c a l s
-
' " χ
, ~ - Ν
-\ /
ν
-
' " x
„
y - x
' " · - ■ * χ.» - » ^ , Χ _ χ ^
ι
ι Ι
ι
ι
Ι
ι
ι
Ι
ι ι
ι
ι Ι
ι
ι
Ι ι
—
—
—
ι
Ι ι ι
1989
1990
1991
10000
7500
- 5000
2500
2000
1 1500
1000
25000
20000
15000
12500
10000
7500
5000
7 : M a c h i n e r y and t r a n s p o r t e q u i p m e n t
< β •
s
tf
.«·■
S .
χ '
_1 ι Ι ι ι Ι ι ι Ι ι ι Ι ι ι Ι Ι Ι Ι 1 Ι Ι Ι L
, *
,
ν /
ν
' Χ
„
Χ
/
_1
Ι
Ι
Ι
Ι
|
Ι
Ι
Ι
1989
1990
S a m l — l o g a r Ι t htn I c a c a l a
1991
25000
20000
15000
12500
10000
7500
GENERAL SUMMARY
of EC trade by country
Values in Mio ECU
1000 1010 1011 1020 1021 1022 1023 1028 1030 1031 1032 1033 1038 1060 1070 1000 1051 1053 1057 1058
024
028
030
032
036
038
043
046
048
052
056
060
062
064
066
068
204
208
212
216
220
248
268
272
276
2B8
302
314
318
322
330
346
352
372
373
382
388
400
404
412
436
442
448
458
462
464
480
484
496
500
504
508
512
520
524
528
600
604
608
616
624
628
632
640
644
647
649
653
662
664
666
669
680
700
701
706
708
720
728
732
736
740
800
804
Parmer countriesW O R L D
Intra-EC (EUR 12) Extra-EC
Class 1 EFTA
Other West. Europa USA and Canada Other class 1 Ciati 2
ACP (68 countries)
DOM
TOM
Other class 2 Class 4 Class 5 Miscellaneous Mediterranean Basin OPEC ASEAN Latin America
Main countries :
Iceland Norway S w e d e n Finland Switzerland Austria Andorra Malta Yugoslavia Turkey Soviet Union Poland Czechoslovakia Hungary Romania Bulgaria Morocco Algeria Tunisia Libya Egypt Senegal Liberia Ivory Coast Ghana Nigeria Cameroon Gabon Congo Zaire Angola Kenya Tanzania Réunion Mauritius Zimbabwe South Africa (1) United States of America Canada Mexico Costa Rica Panama Cuba Guadeloupe Martinique Jamaica Colombia Venezuela French Guiana Ecuador Peru Brazil Chile Paraguay Uruguay Argentina Cyprus Lebanon Syria Iran Israel Jordan Saudi Arabia Bahrein Qatar
United Arab Emirates O m a n
Y e m e n Pakistan India Bangladesh Sri Lanka Thailand Indonesia Malaysia Singapore Philippines China South Korea Japan Taiwan Hong Kong Australia N e w Zealand
1988 930 994 540 833 387 891 238 898 90 653 10 907 76 765 60 573 116 617 17 541 1 363
740
96 973 23 487 7 486 1 869 30 196 31 851 12 203 23 047731
12 507 21 965 8 996 29 572 16 88129
390
5 892 4 346 12 990 3 361 2 211 2 158 2 234462
2 271 4 864 1 527 5 223 1 646384
679
1 615497
2 876 1 105 1 092403
1 284713
532
183
128
667
603
12 528 68 349 8 415 2 466355
400
374
133
166
208
1 322 1 15528
328
684
9 329 2 187366
884
2 624400
112
421
3 106 2 885121
5 470109
68
649
316
1 230 3 266371
349
2 966 2 134 2 687 2 993 1 209 7 005 7 240 41 618 8 067 6 317 4 881 1 546 1989 1073 5S2 824 488 446 716 270 893 102 589 13 436 93 472 61 396 137 113 19 597 1 413878
115 225 27 348 9 715 2 347 37 174 40 843 15 173 26 047779
15 365 25 408 9 918 32 029 19 09233
568
6 997 5 536 15 166 3 858 2 558 2 587 2 548531
2 674 5 848 1 980 6 304 2 441413
1 055 1 622642
3 472 1 096 1 002569
1 348538
588
207
110
718
752
8 185 83 660 9 812 2 760397
401
433
122
169
301
1 525 1 55972
326
1 040 10 446 2 752427
659
2 787524
101
775
5 352 3 197102
6 66698
121
1 553144
1 271 4 181427
419
3 362 2 553 3 507 4 023 1 325 9 149 6 953 46 337 9 259 6 432 5 271 1 602 1990 1129 055 683 797 462 720 276 380 108 597 14 648 94 591 58 545 143 948 20 125 1 588712
121 523 29 216 11 095 2 538 42 298 44 982 16 748 25 356936
16 465 25 432 10 438 34 338 20 98936
649
7 684 5 943 16 749 5 278 2 786 3 004 1 617593
3 043 6 940 2 250 7 888 2 299411
702
1 677730
4 386 1 379 1 095602
1 142 1 092520
177
125
756
577
5 929 85 182 9 409 2 947433
490
325
97
194
278
1 465 1 78475
354
803
9 203 2 617445
567
3 474581
97
1 239 5 798 3 46792
8 22490
74
1 509153
1 461 4 553501
440
4 105 2 863 3 806 4 694 1 257 10 603 8 557 46 224 9 159 5 916 4 822 1 569I m ρ 1989 I II
259 737 150 914 108 324 66 236 24 979 3 472 23 285 14 500 33 139 4 713
424
188
27 814 6 266 2 269499
8 967 9 731 3 769 5 979191
3 633 6 301 2 467 7 822 4 5656
149
1 790 1 454 3 472903
585
586
600
134
650
1 342495
1 322560
93
279
397
168
847
290
175
126
314
163
142
67
33
141
186
1 972 20 947 2 338674
98
86
115
49
46
57
388
334
8
72
214
2 330690
33
222
602
152
33
118
1 394847
25
1 76929
21
455
62
350
1 098105
98
891
652
851
829
361
2 127 1 771 10 877 2 200 1 592 1 319332
278 704 162 170 115 929 71 576 26 695 3 335 25 309 16 238 34 329 4 912369
228
28 820 7 286 2 337606
9 508 9 812 3 666 7 041194
3 971 6 753 2 608 8 247 4 9227
136
1 751 1 366 4 129 1 015649
618
696
126
678
1 638470
1 569625
110
227
437
138
782
290
255
133
364
86
159
59
33
177
180
2 191 22 600 2 708747
118
118
115
29
49
82
387
453
22
108
336
2 804765
116
111
678
142
21
221
1 058824
27
1 30724
36
274
25
•
319
1 132
109
107
845
637
839
1 010319
2 187 1 710 12 174 2 383 1 462 1 411461
III
253 178 144 712 107 785 63 717 23 808 3 133 21 441 15 335 34 464 4 782280
234
29 168 6 565 2 636682
8 919 9 834 3 834 6 895205
3 851 5 609 2 339 7 260 4 54410
139
1 645 1 268 3 578928
608
643
679
121
658
1 336467
1 671579
103
258
386
162
803
247
245
163
343
131
142
43
27
209
192
2 037 19 077 2 364694
80
90
95
23
34
71
384
390
31
57
263
2 886632
175
138
885
121
21
209
1 423756
24
1 58125
37
299
32
294
981
102
95
822
617
878
1 042341
2 505 1 829 11 614 2 434 1 798 1 285399
o r t s
GENERAL SUMMARY
of EC trade by country
Values in Mio ECU
1988 906 730 540 012 362 909 222 029 96 434 12 886 81 933 30 776 113 634 15 551 7 254 1 404 89 425 19 481 6 506 3 808 35 423 31 198 10 689 13 227
625
8 515 21 132 7 767 35 881 22 514643
843
5 714 5 225 10 114 2 756 2 169 2 355615
1 406 2 609 3 704 2 003 2 706 3 678537
453
988
412
2 166677
1 017317
725
626
811
377
1 039313
283
6 360 71 809 10 124 2 296128
390
511
837
839
165
778
2 406379
333
403
3 122851
135
215
1 311 1 053851
659
2 873 4 712 1 031 7 572437
386
2 288826
1 606 5 638403
375
2 072 1 934 1 385 4 067912
5 802 4 392 17 020 4 460 6 772 6 370 1 026286
1989 1043 289 625 722 413 010 248 718 107 968 14 947 88 675 37 128 131 197 16 627 8 307 1 683 104 580 24 209 7 216 4 557 40 699 35 031 14 110 15 109592
8 607 24 058 9 372 40 071 25 268773
1 064 7 031 5 609 12 603 3 945 2 385 2 988689
1 477 3 226 4 715 2 531 2 911 3 764641
480
1 142453
2 216758
722
345
787
819
891
421
1 150395
353
6 450 78 020 10 655 3 511166
563
587
962
896
199
865
1 667672
391
371
3 841 1 207117
252
1 161 1 438829
780
3 286 5 101905
8 805670
444
3 110742
1 460 7 083445
391
2 765 2 039 2 049 5 486 1 197 6 369 5 207 21 130 5 206 7 023 8 259 1 289394
1990 1081 428 856 872 419 813 250 920 111 370 18 773 85 859 34 917 134 425 16 649 8 532 1 679 107 564 23 308 6 108 4 742 45 633 35 439 16 083 15 067638
9 306 23 941 9 165 41 340 26 981874
1 210 8 521 7 722 13 614 4 934 2 909 3 220 1 415 1 034 3 562 4 976 2 971 2 660 4 153684
1 008832
501
2 501736
545
350
732
843
797
401
1 176391
336
4 090 76 561 9 298 3 881166
564
665
1 061988
172
812
1 692910
328
334
3 653 1 170175
233
1 238 1 280756
845
5 021 5 240830
7 756456
455
3 567694
1 428 6 019402
347
3 429 2 841 2 497 5 689 1 247 5 318 6 061 22 721 4 917 6 602 6 817 1 288408
I
249 477 152 159 96 363 58 000 25 774 2 989 20 646 8 592 30 775 4 048 2 014390
24 323 5 203 2 018955
9 078 8 160 3 095 3 466147
2 013 5 869 2 257 9 523 5 964162
228
1 436 1 057 2 785842
480
629
123
333
736
1 024565
606
917
177
175
313
106
491
181
151
103
174
166
182
104
258
83
74
1 611 18 104 2 542715
41
133
147
211
214
46
190
510
178
80
74
847
231
30
62
324
375
234
151
775
1 257325
2 145122
99
732
160
382
1 632114
88
564
406
401
1 221272
1 807 1 217 4 798 1 120 1 702 1 924260
SO
1989II
268 878 162 962 104 766 63 705 27 537 4 005 22 675 9 489 32 717 4 088 2 078405
26 146 6 091 1 710 1 151 10 352 8 548 3 410 3 649142
2 173 6 089 2 403 10 331 6 399195
277
1 908 1 478 3 110 1 038566
772
184
370
852
1 057672
736
905
165
111
311
125
556
184
158
76
225
190
198
117
297
102
90
1 658 19 930 2 745848
37
139
163
235
231
51
228
387
126
108
82
890
288
25
65
324
408
127
186
796
1 316206
2 046183
113
848
190
397
1 860102
123
753
524
469
1 332278
1 483 1 333 5 306 1 335 1 951 2 242283
100
E x p o
III
246 158 144 741 100 162 60 387 25 510