ORIGINAL ARTICLE
Validation of the DECAF score to predict hospital
mortality in acute exacerbations of COPD
C Echevarria,
1,2J Steer,
1K Heslop-Marshall,
2,3SC Stenton,
3PM Hickey,
4R Hughes,
4M Wijesinghe,
5RN Harrison,
6N Steen,
7AJ Simpson,
2GJ Gibson,
2SC Bourke
1,2▸ Additional material is published online only. To view, please visit the journal online (http://dx.doi.org/10.1136/ thoraxjnl-2015-207775).
For numbered affiliations see end of article.
Correspondence to
Dr SC Bourke, Department of Respiratory Medicine, North Tyneside General Hospital, Rake Lane, North Shields, Tyne and Wear NE29 8NH, UK; Stephen.Bourke@nhct.nhs.uk
Received 1 September 2015 Revised 19 October 2015 Accepted 10 November 2015
To cite:Echevarria C, Steer J, Heslop-Marshall K, et al.Thorax2016;71:133– 140.
ABSTRACT
Background Hospitalisation due to acute exacerbations of COPD (AECOPD) is common, and subsequent mortality high. The DECAF score was derived for accurate prediction of mortality and risk stratification to inform patient care. We aimed to validate the DECAF score, internally and externally, and to compare its performance to other predictive tools.
Methods The study took place in the two hospitals within the derivation study (internal validation) and in four additional hospitals (external validation) between January 2012 and May 2014. Consecutive admissions were identified by screening admissions and searching coding records. Admission clinical data, including DECAF indices, and mortality were recorded. The prognostic value of DECAF and other scores were assessed by the area under the receiver operator characteristic (AUROC) curve.
Results In the internal and external validation cohorts, 880 and 845 patients were recruited. Mean age was 73.1 (SD 10.3) years, 54.3% were female, and mean (SD) FEV145.5 (18.3) per cent predicted. Overall mortality was 7.7%. The DECAF AUROC curve for inhospital mortality was 0.83 (95% CI 0.78 to 0.87) in the internal cohort and 0.82 (95% CI 0.77 to 0.87) in the external cohort, and was superior to other prognostic scores for inhospital or 30-day mortality.
Conclusions DECAF is a robust predictor of mortality, using indices routinely available on admission. Its generalisability is supported by consistent strong performance; it can identify low-risk patients (DECAF 0–1) potentially suitable for Hospital at Home or early supported discharge services, and high-risk patients (DECAF 3–6) for escalation planning or appropriate early palliation.
Trial registration number UKCRN ID 14214.
INTRODUCTION
Acute exacerbations of COPD (AECOPD) account
for one in eight hospital admissions,1and are
asso-ciated with worsening symptoms, lung function,
health-related quality of life, and mortality risk.2–6
Inhospital mortality is reported to be between
4.4% and 7.7%.7–10 Clinicians are unable
accur-ately to predict prognosis in patients hospitalised
with AECOPD.11 A robust prediction tool, which
stratifies patients according to mortality risk, may
help inform management, including Hospital at Home (HAH) or early supported discharge (ESD) for low-risk groups, and early escalation or appro-priate palliation for high-risk groups.
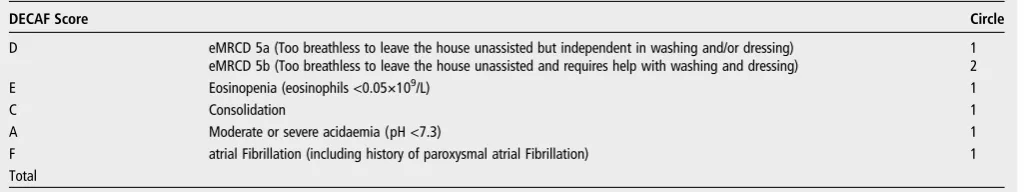
The Dyspnoea, Eosinopenia, Consolidation,
Acidaemia, and atrial Fibrillation (DECAF) score was derived in a large cohort of consecutive patients hospitalised with AECOPD, is simple to apply at the bedside and predicts inhospital
mortal-ity using indices routinely available on admission.12
The score comprises five predictors, the strongest
of which is stable state dyspnoea, as measured by the extended Medical Research Council Dyspnoea
score (eMRCD;table 1).13
In the derivation study (the original study, in which the DECAF score was developed), DECAF showed strong performance and was superior to other tools designed or proposed for patients with
AECOPD,12 namely APACHE II,14 BAP-65,15
CAPS16and CURB-65.17
The 2014 UK National COPD audit recom-mended that the DECAF score be documented on all patients admitted with an AECOPD but noted
that validation was required,7 which is essential
to prove the generalisability of a prognostic
score.18 We present temporal and geographical
validation of the DECAF score and re-examine its predictive performance for short and medium term mortality in a large multicentre cohort of patients hospitalised with AECOPD. Two cohorts are presented: the internal validation cohort assesses performance of DECAF in both hospitals from the original derivation study, but over a dif-ferent time period; the external validation study Open Access
Scan to access more free content
Key messages
What is the key question?
▸ Does the DECAF score predict inhospital mortality in patients admitted to hospital with an acute exacerbation of COPD?
What is the bottom line?
▸ In both internal and external validation cohorts, DECAF is a robust predictor of inhospital mortality using indices that are routinely available at the time of admission, and can be easily applied at the bedside.
Why read on?
assesses the performance and generalisability of DECAF in four hospitals from different geographical areas. Since the
DECAF score could identify low-risk patients (DECAF 0–1)
who might benefit from HAH or ESD schemes, we report a
detailed analysis of this subgroup.
METHODS
Study design and participation
Six UK hospitals participated between January 2012 and May 2014. Sites A and B formed the internal validation cohort
and sites C–F formed the external validation cohort (table 2).
The latter were selected to ensure wide variation in structures of care and population characteristics (COPD prevalence, socioeconomic factors and rurality). In participating hospitals,
consecutive patients admitted with AECOPD were identified.
In the internal validation cohort hospitals, the DECAF indices are recorded as part of routine practice. This allowed the period of the study to be extended retrospectively to enhance
recruitment; patients were primarily identified from a broad
coding records search (discharge codes). However this was
cross-referenced with existing records of patients identified by
respiratory specialist nursing and physiotherapy teams. In the external validation cohort to identify consecutive admissions of patients with AECOPD, all medical admissions were screened prospectively. This involved dedicated staff attending the medical admissions unit and base wards. Coding records were also reviewed to maximise patient capture.
Inclusion criteria were: a primary diagnosis of pneumonic or non-pneumonic exacerbation of COPD; preadmission spirometric
evidence of airflow obstruction; age ≥35 years and smoking
history of≥10 cigarette pack-years. Exclusion criteria were:
previ-ous inclusion in the present study and any illness, other than COPD, likely to limit survival to less than 1 year (principally
metastatic malignancy). Spirometry showing airflow obstruction
performed at any time point prior to admission was accepted, and both primary and secondary care records were searched.
Treatment was at the discretion of attending clinicians, and not
influenced by the research team. Antibiotic therapy was informed
by the prescribing policy of individual sites. Ethical approval was granted by the local research ethics committee.
Data collection
Clinical indices on admission, and demographic and survival
data were collected.12 In our derivation study,12 118 patients
had oxygen saturation (SpO2) >92% while breathing room air,
of whom none had an arterial pH of <7.30 (DECAF acidaemia score=1). In the present study, therefore, if the attending phys-ician deemed that arterial blood gas (ABG) sampling was
unnecessary and SpO2 was >92% without supplementary
oxygen, it was presumed that the arterial pH was≥7.30.19
Outcome
[image:2.595.44.557.315.411.2]The primary outcome was inhospital mortality prediction, with comparison of DECAF risk groups between the derivation and validation cohorts. Secondary outcomes included assessment of Table 1 eMRCD score, guidance note for eMRCD and DECAF score
eMRCD score
‘In the past 3 months, when you were feeling at your best, which of the following statements best describes your level of
breathlessness?’ (Circle)
Only breathless on strenuous exertion 1
Breathless hurrying on the level or walking up a slight hill 2
Walks slower than contemporaries, or stops after walking on the level for 15 min 3
Stops for breath after walking 100 m, or for a few minutes, on the level 4
Too breathless to leave the house unassisted but independent in washing and/or dressing 5a Too breathless to leave the house unassisted and requires help with washing and dressing 5b
Guidance notes:
Remember that you are asking the patient about their level of breathlessnesson a good day over the preceding 3 months, not breathlessness during an exacerbation/on admission.
A patient only achieves a higher grade if they are as breathless as defined in that higher grade.
▸ eg, if worse than defined in eMRCD 3, but not as bad as eMRCD 4, they remain eMRCD 3. A key distinction is between eMRCD 4 and eMRCD 5a/5b:
▸ only score 5a or 5b if the patient cannot leave the house without assistance.
▸ if a patient can only walk 30 to 40 metres, but can leave the house unassisted, they are eMRCD 4.
▸ if a patient can walk 5 or 10 metres, perhaps from their front door to a car, but need a wheelchair otherwise, they require assistance: eMRCD 5a or 5b. Simple walking aids do not constitute assistance.
If a patient requires assistance in personal washing and dressing they are eMRCD 5b. If they only require assistance in washingordressing they are eMRCD 5a. Remember to ask about putting on socks and shoes.
If patients are limited for a reason other than breathlessness, score based on their functional limitation.
DECAF Score Circle
D eMRCD 5a (Too breathless to leave the house unassisted but independent in washing and/or dressing) eMRCD 5b (Too breathless to leave the house unassisted and requires help with washing and dressing)
1 2
E Eosinopenia (eosinophils <0.05×10⁹/L) 1
C Consolidation 1
A Moderate or severe acidaemia (pH <7.3) 1
F atrial Fibrillation (including history of paroxysmal atrial Fibrillation) 1
Total
eMRCD, extended Medical Research Council dyspnoea score.
134 Echevarria C,et al.Thorax2016;71:133–140. doi:10.1136/thoraxjnl-2015-207775
Chronic obstructive pulmonary disease
group.bmj.com on June 29, 2016 - Published by
Internal validation n=880 External validation n=845
Site A n=459
Site B n=421
Site C n=307
Site D n=271
Site E n=171
Site F n=96
All sites
N=1725 p Value
Recruitment period Jan 12-May 13 Jan 12-May 13 Aug 13- May 14 Jul 13-Apr 14 Apr 13-Feb 14 Feb 14-Apr 14 Jan 12-May 14 N/A
Recruitment/day 0.89 0.82 1.07 0.89 0.58 1.12 0.86 N/A
Died inhospital, % 9.8 7.8 7.5 6.6 4.7 5.2 7.7 0.27
DECAF 0–1, % 44.4 46.6 47.6 34.3 44.4 61.5 44.9 0.00018
DECAF 2, % 30.9 26.6 29.6 28.0 32.7 21.9 28.9 0.33
DECAF 3–6, % 24.6 26.8 22.8 37.6 22.8 16.7 26.3 0.00013
Sociodemographics
Age, years* 73.5 (9.9) 73.9 (10.3) 73.5 (10.4) 72.0 (9.8) 72.4 (10.7) 70.7 (11.4) 73.1 (10.3) 0.025
Female, % 56.4 58.0 56.4 40.6 58.5 53.1 54.3 0.00012
Smoking pack-years, n† 41 (30–58) 40 (30–55) 44 (30–60) 40 (30–56) 45 (30–60) 40 (30–59) 40 (30–59) 0.71
Current smoking, % 38.2 40.9 39.7 36.2 36.1 47.4 39.1 0.41
Institutional care, % 8.9 5.0 2.9 2.6 4.1 5.2 5.2 0.0018
Markers of disease severity
eMRCD score 1–4, % 44.7 49.2 49.5 35.1 44.4 68.8 46.4 <0.0001
eMRCD score 5a, % 39.7 36.6 30.3 24.7 42.1 24.0 34.3 <0.0001
eMRCD score 5b, % 15.7 14.3 20.2 40.2 13.5 7.3 19.3 <0.0001
Hospital admissions in previous year, n† 0 (0–1) 0 (0–1) 1 (0–1) 1 (0–2) 1 (0–2) 1.5 (0–3) 0 (0–1) <0.0001 FEV1% predicted* 47.8 (19.4) 48.5 (18.5) 44.8 (18.2) 40.6 (14.9) 40.5 (15.4) 46.6 (20.4) 45.5 (18.3) <0.0001
LTOT, % 15.7 16.2 13.4 17.7 26.8 17.7 16.9 0.014
Cor pulmonale, % 5.9 7.4 10.4 8.5 8.9 2.1 7.5 0.052
LT prednisolone, % 8.1 6.7 5.5 10.0 9.0 7.3 7.6 0.38
Comorbidity
IHD, % 27.5 32.3 31.9 27.7 26.6 27.1 29.4 0.46
CVD, % 13.3 12.4 13.1 13.7 5.9 11.5 12.3 0.14
Diabetes, % 11.3 11.9 15.0 13.0 14.8 17.7 13.1 0.40
Atrial fibrillation, % 14.8 20.7 16.9 17.7 16.4 14.6 17.2 0.33
LVD, % 8.1 9.3 18.2 10.0 4.7 3.2 9.9 <0.0001
Cognitive impairment, % 5.0 5.0 6.8 8.5 3.6 1.0 5.5 0.049
Anxiety, % 13.9 13.3 37.6 20.3 7.1 9.4 18.1 <0.0001
Depression, % 23.3 18.3 33.6 25.5 19.4 9.4 23.1 <0.0001
Admission clinical data
Acute confusion, % 12.9 12.9 8.7 8.9 6.6 6.3 10.6 0.060
Respiratory rate, n* 26.5 (6.8) 25.7 (6.0) 21.8 (4.5) 24.1 (6.2) 23.9 (6.2) 23.5 (6.3) 24.7 (6.3) <0.0001 Pulse rate, n* 104.9 (21.0) 102.8 (22.8) 97.1 (18.3) 102.2 (20.5) 104.7 (21.6) 99.7 (18.4) 102.3 (21.0) <0.0001 sBP, mm Hg* 136.5 (30.3) 145.2 (26.6) 130.8 (22.0) 135.0 (26.5) 134.5 (22.9) 133.6 (24.2) 137.1 (26.9) <0.0001 dBP, mm Hg* 74.6 (17.0) 80.0 (19.0) 71.6 (15.8) 77.2 (18.5) 77.3 (19.6) 73.2 (13.7) 76.0 (17.9) <0.0001 Temperature, °C† 36.9 (36.3–37.6) 36.5 (36.0–37.2) 36.8 (36.4–37.3) 36.5 (36.0–37.1) 36.5 (35.9–37.0) 36.7 (36.0–37.0) 36.7 (36.2–37.3) <0.0001 Oxygen saturation† 92 (87–94) 93 (88–95) 94 (91–95) 93 (90–95) 93 (90–95) 92 (91–95) 93 (89–95) <0.0001
Pedal oedema, % 25.8 21.6 26.8 27.0 32.7 5.3 24.9 <0.0001
BMI, kg/m2* 25.1 (6.8) 24.9 (6.8) 24.5 (6.4) 25.4 (6.4) 24.1 (6.5) N/A 24.9 (6.6) 0.28
C,
et
al
.
Thor
ax
2016;
71
:133
–
140.
doi:10.1136
/thor
axjnl-20
15-207775
135
Chr
o
nic
obs
tructiv
e
pulmonary
d
isease
group.bmj.com
on June 29, 2016 - Published by
http://thorax.bmj.com/
[image:3.595.50.756.66.546.2]the optimal thresholds for pH and eosinopenia, prediction of 30-day mortality by DECAF and comparison with other
prognos-tic scores (APACHE II,14 BAP-65,15 CAPS16 and CURB-6517).
Length of stay (LOS) was compared across DECAF scores.
Statistical methods
Based on an expected sensitivity of 70%, an SE of the estimate of sensitivity of 5% required a minimum of 840 patients in both
the internal and external validation cohorts.20 For indices with
<20% missing values, data were imputed using the Markov Chain Monte Carlo method on IBM SPSS Statistics 22, with linear and logistic regression for continuous and categorical
vari-ables.21A large number of variables (n=67) were used as
pre-dictors for variables with missing data to createfive datasets.
Baseline population characteristics and outcome were
described using proportions, means with SDs or medians with
IQRs, and compared using Fisher’s exact test, analysis of
vari-ance or Welch, and Kruskal–Wallis test. Clinical scores’
perform-ance was assessed by the area under the receiver operator characteristic (AUROC) curve and compared with each other by
the method of DeLong with and without multiple imputation;22
results were pooled using Rubin’s method.21Logistic regression
was used to model DECAF indices to provide ORs, 95% CIs
and coefficients to assess the weighting of indices. Calibration
was assessed with the Hosmer–Lemeshow statistic.23 The
optimal thresholds for pH and eosinophil count were reassessed by visual inspection of the ROC curve. Subgroup analyses assessed outcome in patients at low risk according to DECAF, with (a) coexisting consolidation or (b) acidaemia.
RESULTS
Patient characteristics
Data were obtained for 880 and 845 patients in the internal and external validation cohorts, respectively. Across both cohorts, mean (SD) age was 73.1 (10.3) years, 54.3% were female and
most had severe airflow limitation; mean (SD) FEV145.5 (18.3)
per cent predicted. The median DECAF score was 2 (IQR 1–3),
28.3% had radiographic consolidation and 18.9% had an acid-aemic exacerbation ( pH<7.35). In keeping with the UK
national audit,7rates of comorbidity were high, notably
ischae-mic heart disease and diabetes (table 2).
Significant differences between sites included: the proportion
requiring institutional care, radiographic consolidation, age,
gender, DECAF score, severity of airflow limitation, the number
of previous hospital admissions and the proportion with signifi
-cant weight loss. Sites were broadly similar for comorbidity, though the proportions with left ventricular dysfunction, anxiety
or depression differed. All of these factors were also significantly
different between internal and external validation cohorts, except for DECAF score and left ventricular dysfunction.
Missing data
There were no missing mortality or DECAF data. The percent-age of complete data for each risk score was: BAP-65 97.2%, CURB-65 96.5%, CAPS 85.9% and APACHE II 73.2%. For
individual variables, missing data were PaO2 12.6%, albumin
12.2%, pH 12.1%, GCS 11.7%, potassium 3.3%, confusion 2.6%, temperature 2.6%, mean arterial blood pressure 1.8%, respiratory rate 1.8%, systolic BP 1.7%, diastolic BP 1.7%, heart rate 1.4%, haematocrit 1.2%, creatinine 0.5%, white blood cell count 0.2%, urea 0.1% and sodium 0.1%.
Table 2 C onti nued Internal valida tion n=880 External valida tion n=845 Site A n=459 Site B n=421 Site C n=307 Site D n=271 Site E n=171 Site F n=96 All sites N=1725 p V alue W eight loss >5%, % 14.2 10.6 21.2 24.7 12.9 2.4 15.3 <0.0001 CXR consolida tion, % 30.5 34.4 22.8 30.6 18.7 19.8 28.3 <0.0001 Arterial blood gas values pH † 7.42 (7.37 – 7.46) 7.42 (7.37 – 7.46) 7.43 (7.38 – 7.46) 7.40 (7.35 – 7.44) 7.45 (7.38 – 7.48) 7.39 (7.35 – 7.43) 7.42 (7.37 – 7.46) <0.0001 Pa O2 ,k Pa † 8.0 (6.9 – 9.3) 8.0 (6.9 – 9.3) 8.6 (7.7 – 9.8) 8.4 (7.3 – 10) 9.4 (7.8 – 9.4) 8.3 (7.5 – 9.4) 8.3 (7.2 – 9.7) <0.0001 Pa C O2 ,k Pa † 5.6 (4.8 – 7.1) 5.7 (4.8 – 7.3) 5.2 (4.4 – 6.2) 6.1 (5.3 – 7.5) 5.6 (4.8 – 7.6) 6.1 (5.1 – 7.1) 5.7 (4.8 – 7.1) <0.0001 HC O3 , mmol/L* 28.1 (6.0) 28.7 (6.8) 26.5 (5.5) 28.7 (5.4) 30.2 (8.9) 27.8 (5.0) 28.3 (6.4) <0.0001 pH <7.35, % 17.8 19.2 15.1 24.3 17.9 20.8 18.9 0.19 Sites compar ed by Fisher ’ s (pr oportions), ANO VA or W elch (means), or Kruskal – W allis (median) tes ts. *Mean (SD). † Median (IQR). BMI, body mass inde x; CVD, cer ebr ovascular disease; CXR, ches t radiogr aph; dBP and sBP , dias tolic and sy stolic blood pr essur e; HC O3 , bicarbona te; IHD, ischaemic heart disease; LT , long term; LT O T, long-term oxygen ther apy; LVD, left ventricular dy sfunction.
136 Echevarria C,et al.Thorax2016;71:133–140. doi:10.1136/thoraxjnl-2015-207775
Chronic obstructive pulmonary disease
group.bmj.com on June 29, 2016 - Published by
Validation of the DECAF score
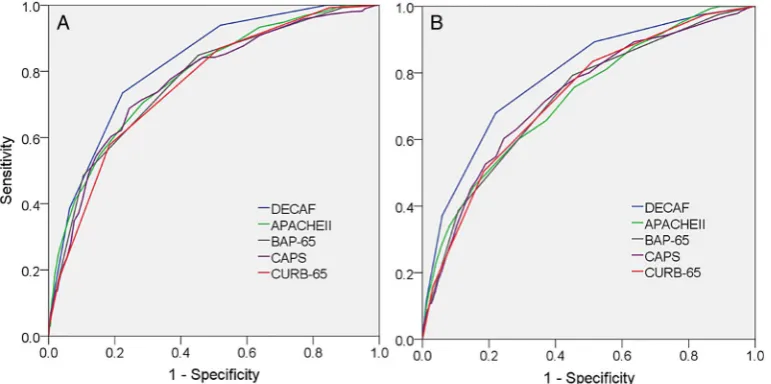
The AUROCDECAFcurve for inhospital mortality was: internal
validation=0.83 (95% CI 0.78 to 0.87), external valid-ation=0.82 (95% CI 0.77 to 0.87) and overall=0.82 (95% CI 0.79 to 0.85). The discrimination of the DECAF score was
sig-nificantly stronger than CURB-65, CAPS, APACHE II and
BAP-65 for 30-day mortality. For inhospital mortality, the DECAF score was again superior, except in comparison with APACHE II where the higher discriminatory strength of DECAF
was not significant (table 3andfigure 1).
In a complete case analysis (without imputation), the conclu-sions were unchanged for 30-day mortality; for inhospital
mor-tality, AUROCDECAFcurve was again the highest, but was not
statistically superior to CAPS ( p=0.068) or BAP-65 ( p=0.060).
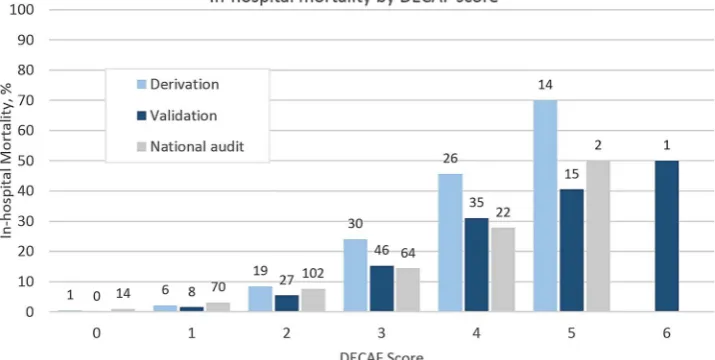
Table 4 shows mortality rates, sensitivity and specificity by DECAF score in the overall validation cohort, and mortality by
DECAF risk group compared with our derivation cohort.12
Compared with the derivation study, mortality overall and in the high-risk group was lower. Higher DECAF scores were again associated with higher mortality, though absolute numbers were
small for DECAF 5 and 6 groups. The model was a satisfactoryfit
to the data (Hosmer–Lemeshow statistic=0.48, Nagelkerke
R2=24%). The previously assigned weightings of the DECAF
score were confirmed on logistic regression (see online
supplemen-tary table S1), and eMRCD score remained the strongest predictor.
Compared with the traditional MRCD scale,24 eMRCD had
superior prognostic strength for inhospital mortality:
AUROCeMRCD=0.74 (95% CI 0.70 to 0.78) versus
AUROCtraditional MRCD=0.68 (95% CI 0.64 to 0.72);
p<0.0001. In the subpopulation with a pneumonic exacerbation (n=485), eMRCD was again superior to the MRCD scale:
AUROCeMRCD=0.67 (95% CI 0.60 to 0.73) versus
AUROCMRCD=0.62 (95% CI 0.56 to 0.69); p=0.0070.
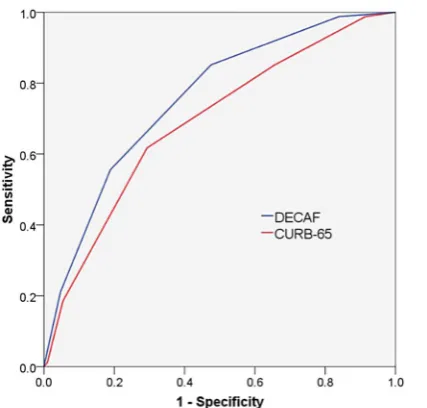
CURB-65 predicts 30-day mortality in patients with com-munity acquired pneumonia, and is commonly applied to
patients with a pneumonic exacerbation of COPD
( pAECOPD). In the validation cohort, for the subgroup of patients with pAECOPD (n=489), the DECAF score was a
non-significantly stronger predictor of 30-day mortality than
CURB-65: AUROCDECAF=0.76 (95% CI 0.70 to 0.81) versus
AUROCCURB-65=0.68 (95% CI 0.62 to 0.74); p=0.057
(figure 2; online supplementary table S2 shows sensitivity and
specificity for DECAF scores).
When patients with pAECOPD were pooled across the deriv-ation and validderiv-ation cohort (n=788), DECAF was superior for
30-day (AUROCDECAF=0.75 (95% CI 0.71 to 0.79) vs
AUROCCURB-65=0.66 (95% CI 0.62 to 0.71); p<0.0001) and
inpatient mortality (AUROCDECAF=0.76 (95% CI 0.71 to 0.80)
vs AUROCCURB-65=0.70 (95% CI 0.65 to 0.75); p=0.024).
The superior performance of DECAF is of particular import-ance for patients deemed at low risk by each score, who may be considered suitable for home treatment. Patients with a low-risk DECAF score had a lower inhospital mortality compared with those with a low-risk CURB-65 score: DECAF=1.6% (2/122) versus CURB-65=7.2% (17/237); p=0.026. There were similar
differences for 30-day mortality: DECAF 0–1=3.3% (4/122)
versus CURB-65 0–1=10.1% (24/237); p=0.022 (see online
[image:5.595.46.553.64.144.2]supplementary table S3). Table 3 Comparison of AUROC curves for DECAF and other scores (with imputation)
Prognostic score
AUROC curve (95% CI)
Inhospital death Comparison with DECAF, p value
AUROC curve (95% CI)
30-day death Comparison with DECAF, p value
DECAF 0.82 (0.79 to 0.85) N/A 0.79 (0.75 to 0.83) N/A
CURB-65 0.76 (0.72 to 0.80) 0.0057 0.73 (0.69 to 0.77) 0.0051
CAPS 0.77 (0.73 to 0.81) 0.038 0.73 (0.69 to 0.77) 0.0083
APACHE II 0.78 (0.74 to 0.82) 0.083 0.72 (0.68 to 0.77) 0.0039
BAP-65 0.77 (0.73 to 0.81) 0.038 0.72 (0.68 to 0.76) 0.0021
AUROC curves of each prognostic score compared with DECAF by method of DeLong.22
[image:5.595.106.492.536.728.2]AUROC, area under the receiver operator characteristic.
The optimal thresholds for eosinophil count and pH were reassessed. On visual inspection of the ROC curve, the optimal
cut-off for eosinopenia was unchanged (0.05×10⁹/L).12For pH
threshold, both 7.30 and 7.35 offered similar discrimination.
The 7.30 threshold identified in the derivation study was
retained for consistency, and because no deaths occurred among 58 patients with a low-risk DECAF score and non-scoring acid-aemia (7.30-7.34). Only three patients had a DECAF score of 1 due to a pH<7.30, all of whom survived.
Patients with SpO2 >92% without supplemental oxygen in
whom ABG sampling was deemed unnecessary were assigned a score of 0 for the pH component of DECAF. Of the 209 such patients overall, only 6 died (2.9%); this total included 0/52 with a DECAF score of 0 and 2/67 with a DECAF score of 1.
Time to death in those who died during the index admission and LOS in those who survived to discharge, by DECAF score,
are shown in table 5. Among survivors, higher DECAF scores
were associated with longer LOS.
DISCUSSION
In a large, multicentre study of patients admitted with
AECOPD, we have confirmed that the DECAF score is a robust
predictor of mortality that can be easily scored at the bedside using indices routinely available on admission. As in our earlier study, DECAF was superior to other scores (BAP-65, CAPS,
APACHE II, CURB-65) sometimes used to predict short-term mortality of patients with AECOPD.
We went to considerable lengths to capture consecutive patients, but a small number of patients who died or who were discharged shortly after admission may have been missed. In order to minimise any resulting bias and to maximise capture of all eligible patients, admission units were screened and a broad coding records search was performed. In the 2014 UK national
audit,7mean site recruitment of patients with spirometric
con-firmation of COPD was 0.36 per day. In our study, recruitment
was substantially higher at all sites (table 2), which supports
high case ascertainment rates. Investigators in site E reported problems obtaining spirometry results, which may in part explain their comparatively lower recruitment rate.
The CHARMS checklist provides guidance on the appraisal of
prediction model studies (see online supplementary material).18
The main limitation of this study is that the internal validation study was, in part, performed retrospectively. Although retro-spective collection of data may bias results, this risk was miti-gated as the DECAF indices were collected as part of routine clinical practice in the participating hospitals, the researchers extracting data were blinded to outcome and case ascertainment and outcome were similar to the prospective external cohort. Of importance, the latter was individually adequately powered.
Data were only regarded as‘missing’once all data sources had
been checked and rates of missing data were low. For key out-comes, analyses were repeated with and without multiple imput-ation. To improve data completeness for DECAF, patients with
SaO2>92% breathing room air, and judged by a clinician not to
require ABG analysis, scored 0 for the acidaemia component of
DECAF; this was justified by the low mortality in this group, and
[image:6.595.46.551.64.185.2]supports a similar pragmatic approach in the clinical application of the score, reducing burden for both patients and clinicians. Table 4 DECAF score, inhospital mortality, sensitivity and specificity
Mortality by risk group*, % p Value
DECAF score n Died inhospital, n (%) Sensitivity Specificity Validation Derivation
0 255 0 (0) 1.00 0
1.0 1.4 0.60
1 519 8 (1.5) 1.00 0.16
2 498 27 (5.4) 0.94 0.48 5.4 8.4 0.14
3 301 46 (15.3) 0.73 0.78
21.4 34.7 0.00046
4 113 35 (31.0) 0.39 0.94
5 37 15 (40.5) 0.12 0.99
6 2 1 (50.0) 0.0076 1.00
Total 1725 132 (7.7) N/A N/A 7.7 10.4 0.016
*Risk groups: low=DECAF 0–1; intermediate=DECAF 2; high=DECAF 3–6.
[image:6.595.64.278.517.721.2]Proportions of patients who died by risk group for validation and derivation cohort compared with Fisher’s exact test.
Table 5 Time to death in patients who died during the index admission and median length of stay in those who survived to discharge, by DECAF score
DECAF score
Median time to death, days (IQR)
Median length of stay, days (IQR)
0 N/A 3 (1–5)
1 4.5 (4–12.5) 4 (2–7)
2 9 (5–16) 5 (3–10)
3 10 (3.75–23.25) 7 (3–13)
4 5 (1–11) 7.5 (5–18)
5 2 (1–9) 10 (6–19.5)
6 2 (2–2) 22 (22–22)
Figure 2 Receiver operator characteristic curves of prognostic scores for 30-day mortality in patients with pneumonic exacerbations (n=489).
138 Echevarria C,et al.Thorax2016;71:133–140. doi:10.1136/thoraxjnl-2015-207775
Chronic obstructive pulmonary disease
group.bmj.com on June 29, 2016 - Published by
[image:6.595.309.552.642.748.2]However, we do not advise that this assumption is used to lower
clinician’s threshold for performing ABG sampling.
There were important differences between site populations, in particular the receipt of institutional care, coexistent consolidation,
degree of airflow obstruction and severity of DECAF score.This
may in part reflect our efforts to select diverse sites for participation
in the study, and the strong and consistent performance of DECAF, despite such differences in baseline characteristics, emphasises the external validity of the score.
Mortality varied between sites (from 4.7% to 9.8%) and between cohorts (internal validation=8.9% vs external
valid-ation=6.4%; p=0.057). This largely reflects differences in
base-line characteristics, notably the proportion of patients admitted from institutional care and with coexistent pneumonia. When these two subgroups were excluded, mortality was 4.8% in both cohorts. Overall mortality was 7.7%, which is in keeping with the 2003 (7.7%) and 2008 (7.8%) UK national audits. In the 2014 UK audit, mortality was 4.3% though the reason for the lower mortality rate is reported as unknown. In our study, case ascertainment, comorbidity and the proportion of patients with consolidation or an MRCD score of 5 was higher than in the 2014 UK national audit.
Since our 2012 DECAF derivation study, two further
prog-nostic scores have been published.25 26In one,25 patients with
acute ECG features of ischaemia and radiographic pulmonary congestion were included. Such patients are unlikely to have met our inclusion criterion of a primary diagnosis of AECOPD.
In the second study, the derived score showed good
discrimin-ation, and validation is awaited.26 However, the score included
subjective recognition of‘use of inspiratory accessory muscles or
paradoxical breathing’, reducing generalisability, especially in
healthcare settings which lack specialist review within 24 h of
admission.7 27 Recruitment was lower than equivalent audit
data,27because written patient consent was required, which
dis-proportionately excludes the lowest and highest risk patients. Our methodology mirrored UK national audits; only routine data were collected, so patient consent was not required.
LOS for AECOPD is falling, and early discharge, both supported and unsupported, is commonplace, with patient selection based largely on clinical judgement. However, clinical judgement of
prog-nosis is poor11while the DECAF score has consistently shown a
high sensitivity for identifying low-risk patients. ESD and HAH
services for patients with AECOPD are expanding.7 National
Institute for Health and Care Excellence (NICE) recommend that
patient selection for these services be based on mortality risk,28
and also highlight the ( previous) lack of a robust prognostic score to guide decision-making. In the present study, DECAF
0–1 patients (including those with pneumonia or acidaemia)
had an acceptably low mortality risk and comprised 45% of patients. The effect of treating this group with HAH or ESD requires a randomised controlled trial (RCT) to assess clinical outcomes and associated costs. We are currently undertaking an RCT to address this question (ISRCTN 29082260). In our experience, the CURB-65 score is commonly applied in patients with pneumonic exacerbations of COPD to inform discharge planning and choice of antibiotics. Evidence from both the der-ivation and validation studies shows that clinicians should not
be reassured by ‘low risk’ CURB-65 scores in patients with
pneumonic AECOPD as the associated mortality is unaccept-ably high. We advise against its use in this population.
A high-risk DECAF score is associated with both a high risk of death and, in those who die, a short time to death. The latter is particularly true of patients scoring DECAF 5 or 6, in whom the median time to death was only 2 days. Such patients may be suit-able for early escalation in care, or alternative palliative care, but the window for intervention is short. Among patients who survive to discharge, LOS increases incrementally with DECAF score.
In both the derivation and present study, dyspnoea severity measured by the eMRCD score was the strongest single pre-dictor of mortality and a superior prepre-dictor to the traditional
MRCD scale. In the 2014 UK national audit,‘DECAF light’was
scored retrospectively using the traditional MRCD scale (see figure 3). However, ‘DECAF light’, as opposed to the full DECAF score, was calculated only because eMRCD data was unavailable. We support the recommendation of the UK national audit that DECAF indices, including the eMRCD score, be col-lected on all patients admitted with AECOPD. To allow
hospi-tals to meet this recommendation, we have included afigure of
the DECAF score which can be downloaded and incorporated into COPD bundles and admission documentation (online
sup-plementaryfigure 1). Various versions of the traditional MRCD
scale exist,24 29 30which may lead to differences in scoring. We
caution against such modifications to the eMRCD score unless
[image:7.595.119.477.55.235.2]supported by empirical evidence.
In conclusion, we have shown that DECAF can be used in a variety of hospital settings in order accurately to stratify mortal-ity risk in patients with AECOPD. Further research is required to quantify its impact on clinical practice, for example, in the
identification of patients for HAH or ESD services.
Author affiliations
1Department of Respiratory Medicine, North Tyneside General Hospital, North
Shields, UK
2Institute of Cellular Medicine, Newcastle University, Newcastle Upon Tyne, UK 3
Chest Clinic, Royal Victoria Infirmary, Newcastle Upon Tyne, UK
4Department of Respiratory Medicine, Northern General Hospital, Sheffield, South
Yorkshire, UK
5Department of Respiratory Medicine, Royal Cornwall Hospital, Truro, Cornwall, UK 6
Department of Respiratory Medicine, University Hospital of North Tees, Hardwick Hall, Stockton-on-Tees, Cleveland, UK
7
Institute of Health and Society, Baddiley-Clark Building, Newcastle University, Newcastle Upon Tyne, UK
Acknowledgements We are grateful to Victoria Ferguson for her input with data management. We are thankful for the hard work of the research and clinical teams collecting data at each site, including Stephen Gundry, Maureen Armstrong, Peter Fenwick, Liz Norman and her team, Nicola Bateman, June Battram, Angela Scott-Johnson and Valerie O’Dwyer.
Contributors SCB designed and obtained funding for the study. CE, GJG and JS contributed to trial design. CE collated the data, performed the statistical analysis and drafted the manuscript. Data analysis and interpretation was supported by SCB, GJG, JS and NS. The manuscript was redrafted by SCB, GJG, JS, AJS and CE. All authors reviewed the manuscript.
Funding This trial was funded by UK Department of Health, Breathe North appeal and Novartis pharmaceutical UK Limited (reference RES12-CO44) and supported by the NIHR Clinical Research Network. CE’s salary was funded by the Northumbria NHS Foundation Trust Teaching and Research Fellowship programme.
Competing interests None declared.
Ethics approval NRES Committee North East—Sunderland.
Provenance and peer reviewNot commissioned; externally peer reviewed.
Data sharing statement The corresponding author should be contacted if anyone wishes to access unpublished data from the study.
Open Access This is an Open Access article distributed in accordance with the Creative Commons Attribution Non Commercial (CC BY-NC 4.0) license, which permits others to distribute, remix, adapt, build upon this work non-commercially, and license their derivative works on different terms, provided the original work is properly cited and the use is non-commercial. See: http://creativecommons.org/ licenses/by-nc/4.0/
REFERENCES
1 Healthcare Commission.Clearing the air. A national study of chronic obstructive pulmonary disease. Commission for Healthcare Audit and Inspection, 2006. 2 Seemungal TA, Donaldson GC, Paul EA,et al. Effect of exacerbation on quality of
life in patients with chronic obstructive pulmonary disease.Am J Respir Crit Care Med1998;157:1418–22.
3 Doll H, Miravitlles M. Health-related QOL in acute exacerbations of chronic bronchitis and chronic obstructive pulmonary disease: a review of the literature. Pharmacoeconomics2005;23:345–63.
4 Bourbeau J, Ford G, Zackon H,et al. Impact on patients’health status following early identification of a COPD exacerbation.Eur Respir J2007;30:907–13. 5 Soler-Cataluña JJ, Martínez-Garcia MA, Román Sánchez P,et al. Severe acute
exacerbations and mortality in patients with chronic obstructive pulmonary disease. Thorax2005;60:925–31.
6 Donaldson GC, Seemungal TA, Bhowmik A,et al. Relationship between exacerbation frequency and lung function decline in chronic obstructive pulmonary disease.Thorax2002;57:847–52.
7 Stone RA, Holzhauer-Barrie J, Lowe D,et al.COPD: Who cares matters. National Chronic Obstructive Pulmonary Disease (COPD) Audit Programme:
Clinical audit of COPD exacerbations admitted to acute units in England and Wales 2014, 2015.
8 Johannesdottir SA, Christiansen CF, Johansen MB,et al. Hospitalization with acute exacerbation of chronic obstructive pulmonary disease and associated health resource utilization: a population-based Danish cohort study.J Med Econ 2013;16:897–906.
9 de Miguel-Díez J, Jiménez-Garcia R, Hernández-Barrera V,et al. Trends in hospital admissions for acute exacerbation of COPD in Spain from 2006 to 2010.Respir Med2013;107:717–23.
10 Royal College of Physicians, British Thoracic Society, British Lung Foundation.Report of the National Chronic Obstructive Pulmonary Disease Audit 2008: Clinical audit of COPD exacerbations admitted to acute NHS trusts across the UK. London: Royal College of Physicians, 2008.
11 Wildman MJ, Sanderson C, Groves J,et al. Predicting mortality for patients with exacerbations of COPD and asthma in the COPD and Asthma Outcome Study (CAOS).QJM2009;102:389–99.
12 Steer J, Gibson J, Bourke SC. The DECAF Score: predicting hospital mortality in exacerbations of chronic obstructive pulmonary disease.Thorax2012;67: 970–6.
13 Steer J, Norman EM, Afolabi OA,et al. Dyspnoea severity and pneumonia as predictors of in-hospital mortality and early readmission in acute exacerbations of COPD.Thorax2012;67:117–21.
14 Knaus WA, Draper EA, Wagner DP,et al. APACHE II: a severity of disease classification system.Crit Care Med1985;13:818–29.
15 Shorr AF, Sun X, Johannes RS,et al. Validation of a novel risk score for severity of illness in acute exacerbations of COPD.Chest J2011;140:1177–83.
16 Wildman MJ, Harrison DA, Welch CA,et al. A new measure of acute physiological derangement for patients with exacerbations of obstructive airways
disease: the COPD and Asthma Physiology Score.Respir Med 2007;101:1994–2002.
17 Lim WS, van der Eerden MM, Laing R,et al. Defining community acquired pneumonia severity on presentation to hospital: an international derivation and validation study.Thorax2003;58:377–82.
18 Moons KG, de Groot JA, Bouwmeester W,et al. Critical appraisal and data extraction for systematic reviews of prediction modelling studies: The CHARMS Checklist.PLoS Med2014;11:e1001744.
19 O’Driscoll BR, Howard LS, Davison AG,et al. BTS guideline for emergency oxygen use in adult patients.Thorax2008;63(Suppl 6):vi1–68.
20 Carley S, Dosman S, Jones SR,et al. Simple nomograms to calculate sample size in diagnostic studies.Emerg Med J2005;22:180–1.
21 Rubin DB. Multiple imputation after 18+ years.J Am Stat Assoc1996;91: 473–89.
22 DeLong ER, DeLong DM, Clarke-Pearson DL. Comparing the areas under two or more correlated receiver operating characteristic curves: a nonparametric approach. Biometrics1988;44:837–45.
23 Hosmer DW Jr, Lemeshow S. Goodness-of-fit tests for the multiple logistic regression model.Commun Stat1980;A9:1043–69.
24 Fletcher C. Standardised questionnaire on respiratory symptoms: a statement prepared and approved by the MRC Committee on the Aetiology of Chronic Bronchitis (MRC breathlessness score).BMJ1960;2:1665.
25 Stiell IG, Clement CM, Aaron SD,et al. Clinical characteristics associated with adverse events in patients with exacerbation of chronic obstructive pulmonary disease: a prospective cohort study.CMAJ2014;186:E193–204.
26 Quintana JM, Esteban C, Unzurrunzaga A,et al. Predictive score for mortality in patients with COPD exacerbations attending hospital emergency departments.BMC Med2014;12:66.
27 Pozo-Rodríguez F, López-Campos JL, Alvarez-Martínez CJ,et al. Clinical audit of COPD patients requiring hospital admissions in Spain: AUDIPOC study.PLoS ONE 2012;7:e42156.
28 National Clinical Guideline Centre.Chronic obstructive pulmonary disease: management of chronic obstructive pulmonary disease in adults in primary and secondary care. London: National Clinical Guideline Centre, 2010.
29 Peto R, Speizer FE, Cochrane AL,et al. The relevance in adults of air-flow obstruction, but not of mucus hypersecretion, to mortality from chronic lung disease. Results from 20 years of prospective observation.Am Rev Respir Dis 1983;128:491–500.
30 Roche N, Zureik M, Soussan D,et al. Predictors of outcomes in COPD exacerbation cases presenting to the emergency department.Eur Respir J 2008;32:953–61.
140 Echevarria C,et al.Thorax2016;71:133–140. doi:10.1136/thoraxjnl-2015-207775
Chronic obstructive pulmonary disease
group.bmj.com on June 29, 2016 - Published by