This is a repository copy of The role of diversification profiles and dyadic characteristics in the formation of technological alliances: Differences between exploitation and exploration in a low-tech industry.
White Rose Research Online URL for this paper: http://eprints.whiterose.ac.uk/115199/
Version: Accepted Version
Article:
Krammer, SMS (2016) The role of diversification profiles and dyadic characteristics in the formation of technological alliances: Differences between exploitation and exploration in a low-tech industry. Research Policy, 45 (2). pp. 517-532. ISSN 0048-7333
https://doi.org/10.1016/j.respol.2015.10.014
(c) 2015, Elsevier Ltd. This manuscript version is made available under the CC BY-NC-ND 4.0 license http://creativecommons.org/licenses/by-nc-nd/4.0/
[email protected] https://eprints.whiterose.ac.uk/ Reuse
Unless indicated otherwise, fulltext items are protected by copyright with all rights reserved. The copyright exception in section 29 of the Copyright, Designs and Patents Act 1988 allows the making of a single copy solely for the purpose of non-commercial research or private study within the limits of fair dealing. The publisher or other rights-holder may allow further reproduction and re-use of this version - refer to the White Rose Research Online record for this item. Where records identify the publisher as the copyright holder, users can verify any specific terms of use on the publisher’s website.
Takedown
If you consider content in White Rose Research Online to be in breach of UK law, please notify us by
The role of diversification profiles and dyadic
characteristics in the formation of technological
alliances: Differences between exploitation and
exploration in a low-tech industry
Sorin M.S. Krammer
∗†Abstract
This paper posits that corporate and technological diversification of firms and their relatedness in terms of products and technologies will impact their propensity to form technological alliances. It argues that both higher levels of diversification and greater relatedness signal superior capabilities and available resources to prospective partners that will facilitate exploration and exploitation of technological assets in an alliance. These theoretical conjectures are tested using a dataset of all tire producers worldwide between 1985 and 1996 that combines detailed firm data on establishment, patenting, and alliance activities. The results indicate that complementarity in terms of corpo-rate and technological diversification stcorpo-rategies, as well as partner characteristics (e.g., size, age, and technological capabilities) drive exploitation alliances. Moreover, firms with similar product portfolios are more likely to engage in exploitative interactions. In contrast, exploration alliances exhibit strong partner similarity across all firm char-acteristics. Both corporate and technological diversification have positive effects on firms’ propensity to engage in exploration, while technological distance has a negative nonlinear one.
∗Centre for International Business, Leeds University Business School, Leeds LS29JT, United Kingdom;
Email:[email protected]
†I would like to thank Keun Lee and the appointed Reviewers at Research Policy, Ken Simons, Susan
1
Introduction
Most of the world’s corporations are actively engaged in corporate diversification via prod-ucts, markets or technologies (Rumelt, 1982; Hitt et al., 1997; Suzuki and Kodama, 2004; Ravichandran et al., 2009) as an avenue to boost performance (Tanrivedi and Lee, 2008) and develop new core competences (Hitt and Ireland, 1986; Lei et al., 1996). Thus, cor-porate diversification is commonly employed by firms to consolidate competitive positions (Penrose, 1959), create positive synergies across divisions (Teece, 1982), insulate against external threats (Amit and Livnat, 1998), and capitalize on related products and customers (Tallman and Li, 1996; Miller, 2006). Likewise, technological diversification has been consis-tently identified as a key contributor to firm growth (Granstrand, 2000), performance (Leten et al., 2007) and innovation (Huang and Chen, 2010) through significant economies of scale, scope, speed, and space that complement each other (Fai, 1999). Subsequently, the level of technological diversification has increased significantly in the last decades (Giuri et al., 2004), and intricate technological portfolios are common today among leading firms across many industries (Cantwell and Piscitello, 2000; Quintana-Garcia and Velasco, 2008).
Besides diversification, which mandates significant resource commitments, firms can also acquire competences and leverage existing assets through external links with other compa-nies (Stuart, 2000; Giuri et al., 2004; Wang and Zajac, 2007). Driven by technological change and global competition, exploratory inter-firm agreements that involve bilateral exchanges of technologies, like public-private partnerships, outsourced or networked R&D and techno-logical alliances, have gained significant momentum in recent years (Gulati, 1995a; Kale et al., 2000; Kim and Inkpen, 2005; Gnyawali et al., 2011).1 Similarly, exploitative agreements,
such as subcontracting, original equipment manufacturing (OEM), licensing, or joint venture projects, that capitalize on existing technological competencies are responsible for signifi-cant flows of technologies, boosting the productivity of many small- and medium-size firms in emerging markets (Lee and Beamish, 1995; Narula and Sadowski, 2002). Encapsulated under the broad concept oftechnological alliances2 , these interactions have been extensively
employed by firms for both exploitation and exploration (Rothaermel and Deeds, 2004; De-Man and Duysters, 2005; Yamakawa et al., 2011). Nevertheless, these functional types of alliances are qualitatively different, as explorative agreements focus on the search for new knowledge, while exploitative ones emphasize the use of existing one (March, 1991).
1
For example, in 2003, contracted-out R&D for US manufacturers grew three times faster than the internal one, public-private R&D partnerships flourished with 2,936 cooperative R&D agreements, and the number technological alliances worldwide was almost 700 (NSF, 2006).
2
With respect to the drivers of these alliances, the literature has proposed a variety of explanations that span different levels of analysis (Hagedoorn, 1993; Oxley, 1999; Garcia-Canal et al., 2008). Accordingly, firms often form alliances to access new markets (Glaister, 1996) and technologies (Kale et al., 2000), while retaining strategic benefits from these relationships such as lower uncertainty and costs (Narula, 2003) or greater market power (Kogut, 1991). Yet, the issue of how firms select alliance partners has received less attention in the literature (Nielsen, 2003). A survey of more than 40 studies suggests that partner complementarity, commitment, and compatibility (fit) are the key drivers of alliances (Shah and Swaminathan, 2008). Although all these attributes are vital for forming an alliance, their effects are contingent on other factors, such as the context of partners (Kale and Singh, 2009), their prior experience (Rothaermel and Boeker, 2008), level of mutual trust (Gulati, 1995b), and idiosyncratic characteristics of managers (Einsehardt and Schoonhoven, 1996) and agreements themselves (Shah and Swaminathan, 2008).
While this extensive body of research provides many insights into the drivers of alliances, it still lacks depth in several areas. First, despite the plethora of studies examining diversifi-cation strategies and alliances, these streams of literature remain in essence autarkic despite their theoretical relatedness and relevance for firm performance (Mowery et al., 1998; Giuri et al., 2004). Furthermore, with few exceptions (Fai, 1999; Wang and Zajac, 2007), most diversification studies adopt a skewed view of this phenomenon, focusing solely on one as-pect (e.g., product, market, geography or technology). Second, alliances are often examined at isolated levels of analysis, either the transaction, firm, dyad, or network. Instead, the recent literature advocates the use of more comprehensive frameworks for analysis across multiple levels which are better suited for capturing the heterogeneity behind the motives for forming alliances and providing also richer predictions in the presence of competing ex-planations (Wang and Zajac, 2007; Duysters et al., 2007; Lin et al., 2009). Finally, most empirical studies on alliances are confined to high-tech sectors (e.g., IT, electronics, biotech-nology) and firms from the developed Triad (i.e., North America, Japan and Europe) as a consequence of data availability across countries and industries (Schilling, 2009). This restricts significantly the generality of their findings and policy implications regarding non high-tech industries and developing nations (Hirsch-Kreinsen, 2008; Szirmai, 2012), which remain severely underrepresented in this literature (De Man and Duysters, 2005).
protect from unwanted spillovers) that are common for both formation of alliances and di-versification strategies. The proposed contributions target three important aspects. First, this work introduces theoretical mechanisms for the relation between firm diversification pro-files and the decision to form technological alliances. Notably, it argues that both corporate and technological diversification signal superior capabilities and resources that increase the appeal for an alliance and, moreover, provide additional knowledge to partnering firms on how to utilize more efficiently their technological assets for exploitation and exploration. Second, this study adopts a multi-level approach to address the heterogeneity of drivers be-hind alliance formation (Wang and Zajac, 2007) and jointly examines the effects of firm- and dyadic- factors on firms’ propensity to form alliances. To this end, it focuses on the effects of technological and product similarity between prospective partners on alliance formation as greater similarity allows firms to lower coordination costs, facilitates mutual learning and takes advantage of existing synergies to improve efficiency. Finally, the empirical investiga-tion focuses on a mature and low-tech industry (i.e., tires) that is characterized by global reach, significant R&D efforts at the top, and a great variety of diversification strategies. Together, these factors recommend the tire industry as a good candidate for testing these hypotheses, and provide an opportunity to augment the alliance literature by shifting the focus on intra-firm technology transfers to developing countries and low-tech sectors, which still account for a large share of production and employment in many economies (Hirsch-Kreinsen, 2008).
The rest of the paper is structured as follows. The second section develops testable hypotheses for the relationship between firms’ diversification profiles and their choices for technological alliances. Then, the next section describes the dataset, variables employed, and the estimation choices made in the empirical part followed by a discussion of results (Section 4) and conclusions (Section 5).
2
Theory and hypotheses
2.1
Alliances as vehicles for technology transfers
market advantages (Anand and Khanna, 2000). Moreover, many alliances nowadays exhibit technological exchanges and target international partners (Narula and Hagedoorn, 1998; Garcia-Canal et al., 2008). In terms of organizational choices, alliances are extremely flex-ible, ranging from simple long-term contractual agreements with a narrow focus (e.g., long standing licensing or technology-sharing agreements) to formation of new entities (e.g., joint-ventures), all with the goal of maximizing the sought benefits (e.g., mitigate R&D risks, push new industry standards, access new markets) of such collaborations (Teece, 1986; Wang and Zajac, 2007).
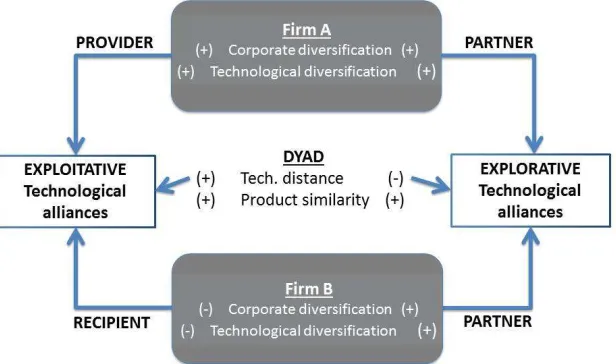
As a result, technological alliances represent an attractive way for firms to use their tech-nological knowledge to access complementary assets or secure competitive advantages via exploration and exploitation (Kim and Inkpen, 2005; Duysters et al., 2007; Sampson, 2007). While exploration alliances require partners to learn from each other or acquire new knowl-edge with the specific purpose of creating new capabilities and competences, exploitation alliances are clearly focused on leveraging existing resources and capabilities for more imme-diate gains (March, 1991). Although, firms benefit significantly from both types of alliances (Lavie and Rosenkopf, 2006), the choice between exploration and exploitation is a result of heterogeneous factors that stem from firms’ strategic intentions, potential for learning, and the expected returns from their technological assets (Koza and Lewin 1998). Therefore, it is imperative to analyze them separately in conjecture with partners’ diversification profiles and their dyadic similarities, and develop an integrative perspective on the relation between various diversification types and alliance choices (Figure 1).
2.2
Firm diversification profile
Figure 1: Conceptual framework
et al., 1989). This conjecture is confirmed by recent empirical evidence which indicates a curvilinear relationship between the degree of diversification and firm performance (Palich et al., 2000), contingent on industry- and firm-specifics (Hitt et al., 1990).
In relation to alliance formation, the size and composition of firm’s technological resources are indicative of its potential for setting up technological alliances (Rothaermel, 2001) and licensing deals (Arora et al., 2001). However, this potential is not automatically realized without additional efforts to manage and nourish such partnerships (Miotti and Sachwald, 2003). When a firm diversifies, it implicitly acquires greater knowledge (of markets, prod-ucts, consumers, competitors, technologies, etc.), which in turn, allows it to identify better and faster external opportunities (e.g., form an alliance) for the exploitation and exploration of its technological capabilities. Therefore, to integrate these different aspects of firm di-versification in relationship with its choices for technological alliances, I consider markets and technologies as the two most common aspects of firm diversification strategies (Hitt et al., 1997; Granstrand, 2000) and argue that they will impact firms’ decision to form a technological alliance.
2.2.1 Corporate diversification
com-petitiveness (Rumelt, 1982). For this study I will focus mainly on one aspect of corporate diversification strategy, namely new markets or niches (Palich et al., 2000). In today’s glob-alized world, firm activities often sprawl across multiple industries, which makes it difficult to assign them a single (or even a main) industry affiliation. Some extreme examples of this would be industrial conglomerates such as General Electric in the USA, Japanese Keiretsus, or the Korean Chaebols that are actively involved in numerous lines of business. Market diversification across is defined as the business expansion into new market segments that have not been targeted in the past, where firms can realize benefits through economies of scale and superior internal routines3. In general, firms diversify across multiple markets to
consolidate their competitive position, create synergies between divisions, cope efficiently with competitors, and insulate against external threats (Amit and Livnat 1988).
2.2.2 Technological diversification
Technological diversification is conceptualized as the expansion of firms’ knowledge base into a wider range of technical fields (Miller, 2006). This increase in the size and depth of firm’s technological portfolios has become a surging trend in industrialized countries (Breschi et al., 2003; Leten et al., 2007) emphasizing the role of technology in securing competitive advantage and market success (Granstrand 2003). Thus, greater technological endowments bear positive effects on firm economic and innovative performance, leading to a better and more sustainable competitive position (Suzuki and Kodama, 2004; Huang and Chen, 2010). Moreover, as technological diversification is a subject of path-dependencies (Cantwell and Andersen, 1996), it actually represents a good predictor for firms’ long-run productivity and financial performance (Pavitt, 1998)4.
2.2.3 The relationship between corporate and technological diversification
The relationship between corporate (in the form of either market or product diversification) and technological diversification is quite complex (Fai, 2004). Patel and Pavitt (1997) were the first to show that the degree of technological diversification for large firms was much greater than the product one. Firms tap into different of business niches as a result of different technological capabilities and products, and these technological bases tend to co-evolve over time. As a result, technological breadth is often a good predictor for introduction of new products, which in turn increases its market share and allows it to penetrate new markets and niches (Pavitt, 1998). Thus, regardless of choices in terms of these diversification
3
This is an inter-industry indicator for firm’s success across multiple domains of activity.
4
strategies (e.g., focus on one or both; concurrently or sequentially), their interaction remains an important source of firm dynamism and growth over time (Granstrand, 2003). As both the needs of consumers and the firm competences evolve in response to changes in demand and competitive position, more resource-business couplings are typically added than scrapped by firms, which results in increased diversification (Fai, 2004).
In terms of theoretical explanations, the resource-based arguments focus on the related-ness between products from economies of scale and scope and the limited range of resources. Alternatively, evolutionary economics emphasizes the evolution of products and markets as a result of their underlying technologies. Employing routines and learning-by-doing firms are able to generate slack to be used for product diversification, where search and selection processes build on existing technological competences, seeking synergies for new corporate avenues for diversification (Mowery et al., 1998; Piscitello, 2004). Hence, the interplay be-tween technological and corporate diversification appears to be strong and positive in theory, but the direction and strength of this relationship are yet to be assessed empirically in the literature (Fai, 2004).
2.3
Diversification profiles and alliance decisions
Combining arguments from the dynamic capabilities theory (Teece et al., 1997; Luo, 2000) and organizational learning (Levitt and March, 1988; March, 1991), I argue that firms that are more diversified across markets and technologies will be more likely to engage in tech-nological alliances for both exploitative and explorative reasons. This will occur through several mechanisms.
First, corporate diversification across different markets can be seen both as a substitute and a complement for technological alliances. In support of the former, firms need to commit extra resources for the management of both diversification and alliances, and quite often with similar objectives (Tsang, 1998). Therefore, if a firm is not able to reach certain niches due to limited resources or capabilities, setting up an alliance with a partner in that market represents a viable alternative to internal diversification (Giuri et al., 2004). Subsequently, firms are faced with a ”make, buy or ally” decision, which shifts resources between internal development of dynamic capabilities via diversification strategies and outsourcing to external partners via an alliance (Geyskens et al., 2006).
ex-ploitation of technological opportunities outside firm’s core-industry (Luo, 2000). Consistent with these arguments, studies on market diversification in an international context propose a complementary relationship between resources and capabilities required for alliance for-mation on one hand, and diversification strategies on the other (Tsang, 1998; Brouthers and Hennart 2007). Moreover, market diversification increases both firms’ appeal as an alliance partner (given the extended capabilities required to be successful in multiple markets), and the access to a larger pool of potential partners from all these markets in which it is active. Hence, diversification provides firms with more options for both exploitation and exploration of their technological assets (Makino and Delios, 1996). Ultimately, firm’s ability to generate synergies between its technological competences and its diversification strategies determines its economic performance (Piscitello, 2004).
Second, technological diversity is directly linked with firm’s involvement in technological alliances, as highly diversified firms in terms of technology are not able to rely exclusively on internal R&D efforts (Cassiman and Veugelers, 2006). Many of them need to acquire and complement their in-house knowledge with external sources such as in-licensing or joint re-search with third parties, e.g., rere-search institutes, universities, and even competitors (Narula, 2003). In these cases, firms with large technology portfolios rely heavily on external sources of knowledge through either acquisition, outsourcing or collaboration (Granstrand, 2000; Cas-siman and Veugelers, 2006). Despite this, sharing technology with other firms in the industry is a double-edge sword. On one end, it implies a negative relationship between technological diversity and alliances, since firms would like to maintain exclusive rights on internal tech-nical expertise, and therefore minimize any possible spillovers to competitors (Rivette and Kline, 1999; Granstrand, 2000; Lin et al., 2009). Oppositely, most firms have a much larger base of technologies than products (Gambardella and Torissi, 1998; Breschi et al., 2003) due to the increasing complexity of product and processes over time (Rycroft and Kash 1999). Thus, most of these technologically-diversified firms go well beyond their core-business in terms of technical competencies, and alliances give them the ability to exploit successfully this pool of technological assets in related industries, or via collaborations with competitors (Patel and Pavitt, 1997; Gambardella et al., 2007). As a result, technological diversification brings more exploration and exploitation opportunities, thus encouraging alliance formation (Giuri et al., 2004)5. Well-diversified firms will prefer to exploit their technical know-how in
alliances where they will act as technology providers to other firms, or seek new possibilities for exploration in collaborative partnerships with other similar well-endowed firms in terms of technical know-how.
5
Finally, tapping the global technology markets (for exploitation) and the quest for tech-nological partners (for exploration) are both complex processes, marked by continuous trials and frequent failures (Arora et al., 2001; Kale, Dyer and Singh, 2002). Firms face significant difficulties in finding appropriate partners for exploitation and exploration, as this requires balancing different characteristics of prospective partners and their potential impact on the alliance objectives and success (Kale and Singh, 2009). As a result, the selection of part-ners for alliances is largely determined by the perception of appropriation and coordination concerns vis a vis prospective partners (Gulati and Singh, 1998). In this context, diversi-fication may also reflect knowledge about markets and technologies which a firm acquires as a byproduct of its activities (Granstrand, 2000). While firms may poses significant tech-nological assets that cater to both partners within and outside their core market niche, they often have difficulties in identifying these opportunities, especially in distant areas of activity. Firms with broader knowledge of other markets, products, and technologies will take advantage of learning effects and economies of scale and scope (Teece et al., 1997), increasing further their reach of new alliance partners. Thus, diversity across these dimen-sions has a positive influence on firms’ prospects for new alliance objectives and prospective partners (Kogut and Zander, 1992). This reasoning is particularly salient for larger firms with significant resources for exploitation and exploration of their technologies within their networks of suppliers and clients, but who are also actively seeking to optimize their return on technological assets (Teece, 2006).
In accordance with the above arguments, well-diversified firms (across markets and tech-nologies) will be more likely to get involved in technological alliances altogether, given their superior dynamic capabilities (Teece 2007). Firms’ degree of diversification reflects their knowledge of markets and products (Granstrand, 2000) as well as their success in acquiring external technological knowledge via inter-firm collaborative and licensing agreements (Con-tractor and Lorange 2002). Hence, as they diversify, firms will be more likely to engage in alliances for both exploitation and exploration rationales.
they will likely act as recipients of technologies from more diversified and technologically-endowed partners in exchange for other privileges such as market access, production facilities, distribution channels (Giuri et al., 2004; Yang et al., 2011).
In light of all these considerations, I propose the following hypotheses:
H1. Corporate and technological diversification of a firm will increase its propen-sity to engage in exploitation alliances as a provider of technology (a) or in an exploration alliance as a technological partner (b).
2.4
Dyadic characteristics and alliance decisions
In addition to the individual profiles of prospective partners, their joint characteristics (sim-ilarities or dissim(sim-ilarities) are also indicative for alliance formation and subsequently, its success (Kale and Singh, 2009). Such similarity between firms is generically referred to as ”business relatedness” (Koh and Venkatraman, 1991), but its definition and operationaliza-tion varies significantly in the literature (Wang and Zajac, 2007). Given that firms’ resources and capabilities can be conceptualized across multiple dimensions (e.g., products, markets, technologies) and levels of analysis (e.g., business units, plants, managers), I focus on the two most common dimensions of business and technological relatedness, namely products and technologies.
2.4.1 Product similarity
Product similarity is commonly defined as the overlap in the production space between two partners. Firms seek synergies from collaborations to increase their efficiency levels. Similar firms poses similar types of assets and operations, yielding immediate gains from collabora-tions. This conjecture is supported by most empirical findings in the literature. For instance, Wang and Zajac (2007) show that business similarity (computed using 4 digit NAICS codes) impacts firms’ decision to ally or acquire. Lee et al. (2008) find a U-shaped relationship between organizational similarity and the subsequent learning in an alliance. Finally, Yang et al. (2010) argue that firms’ similarity in terms of status (i.e., its position among peers) influence their partnering decisions. While the literature suggests that synergistic benefits are greater from complementary resources in the case of acquisitions (Harrison et al., 2001), I expand these rationales and argue that product similarity of firms will have a positive effect on the propensity to form technological alliances.
different implications for exploitation and exploration. For the latter, organizational learn-ing theory suggests that product similarity is a prerequisite for successful alliances, as it facilitates organizational efficiency (Garette and Dausauge, 2000) and encourages mutual learning (Teece, 2006). The required consensus over controversial decisions in an alliance could trigger costly and time consuming negotiations and delays which will affect the success of the alliance. As a result, similar firms are better positioned to work as alliance partners that tap into benefits arising from their business similarity (Tanriverdi and Venkatraman, 2005), while reducing costs and uncertainty surrounding the alliance.
Furthermore, exploration alliances are set-up with an explicit goal of acquiring new knowl-edge (Inkpen, 2001). In turn, this objective mandates similarity (in terms of skills, routines, products, competences) to meet successfully the learning objectives of these partnerships (Harrison et al., 2001) and generate economic benefits for firms (Gulati 1995a). Firms with similar products are more likely to share inputs, technologies and markets, which makes them more aware of each other’s potential for contributions to the alliance, as well as post ex-pectations concerning the scope of knowledge transfer and access to privileged information (Bleeke and Ernst, 1995). Moreover, similarity between partners presents opportunities for greater value creation in the alliance in the absence of conflicting economic interests and informational asymmetries (Wang and Zajac, 2007). Thus, explorative endeavors focusing on learning are more likely to be successful if the two partners are more similar (Mowery et al., 1998).
from similar assets and reducing appropriation and coordination concerns (Tanriverdi and Venkatraman, 2005; Lee et al., 2008).
Following these arguments, I hypothesize that firms which are similar in terms of product portfolios to be more likely to engage in technological alliance for both exploitation and exploration:
H2. Product similarity between a pair of firms has a positive effect on their propensity to form an exploitation alliance (a) or an exploration one (b).
2.4.2 Technological distance
Prior studies of alliance performance and partnering decisions using patent statistics reveals a positive relationship between technological similarity of partners and alliance occurrence, especially in high-tech industries where both alliances and large technological portfolios are quite common (Lane and Lubatkin, 1998; Stuart, 2000; Wang and Zajac, 2007). These studies rely on the assumption that the technological similarity or relatedness of partners increases their absorptive capacity, and allows them to tap more successfully into each others’ pools of knowledge (Cohen and Levinthal, 1990). That ultimately leads to greater diffusion of knowledge and cross-fertilization of ideas among the alliance partners resulting in more value. While most existing studies hypothesize a linear relationship between firms’ technological similarity (or its inverse concept, technological distance) and the decision to ally or acquire, the evidence about the sign and shape of this relationship remains mixed (Colombo, 2003; Sampson, 2007).
provider-recipient relationships) but this effect would be greater at intermediate levels of distance.
Likewise, a large distance between prospective partners in terms of technological capabil-ities will deter the formation of exploration alliances (Sampson, 2007). In these cases, highly innovative firms will limit their search to the nearest firms in terms of technological assets (Rothaermel and Boeker, 2007), therefore reducing the coordination and appropriation risks of the alliance (Gulati and Singh, 1998). This conjecture is supported by the existing em-pirical evidence, which suggests that firms with less distant technological capabilities are more likely to form an alliance (Mowery et al., 1998), stimulate cross-learning (Lane and Lubatkin, 1998) and innovation in the post-alliance period (Ahuja, 2000; Sampson, 2007). Therefore, greater technological distance is likely to reduce firms’ propensity to engage in explorative alliances.
However, if technological distance between two prospective partners is zero (i.e., there is a complete overlap between the technological assets of these firms) the opportunities for learning are greatly reduced (Hagedoorn, 1993; Yang et al., 2010). Pooling together very similar resources and competences does not encourage exploration, and leaves little room for creativity, as partners have little room to learn from each other. Therefore, diversity in terms of partner technological capabilities may actually increase firm learning (Sampson, 2007) and enhance their absorptive capacity (Cohen and Levinthal, 1990). Subsequently, firms face a trade-off between choosing a similar (low distance) partner in technological capabilities but decrease their exploration opportunities, and choose a different (distant) one that creates more possible combinations and learning avenues but with higher coordination and appropriation risks. This tension will be even more important for firms in low-tech industries, where average technological differences across firms are larger than those in high-tech industries with more even distribution of R&D expenditures across all firms (Hirsch-Kreinsen, 2008). In light of these arguments, technological distance between two prospective partners will have a negative and non-linear effect on their propensity to engage in an exploration alliance.
This yields the final hypothesis:
3
Method
3.1
Sample and data collection
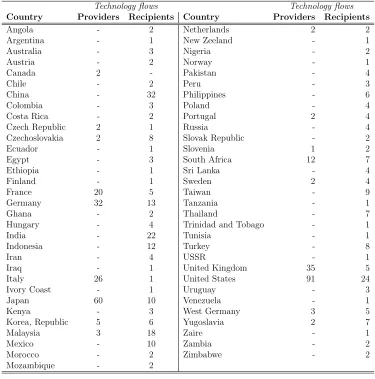
The dataset employed in this study includes data on tire producers worldwide between 1985 and 1996, collected from various issues of two industrial journals, namely the Euro-pean Rubber Journal and Rubber and Plastic News6. The tire industry exhibits a wide
range of international collaborations thus providing a propitious environment for testing my hypotheses. Its geographic representation has remained constant over the time interval considered (around 80 countries) and it exhibited positive growth rates for the number of firms (4%), production plants (2.5%), and active technological alliances (6%) (for details see Table 2). Regarding the latter, most exploitative alliances (i.e, production/marketing agree-ments, ongoing licensing, etc.) occur between a firm from a developed country and one from a developing one, while explorative alliances (i.e., R&D projects, cross-licensing, etc.) form between firms from developed countries (Table 5 and Table 6). In terms of size, large firms (i.e, top 50 firms in the industry) are those that engage exclusively in exploitative alliances as providers of technology and as technological partners in explorative ones, consistent with the concentration of R&D efforts at the top of the industry 7. Furthermore, most of these
agreements are international, given the overall concentration of the industry at a global level (e.g., the ”Big Three” -Michelin, Goodyear and Bridgestone- hold around 45% of the global market.).
The dataset includes details on all tire producers worldwide: location and opening year of each of their plants, ownership, number of employees, tire types produced, production technology and capacity. However, given the variance in terms of data availability across years and countries, the final dataset is an unbalanced panel. Since we are interested in the occurrence of technological alliances between two firms in the industry, the dataset is organized asdirected dyads to distinguish between providers and recipients of technologies in the case of exploitation alliances8. In the any dyadij corresponding to exploitation alliances,
firm i is considered the source (i.e., provider) of technology, while j is the target (recipient) of it, while for exploration alliance the order of the two firms is random.
6
The resulting agreements have been cross-checked with alliance and joint-venture data from Thomson’s SDC Platinum restricting our search to horizontal agreements involving tire producers.
7
For example, the ”Big Three” contribute roughly to almost 40% of the R&D investments, and are responsible directly or indirectly (i.e, through majority-owned subsidiaries) for a third of the technological alliances in the industry.
8
3.2
Dependent variables and model
The dependent variable captures the probability of an alliance between firm A and firm B
in year t. The purpose of the alliance can be either exploitation orexploration. Thus:
PABtn =F[XAt, XBt, DABt] (1)
wherePABtis the probability thatAandB will engage in a technological alliance of either
exploitative or explorative nature (n), F is the cumulative probability function, XAt is a set
ofA’s characteristics, XBt is a set ofB’s characteristics andDABt describe dyad’s
character-istics. Data on the type of these technological alliances comes also from theEuropean Rubber Journal. Following Lavie and Rosenkopf (2006), I code this qualitative information from al-liance announcements, and distinguish between exploration (i.e., joint R&D projects , R&D based joint-ventures) and exploitation alliances (i.e., those with a technological component but mainly concerned with joint marketing, service, OEM, licensing, supply or production) between all possible firm dyads (pairs). Different from Lavie and Rosenkopf (2006), this study focuses solely on the horizontal dimension of technological alliances and therefore it does not have a ”hybrid alliance” category, which would combine knowledge-generating R&D with vertical integration of other activities. This focus on horizontal alliances is driven both by arguments for theoretical clarity (Phelps, 2010), and the empirical particularities of the industry, which indicate a very high incidence of technological partnerships exclusively among tire producers, as the top 20 tire producers are responsible for 80 to 90% of R&D and innovation in this industry (ERJ, various issues). Hence, I construct two binary dependent variables which equal 1 if there is an exploitative alliance (Exploit) or an exploratory one (Explore) and 0 otherwise.
3.3
Independent variables
resulting in extreme values for market diversification9. However, considering their historical
and relative importance for the industry I do not eliminate any of these potential outliers from my final sample. Instead, I perform some additional checks to make sure that they are not biasing my results10.
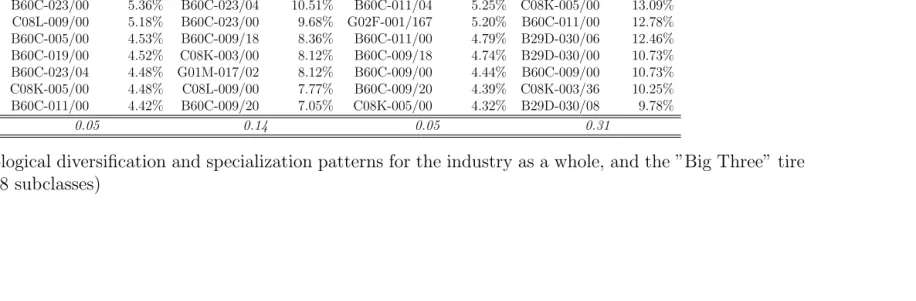
Technological diversification is computed using international patent data from Derwent Innovation Index (ISI Thomson) across different IPC (International Patent Classification) classes. All patents contain one or more technology field (IPC) given by a patent examiner that signals a certain application or technical function. A search in Derwent using keywords (”tyre” or ”tire”) combined with a manual filtering of recipients based on name matching, led to the collection of a panel of firm-specific patents focusing on tire technology. An excerpt of the main (i.e., top 25) classes and sub-classes associated with tire technologies is given in Table 7 and includes different technological processes that range from produc-tion of pneumatic or solid tires (B60C; B29D 30/00) to component manufacturing such as cords (D02G 03/48) or bands (B60C 11/00), and post-production tasks such as pressure measurements (G01L 17/00), testing (G01M 17/02) or repairing processes (B29C 73/00). This collection of patents reveals that the knowledge base of this industry extends beyond tire producers. An example of this broad knowledge base is the growing body of patents held by different car manufacturers (Honda, Ford, BMW, etc.) in key contingent areas like automotive, electronics and engineering, which exhibit significant growth potential for the future. Moreover, this pool of patents suggests that the complexity of tire technologies has increased over time, as reflected by the growing number of IPC classes, contradicting the conventional wisdom regarding innovation in a ”low-tech” industry. Using this patent data, I compute a diversification measure using a technological concentration index for each firm in the tire industry. Previous studies document that 4-digit level measures are very robust already (Van Zeebroeck et al., 2006)11. Since I focus on a single industry, I employ a finer
(8 digit) granulation of IPC codes to capture more accurately differences in technological specialization and the potential overlap between various tire producers.
Thus, the technological diversification index is computed as the inverse of a modified
9
Dunlop is one of these cases in which after its acquisition by BTR Plc. many of its operations have been sold to third parties, resulting in a very small contribution of 1-2% tire sales to BTR’s total sales. Other outliers are companies such as Nokia Corporation (Finland), Fulda (Germany); Inoue Rubber (Thailand); Trelleborg AB (Sweden) that have aggressively diverted their focus to contingent areas such as industrial elastomer parts, electronics and automotive, advanced polymers, etc., which have also resulted in lower contribution of tire to their total sales
10
In an additional analysis I eliminate all firms with percent of sales from tires of less than 10% and obtain similar results. These estimations are available upon request
11
Herfindhal index for the top 25 IPC classes (k = 1,25) in which a firm A is patenting:
T ECHDIVA25= 1/
25
X
k=1
(pkA)2
where
pk A=
Nk A
Pn
k=1NAk
andpk
Ais the percentage of firm A’s patents in IPC-8 subclassk of the total number of classes
(n) . If k is not among the top 25 patent classes in whichA patents, I assume (pk
A)2 →0,an
assumption that holds in most cases, given the great level of detail of patent data employed. Hence, a higher value for TECHDIV implies greater diversification, thus more IPC classes covered by a firms ’patents and a more even spread across these classes. For an example, see Table 7 in Appendix A. As a robustness test, I also explore other measures of diversity employed in the literature (technological breadth as the count of IPC-8 classes in which a firm patents tire technology, an entropy measure, and the sum of the logs of one over the variable in each class), all with similar results.
Production similarity is captured using the production sets of two prospective partners in a dyad (A and B). Since these are discrete variables (e.g. tire types produced), I compute a Jaccard index, defined as the size of the intersection divided by the size of the union of the two production sets following the formula:
P RODSIMA,B =
TA∩TB
TA∪TB
whereP RODSIMA,Bis the computed production similarity score between firmAand firmB
andTAand TB represent their production sets in terms of tire types fromAand respectively,
B. Following ERJ’s taxonomy of tires types I consider 9 categories: passenger, light truck, heavy truck or bus, agricultural, motorcycle, earth mover/all terrain, pneumatic industrial, aircraft, and racing tires. Most producers tend to specialize, designating specific production tasks to certain facilities, so that plants that produce more than 3-4 types of tires are quite rare12. Hence, T
m ∈ 1..9, m = A, B and P RODSIMA,B ∈ (0,1) with bigger values for
P RODSIMA,B indicating greater similarity betweenA and B.
I compute the technological distance between two tire producers as an Euclidian distance in terms of IPC classes in which partners patent most frequently (have a higher propensity
12
to patent). Thus, the distance between two firms A and B in year t is:
T ECHDIST(A, B) =
v u u t
25
X
k=1
(pA
k −pBk)2
wherepA
k is the percentage of firm A’s patents in IPC subclassk (IPC 8-digit classification),
respectively B’s patents in class k (pB
k). I survey the 25 largest patent classes for each tire
manufacturer, thus if k is outside these top values then pA
k and pBk equal zero. Since these
percentages do not sum up to one (e.g. a patent might fall into multiple IPC classes) the resulting distance measure ranges from 0 (totally similar) to 5 (totally different).
3.4
Controls
Most findings in the literature agree on the significance of firm specifics on alliance formation. Hence, firm size impacts the degree of technology production and sharing (Bayona et al., 2001; Miotti and Sachwald, 2003; Gambardella et al., 2007), although controlling for techno-logical endowments may dissipate this effect (Veugelers, 1997). I employ firms’ production capacity as a direct measure of their size in the regressions (size) and subsequently use also other variables (e.g. number of plants, employees) as proxies for size, with similar results to the ones reported here. Firm’s age is computed using the opening year of its first plant. Within our sample the median age is around 50 years, consistent with a mature industry.
Technological portfolios facilitate the creation and diffusion of new technologies, cross-fertilization of ideas between alliances partners, and improvements in absorptive capacity of firms (Cohen and Levinthal, 1990). To quantify firms’ technological capabilities, I follow prior studies and proxy it using international patent stocks. To compute patent stocks for all firms in the industry I use USPTO patent grants (patents) and the perpetual inventory method with an annual discount rate of 15 percent, common in the literature. Similar results are obtained using Derwent domestic patent data, which has a global coverage but is less suitable for international comparisons due to existing differences across national patenting regulations and fees.
technologies exchanged between two firms. These formal ties between firms are coded using a set of dummies that equal one if one of the firms is a minority holding, majority holding, or a joint venture13.
3.5
Estimation technique
In our dataset, the two dependent variables are observed binary outcomes, namely whether two firms form an exploitation alliance or not, and respectively whether they form an ex-ploration alliance or not. These two outcomes are both explained by the same vectors X
and D of variables listed in Equation 1, which include exogenous firm-specific and dyadic-specific factors featured in our hypotheses along with relevant controls, therefore, requiring a seemingly unrelated regression (SUR) approach:
yEXP,it∗ =βEXP +βX,EXP′ ∗Xit+βD,EXP′ ∗Dit+ǫEXP,it (2)
y∗
EXR,it =βEXR+βX,EXR′ ∗Xit+βD,EXR′ ∗Dit+ǫEXR,it (3)
ρ=Cov(ǫEXP,it, ǫEXR,it) (4)
The (latent) dependent variabley∗
T AL,itrepresents the type of technological alliance (TAL)
that a dyadiof firmsAandB opts for in yeart(i.e., exploitation-EXP or exploration-EXR), and this translates into the observed outcome yT AL,it as follows:
yT AL,it=
1 ify∗
T AL,it>0
0 otherwise , T AL=EXP, EXR
There are two potential problems in estimating these regressions. The first issue is ac-counting for potential interdependencies between these two types of alliances, given the prevalence of one or both strategies in firm behavior (Lavie and Rosenkopf, 2006). Thus, a non-zero and statistically significant ρ indicates that the two likelihoods are jointly deter-mined and requires specific econometric tools to account for this interdependence. A second concern refers to the endogeneity surrounding the decision to form an alliance. Commonly, the literature on alliance formation conceptualizes this self-selection as a two-stage process (Stuart, 2000): first, firms decide whether to engage in an alliance given the perceived op-portunities or threats (i.e., technological assets, experience, strategic intent, competitive pressures, etc.) and second, to seek an appropriate partner that meets best their specific needs. Intuitively, this self-selection into an alliance falls into the type of endogeneity
ad-13
dressed by the seminal work of Heckman (1979). However, the non-linearity of binary models is not appropriate for such two-step corrections for which no appropriate distributions are readily available, and may result in wrong conclusions and a larger bias (Freedman and Sekhon, 2010).
To address these concerns, I have opted for a bivariate probit model which controls for self-selection issues using the Conditional Mixed Process (CMP) model developed by Roodman (2011). CMP builds on the well-established system of seemingly unrelated regressions (SUR) in a recursive simultaneous equation system that employ maximum likelihood (ML) methods. It allows for both contemporaneous correlation between the error terms of Equations (2) and (3), and controls for selection biases which occur as a result of unobserved variables that affect both alliance outcomes (Oxley and Sampson, 2004). In addition to a regular bivariate probit, which already outperforms linear instrumental variable approaches in dealing with selection issues (Chiburis et al., 2012), the CMP also allows for explicit, Heckman-type, sample-selection controls. In CMP, sample sample-selection is modeled for the full dataset, and in parallel with modeling of a dependent variable of interest for the subset with complete observations (Roodman, 2011). Furthermore, for repeated observations, there is an opportunity to opt for a sandwich variance estimator that accounts for clustering. Given all these desirable properties of CMP that tackle the above mentioned issues, I employ this estimator for my main empirical results.
4
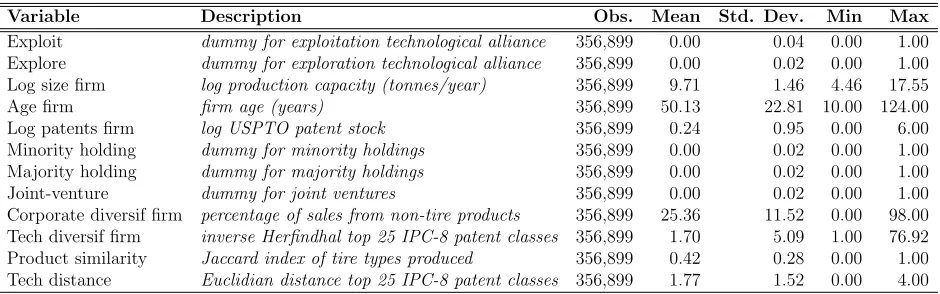
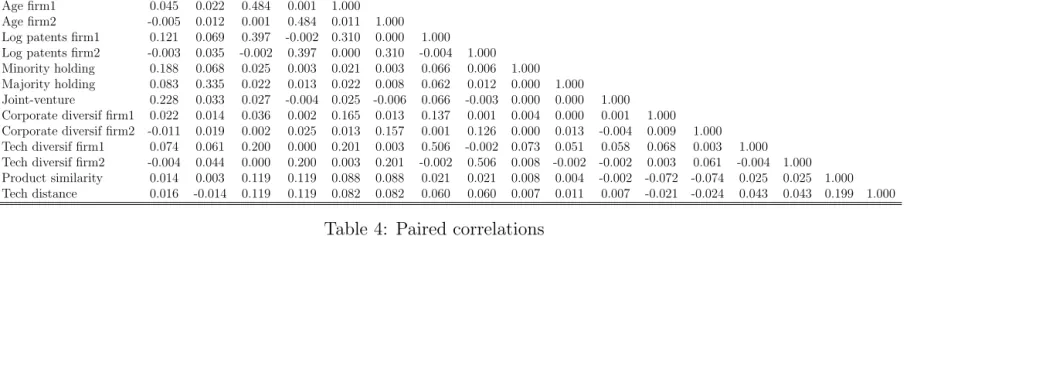
Results
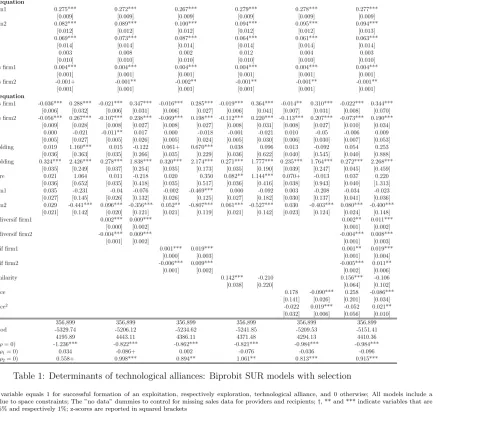
Table 3 provides descriptive statistics, while Table 4 presents the matrix of paired correla-tions for the main variables, all of which are within acceptable limits. The base results have been produced using the -cmp- command in Stata 13. All estimations use a SUR bivariate probit estimator and include heteroscedasticity and auto-correlation consistent standard er-rors clustered on the dyad. The last three rows of Table 1 report the results of Wald tests regarding the interdependence of Equations (2) and (3), and the correlations between the error term in the baseline model of exploitation (ρ1) and respectively, exploration (ρ2), and
the error term in the selection equation. These results suggest that the error terms of the two alliance equations are significantly correlated, recommending the bivariate probit as the appropriate estimation technique. Moreover, selection issues appear more prevalent in the case of exploration alliances.
Variables Model 7 Model 8 Model 9 Model 10 Model 11 Model 12
controls only H1a and H1b H2a and H2b H3a and H3b all
Exploit Explore Exploit Explore Exploit Explore Exploit Explore Exploit Explore Exploit Explore Selection equation
[image:23.612.124.671.41.529.2]Log size firm1 0.275*** 0.272*** 0.267*** 0.279*** 0.278*** 0.277***
[0.009] [0.009] [0.009] [0.009] [0.009] [0.009]
Log size firm2 0.082*** 0.089*** 0.100*** 0.094*** 0.095*** 0.094***
[0.012] [0.012] [0.012] [0.012] [0.012] [0.013]
Age firm1 0.069*** 0.073*** 0.087*** 0.064*** 0.061*** 0.063***
[0.014] [0.014] [0.014] [0.014] [0.014] [0.014]
Age firm2 0.003 0.008 0.002 0.012 0.004 0.003
[0.010] [0.010] [0.010] [0.010] [0.010] [0.010]
Log patents firm1 0.004*** 0.004*** 0.004*** 0.004*** 0.004*** 0.004***
[0.001] [0.001] [0.001] [0.001] [0.001] [0.001]
Log patents firm2 -0.001+ -0.001** -0.002** -0.001** -0.001** -0.001**
[0.001] [0.001] [0.001] [0.001] [0.001] [0.001]
Outcome equation
Log patents firm1 -0.036*** 0.288*** -0.021*** 0.347*** -0.016*** 0.285*** -0.019*** 0.364*** -0.014** 0.310*** -0.022*** 0.344*** [0.006] [0.032] [0.006] [0.031] [0.006] [0.027] [0.006] [0.041] [0.007] [0.031] [0.008] [0.070] Log patents firm2 -0.056*** 0.267*** -0.107*** 0.238*** -0.069*** 0.198*** -0.112*** 0.220*** -0.113*** 0.207*** -0.073*** 0.190***
[0.009] [0.028] [0.008] [0.027] [0.008] [0.027] [0.008] [0.031] [0.008] [0.027] [0.010] [0.034] Time trend 0.000 -0.021 -0.011** 0.017 0.000 -0.018 -0.001 -0.021 0.010 -0.05 -0.006 0.009
[0.005] [0.027] [0.005] [0.026] [0.005] [0.024] [0.005] [0.030] [0.006] [0.030] [0.007] [0.053] Minority holding 0.019 1.160*** 0.015 -0.122 0.061+ 0.670*** 0.038 0.096 0.013 -0.092 0.054 0.253
[0.036] [0.363] [0.035] [0.266] [0.035] [0.229] [0.036] [0.622] [0.040] [0.545] [0.040] [0.888] Majority holding 0.324*** 2.426*** 0.278*** 1.838*** 0.320*** 2.174*** 0.271*** 1.777*** 0.235*** 1.764*** 0.272*** 2.268***
[0.035] [0.249] [0.037] [0.254] [0.035] [0.173] [0.035] [0.190] [0.039] [0.247] [0.045] [0.459] Joint-venture 0.021 1.064 0.011 -0.218 0.020 0.350 0.082** 1.144*** 0.070+ -0.013 0.037 0.220
[0.036] [0.652] [0.035] [0.418] [0.035] [0.517] [0.036] [0.416] [0.038] [0.943] [0.040] [1.313] No data firm1 0.035 -0.231 -0.04 -0.076 -0.002 -0.469*** 0.000 -0.092 0.003 -0.208 -0.034 -0.023 [0.027] [0.145] [0.026] [0.132] [0.026] [0.125] [0.027] [0.182] [0.030] [0.137] [0.041] [0.036] No data firm2 0.029 -0.441*** 0.096*** -0.356*** 0.052** -0.807*** 0.061*** -0.527*** 0.030 -0.403*** 0.080*** -0.400***
[0.021] [0.142] [0.020] [0.121] [0.021] [0.119] [0.021] [0.142] [0.023] [0.124] [0.024] [0.148]
Corporate diversif firm1 0.002*** 0.009*** 0.002** 0.011***
[0.000] [0.002] [0.001] [0.002]
Corporate diversif firm2 -0.004*** 0.009*** -0.004*** 0.008***
[0.001] [0.002] [0.001] [0.003]
Tech diversif firm1 0.001*** 0.019*** 0.001** 0.019***
[0.000] [0.003] [0.001] [0.004]
Tech diversif firm2 -0.006*** 0.009*** -0.005*** 0.011**
[0.001] [0.002] [0.002] [0.006]
Product similarity 0.142*** -0.210 0.156*** -0.106
[0.038] [0.220] [0.064] [0.102]
Tech distance 0.178 -0.090*** 0.258 -0.086***
[0.141] [0.026] [0.201] [0.034]
Tech distance2 -0.022 0.019*** -0.052 0.021**
[0.032] [0.006] [0.056] [0.010]
N 356,899 356,899 356,899 356,899 356,899 356,899
Log-likelihood -5329.74 -5206.12 -5234.62 -5241.85 -5209.53 -5151.41
LR Chi2 4195.89 4443.11 4386.11 4371.48 4294.13 4410.36
Wald test (ρ= 0) -1.236*** -0.822*** -0.862*** -0.821*** -0.984*** -0.984***
Wald test (ρ1= 0) 0.034 -0.086+ 0.002 -0.076 -0.036 -0.096
Wald test (ρ2= 0) 0.558+ 0.998*** 0.894** 1.061** 0.813*** 0.915***
Table 1: Determinants of technological alliances: Biprobit SUR models with selection
(or tenure) and technological assets (in the form of patent stocks) of both firms in the dyad to be indicative of whether they are likely to form an alliance of any type (Stuart, 2000). Further, I expect that the size and age of firms will affect their propensity to engage in alliances, but not the type of alliances they form. Thus, I use firms’ size and age as exclusion restrictions in the first stage of the bivariate probit estimations14.
Table 1 displays the main results. From the upper part of the table we can see that size of both firms has a positive and significant effect on their alliance participation, tenure appears to be a prerequisite only for one firm in the dyad, and technological capabilities are both a stimulus and a deterrent for certain firms to enter alliances. To reconcile these apparently contradictory findings, I have ran some additional estimations. These robustness checks with separate probit models for each type of alliance (exploitation/exploration) and also simple biprobits reveal that, on average, exploitation alliances form between complementary partners (i.e., providers of technologies are often bigger, older firms with larger techno-logical endowments, whereas technology recipients are smaller, less endowed, and younger firms), while exploration alliances occur between similar partner (larger, younger and more technologically-active firms), which is in line with our expectations. These additional checks provide an intuitive explanation for the first stage results of the selection equation.
Moving to the lower part of Table 1, I will discuss now the outcome equation which estimates the effect of our hypothesized and control variables on dyads’ propensity to form either an exploitation or an exploration alliance. I start with a basic specification (Model 1) that incorporates only firm controls (technological capabilities of both provider and recipient, and existing relationship, if any, between them), two dummies for no availability of sales data, and a trend variable to capture any potential heterogeneity in formation of alliances across time. This specification will serve throughout the paper as a benchmark for testing the proposed hypotheses. The results confirm that firms who self-select into forming an alliance are more likely to opt for exploration, and less likely to opt for exploitation, if they poses more significant technological capabilities, as proxied by larger patent stocks. Formal ties between tire producers increase their chances of exchanging technology and this effect is amplified by the degree of integration, so that the likelihood of a technology transfer is higher for a majority holding than a joint-venture or a minority holding. Firms for which no sales data is available (i.e., outside the top 75 largest tire manufacturers worldwide) are less likely to form an exploration alliance, consistent with their relative position within the industry.
Models 2 and 3explore the hypothesized effects of firms’ diversification profiles.
Corpo-14
rate diversification of firms has a positive effect for firms’ engagement in exploitative alliances as providers of technologies and a negative one as technology recipients, supporting hypothe-sis H1a. This suggests that firms who are better diversified outside the tire domain, are more likely to set up technological alliances for exploitation. Likewise, the effects of technological diversification on firms’ propensity to engage in exploitation diverge, with a positive and a negative effect on firm’s to form an alliance within any given dyad. In accordance with our H1b, both higher corporate and technological diversification are associated with greater probability to enter exploration alliances. Together, these results confirm that diversification profiles of firms are valuable signals for prospective partners and good predictors for firms’ involvement in alliances.
In terms of the hypothesized effects of dyadic characteristics on alliance formation, the results commend product similarity (as measured by the Jaccard index) as a strong predictor of exploitative technological partnerships (Model 4), thereby confirming hypothesis H2a. Thus, firms that set up exploitation alliances (e.g., distribution, production or supply agree-ments in return for technological assistance) are likely to share a common base of products which would enable immediate use of this technologies. On the other hand, technological similarity of firms is not significantly related to exploitation (Model 5) confirming that the potential for immediate application of technologies (proxied by a wider range of common products) is more important for exploitation alliances. As a side note, although Hypothesis 3a was postulating a linear effect for technological distance in the case of exploitation, the bi-variate probit results reported in Model 5include also the squared term, which was needed for testing H3b. Additional estimations without the squared terms confirm that technological distance has no significant effect on the propensity to form exploitation alliances.
4.1
Robustness checks
To further validate these findings, I perform additional checks that target several key as-pects. Specifically, I include country fixed-effects (to address the unobserved effects of cross-country heterogeneity), run the analysis in various sub-samples of the dataset (e.g., exclude sequentially the biggest firms in the industry), use a more conservative measure of alliance formation (i.e., ”new” alliances, defined as longstanding technological agreements between partners that have not been engaged in the past), and employ other estimation methods and control variables. These results are not reported here due to space constraints, but are available upon request.
The countryfixed-effects estimations are carried out via simple probit models (as opposed to biprobits) and they pretty much wipe out the impact of firm size and weaken the signifi-cance of the recipients’ corporate diversification, while emphasizing the effects of inter-firm ties (minority, majority or JV holdings) for alliance formation. The gradual exclusion of the big tire producers (top 3, and then top 5) indicates that within such sub-samples both providers and recipients are less technological diversified. The analysis of different samples
(before and after 1992, as the median year in my dataset) reveals that smaller firms and minority holdings were more inclined to share technologies between 1986 and 1991 than the following period. Moreover, employing a more conservative measure for alliance formation by analyzing only ”new” agreements (defined as technology exchanges between two firms that have not interacted in the past in our sample) draws similar conclusions to the main analysis. Finally, in light of previous literature, my chosen measure of corporate diversifica-tion (percent of sales from non-tire products) is relatively close to an unrelated diversificadiversifica-tion metric. To complement it, I also employ a different proxy for diversification (i.e., the number of tire types produced), one that comes closer to related (or within-industry) diversification. Throughout most of these estimations the coefficient of this variable is positive but not sta-tistically significant, suggesting that only firms with superior capabilities that were used for unrelated diversification are able to attract prospective partners for technological alliances.
Furthermore, I check the results against otherestimation methods(e.g., multinomial logit, which allows three choices for each dyad, i.e., 1-exploitation alliance; 2-exploration alliance and 3- no alliance; and also a simple bivariate probit without selection),data samples (using a smaller sample that contains all the1s and a random draw of 5 percent of zero observations to minimize the possible bias arising from the large number of zeros) and control variables 15. All these results are in line with my main findings.
15
5
Discussion and conclusions
This study set out to examine how diversification profiles of firms and their dyadic charac-teristics affect their observed choices regarding technological alliances. My findings suggest that extensive corporate and technological diversification profiles signal prospective partners the existence of superior capabilities, knowledge and resources that can sustain both explo-ration and exploitation of technological assets via alliances. Moreover, similarities in terms of product portfolios induce more exploitation, while similarity in terms of technological assets spurs more exploration, although in a non-linear fashion.
With these findings, this work contributes to the extant literature in several ways. First, it links conceptually firms’ diversification strategies with their alliance choices complement-ing prior examinations of the links between internal and external strategies of firms (Giuri et al., 2004). Specifically, it focuses on two main measures of diversification, namely corpo-rate and technological, which give a broad picture of firms’ stcorpo-rategies across industries and technologies. Firms can be extremely successful in one of these dimensions or a combination of them, which results in different needs and priorities regarding alliances. Second, following prior work in this area, this study combines firm-level and dyadic-level explanations to ad-dress the important heterogeneity behind alliance formation (Wang and Zajac, 2007). The empirical results support this conjecture, indicating that there are both selection and inter-dependence issues which need to be accounted for upon examining the formation of alliances. Third, different from most other studies in this area that focus on a single dyadic aspect, this paper distinguishes between product and technological similarities of prospective partners and their implication for exploitation and exploration. My results suggest that the relative position in the product space is more important for exploitation, while technological simi-larity is crucial for exploration. Finally, this study is set in the context of a global, mature, and low-tech industry (tires) that usually gets bypassed by the alliance and innovation lit-erature. While the aggregate R&D intensity of the industry justifies its ”medium low-tech” label, technology has always played a significant role in the tire domain and it is actively pursued by the industry’s leaders, which makes it a prime and interesting background for testing these theoretical conjectures.
Furthermore, these results emphasize different effects of the hypothesized variables on the propensity to engage in alliances based on the type of technological exchanges observed. I find that corporate diversifiers (across industries) tend to engage more in technological alliances either as partners (exploration) or as providers (exploitation). This finding is in line with both Teece’s (2007) dynamic capability theory and the diversification strategy
literature (Granstrand, 2000), indicating that through corporate diversification firms acquire new knowledge on potential avenues to capitalize their technological assets. Moreover, the recent surge in inter-firm agreements worldwide suggests that such advantages in terms of exploitation of technological capabilities have become increasingly important for firms in today’s competitive and global environment (Makino and Delios, 1996). Furthermore, the role of technological diversification in formation of exploration alliances is a positive and robust one, supporting prior findings in the literature (Giuri et al, 2004; Gambardella et al., 2007). Thus, exploration in technological alliances relies heavily on partners with large and diversified portfolios as it increases the avenues for learning and collaboration. These findings reinforce the idea that technological diversity may induce more exploration alliances, as it mitigates core rigidities and path dependencies existing in firms by proposing novel solutions that accelerate the rate of innovation (Quintana-Garcia and Benavides-Velasco, 2008). In contrast, technological diversification appears to attract firms also in exploitative interactions, as an avenue for immediate efficiency and profitability improvements (March, 1991). On one hand, greater technological diversity yields more opportunities for firms to cash-in their assets as providers of technologies, while the lack of it limits one’s options at only acting as a recipient of technology in such exploitative interactions (Narula and Sadowski, 2002).
In addition to the effects of diversification profiles, alliance formation decisions are also impacted by dyadic characteristics of firms (Wang and Zajac, 2007). Product similarity is consistently associated with higher probability of setting up exploitation alliances, as firms that share the same product space are more likely to find ways to capitalize (i.e., by providing technology in exchange for non-technological assets or competences) or employ technological assets (i.e., to better achieve firm’s objectives in terms of production methods, materials, profitability, etc.). Moreover, this relationship is linear, implying that firms seek partners from similar product areas to exploit/employ complementary technological assets or com-petences (Mowery et al., 1996). In contrast, product similarity does not affect significantly exploration endeavors, as these alliances appear to be driven entirely by technological features of prospective alliance partners (Rothaermel and Boeker, 2007). As such, large technological distances discourage exploration alliances, as partners must meet a threshold of technological endowments and achieve a certain overlap to start a productive technological collaboration. However, as this overlap increases, the benefits from mutual learning and cross-feeding are greatly reduced, suggesting a non-linear negative relationship between technological distance of partners and their propensity to form an exploration alliance (Sampson, 2007; Yang et al., 2010).
terms of partner size, age, knowledge, production base and diversification levels) in exploita-tion alliances. The only excepexploita-tion, and a robust one, is given by the strong positive impact of product similarity of two firms on their propensity to engage in exploitative agreements. Moreover, these results are consistent with the application of ”exploration-exploitation” paradigm to alliance formation (Lavie and Roesenkopf, 2006). Organizational inertia, either as market position or technological commitments, results in strong preferences for incumbents towards exploitation of existing assets (Rothaermel, 2001). Oppositely, partner similarity
along all dimensions (age, size, technological portfolio, production portfolio, diversification strategies), except technological assets, is a strong driver of exploration alliances that involve bilateral technology exchanges and mutual learning (Sampson, 2007). Given the significant dispersion in terms of innovation and R&D efforts between large and small firms in the tire industry (Acs and Audretsch, 1987), seeking strong technological partners is not surprising (Bayona et al., 2001)16. Firms that engage partners in R&D activities will pursue knowledge
sharing and development of new technologies and products (Rothaermel, 2001), while those who seek to exploit their technological assets will opt for more hierarchical agreements with unidirectional flows of technologies to their partners in exchange for access to production facilities, marketing or supply agreements, and other non-technological benefits (Rothaermel and Deeds, 2004).
In terms of managerial implications, my results suggest that technology exploration and exploitation via alliances presents firms with both opportunities and challenges. Well-diversified enterprises that are able to harness new knowledge across different markets will have greater appeal and opportunities for more alliances. Likewise, diverse technological portfolios will present greater opportunities for exploration and trigger subsequently supe-rior economic performance (Sampson, 2007). Therefore, firms should invest strategically in achieving greater diversification across markets and technologies, as these actions will sub-sequently present firms with more external opportunities for exploration and exploitation. Moreover, the characteristics of prospective partners are indicative of the type of alliance preferred. Dyadic similarities in terms of products provide the necessary absorptive capa-bility and channels for communication of technological content, thus favoring exploitative interactions. In turn, firms seeking to learn and develop new technologies via exploration alliances should focus on similar partners with sizable, yet different technological portfolios from their own.
The present study has, of course, several shortcomings that may serve as premises for subsequent work in this area. First, despite its global reach and longitudinal dimension, this
16
analysis is confined to a single industry which is characterized by a lower number of techno-logical actors, as compared to a younger, tech-intensive and atomistic industry populated by many R&D intensive firms (e.g., semiconductors). Inherently, this affects the richness and structure of alliance data, so that it is likely to have more exploration in high-tech indus-tries than otherwise. Second, this work focuses exclusively on the within-industry dimension of technological alliances, dictated by the link between our diversification measures, which are all relative to the tire industry. Future extensions of this work could adopt different measures of diversification (e.g., international) and also examine the intra-industry alliances of tire producers to shed light on the links between vertical integration strategies and firm diversification profiles. Such additions may provide a complete and perhaps different picture of alliance activities for tire producers, as they vary or balance their exploration-exploitation strategies across contingent industries and countries. Finally, the issues pertaining to data availability and accuracy are important, especially in the case of firms from developing na-tions in the 1980s. These problems were addressed where possible through backward revisions of data as new and more reliable statistics were published in the European Rubber Journal17.
In conclusion, this study provides some interesting insights on the interplay between firm diversification, dyadic characteristics and the formation of alliances in the context of a mature, low-tech sector. Further inquiries are needed to gain a better understanding of the motivation and outcomes of such inter-firm connections, and how they possibly differ from the ”mainstream” conclusions derived from high-tech industries. Such extensions could include comparative studies on other low or medium-tech industries, careful documentation of the alliance terms, and complete tracking of historical collaborations between firms. Some of these mature industries still exhibit a high technological turnover among the leading companies, but most importantly, represent the backbone of all economies in the world. Thus, understanding the motivation and benefits of such interactions may yield important policy lessons for both developed and developing nations in which mature industries are still responsible for a large share of GDP and employment.
17