This is a repository copy of Structure of some CoCrFeNi and CoCrFeNiPd multicomponent HEA alloys by diffraction techniques.
White Rose Research Online URL for this paper: http://eprints.whiterose.ac.uk/108947/
Version: Accepted Version
Article:
Dahlborg, U., Cornide, J., Calvo-Dahlborg, M. et al. (5 more authors) (2016) Structure of some CoCrFeNi and CoCrFeNiPd multicomponent HEA alloys by diffraction techniques. Journal of Alloys and Compounds, 681. pp. 330-341. ISSN 0925-8388
https://doi.org/10.1016/j.jallcom.2016.04.248
Article available under the terms of the CC-BY-NC-ND licence (https://creativecommons.org/licenses/by-nc-nd/4.0/)
[email protected] https://eprints.whiterose.ac.uk/
Reuse
This article is distributed under the terms of the Creative Commons Attribution-NonCommercial-NoDerivs (CC BY-NC-ND) licence. This licence only allows you to download this work and share it with others as long as you credit the authors, but you can’t change the article in any way or use it commercially. More
information and the full terms of the licence here: https://creativecommons.org/licenses/ Takedown
If you consider content in White Rose Research Online to be in breach of UK law, please notify us by
1
Structure of some
CoCrFeNi
and
CoCrFeNiPd
multicomponent HEA alloys by diffraction techniques
U. Dahlborg1, J. Cornide1, M. Calvo-Dahlborg1,*, T.C. Hansen2, A. Fitch3, Z. Leong4, S. Chambreland1, R. Goodall4
1
GPM-UMR6634-CNRS, University of Rouen, Campus Madrillet, BP12, 76801
Saint-Etienne-du-Rouvray, France
2
Institut Laue-Langevin, 71 Avenue des Martyrs, CS 20156, 38042 Grenoble Cedex 9, France
3
ESRF, 71 Avenue des Martyrs, CS40220, 38043 Grenoble Cedex 9, France
4
Department of Materials Science & Engineering, The University of Sheffield, Mappin Street,
Sheffield S1 3JD, UK
*Corresponding author: M. Calvo-Dahlborg email: [email protected] *Manuscript
2
Abstract
The structure of CoCrFeyNi (y=0, 0.8 and 1.2) and CoCrFeNi-Pdx (x= 0.0, 0.5, 0.8, 1.0, 1.2 and
1.5) High Entropy Alloys has been investigated by neutron and standard X-ray as well as by
high-energy X-ray diffraction techniques. The alloys were produced by arc melting and
afterwards heat treated under several different conditions. It has been concluded that the
CoCrFeNi alloy in as-cast condition is, contrary to what is claimed in the literature, not
single-phase but consists of at least two different single-phases, both of fcc type. The difference in lattice
constant between the two phases is close to 0.001Å. Diffraction patterns measured by X-ray and
neutron diffraction have shown that the structure of the alloy is not affected by 3 hours heat
treatment up to 1100°C. Changing the amount of Fe has no drastic effect on alloy structure. The
Pd-containing alloys have also all been found not to be single-phase but to consist of at least four
different phases, all being of fcc type. The lattice constants for all phases increase with Pd
content. The relative amounts of the different phases depend on Pd concentration. Furthermore,
heat treatments of three hours duration at different temperatures have a significant effect on the
alloy phase composition. It is suggested that HEAs should be considered as multicomponent
alloys presenting “simple” diffraction patterns, e.g. consisting of one or several lattices of fcc, hcp or bcc type with very close lattice parameters.
3
1. Introduction
Multicomponent metallic alloys of the type usually called High Entropy Alloys (HEAs) have
recently raised considerable attention because of their attractive physical properties [1-6] such as
high hardness, outstanding wear resistance, good high-temperature strength and thermal stability.
A HEA was originally defined as an alloy consisting of 5 or more components of relative
compositions in the range 5 to 35 at.% forming single and simple close-packed crystalline
structures of solid solution type [7]. However, there are very few, if any, HEAs that are truly
single phase. Many of the alloys taken to meet the current definition of a HEA alloy are in reality
multiphase with in most cases one main phase and one or several minor phases [8,9]. Thus, the
original definition of a HEA has to be reconsidered and several approaches to this have been
made (see for example [10,11]). From the literature and the authors’ own experience HEAs should be considered as multicomponent alloys presenting “simple” diffraction patterns, e.g. consisting of one or several lattices of fcc or bcc type with very close lattice parameters. The
alloys that are discussed below correspond to this definition and will irrespective of their actual
compositions, be denoted as HEAs.
Numerous publications have been devoted to finding rules by which it is possible to predict
whether an alloy of a certain composition forms a HEA upon solidification. Suggested models
based on semi-empirical approaches have considered both electronic quantities such as the
elemental electronegativities, concentrations of valence electrons and the itinerant electron
concentrations d-orbital energy levels and also thermodynamic ones such as the enthalpy and the
entropy of mixing of the binaries that can be formed by the elements [12-21]. The parameters
have been combined with the atomic size mismatch of the elements in order to predict if an alloy
is of HEA type via statistical methods [22-25 and references therein]. Furthermore, CALPHAD
[5, 10, 26-28], DFT and ab initio [29-31]calculations have been used for the same purpose. The
main difficulty met for the validation of models and calculations is that measured structures and
microstructures and also physical properties published in the literature show a considerable
spread. This circumstance suggests that the alloys in many cases have not been adequately
characterized in terms of possible small contents of intermetallic phases and grain size
4
resolve this situation it is obviously necessary to use different complementary experimental
techniques covering a length scale from a tenth of a nanometer to several microns.
One well reported family of HEAs is based on the four component CoCrFeNi (below denoted
CCFN) alloy to which has been added one, two or three elements in different proportions, either
separately or in combination, including Al, Cu, Mn, Ti, Pd, Sn, Ru, W, etc. Many different
techniques have been used to characterize the structures of the resulting alloys, as well as their
physical properties. Nevertheless, the understanding of why some of these alloys form simple
close-packed structures and some additional intermetallic phases is still lacking. Also the
mechanism behind the composition-property relationships is largely unclear.
The base CCFN alloy, even though it contains only four elements, presents the characteristics of
a HEA as its diffraction pattern is apparently very simple. It has been extensively studied during
the last ten years and has been reported to be single-phase and a true solid solution [6, 13,
32-34]. However, recently it was reported that CCFN alloys homogenized for a long time at high
temperature are not single-phase but a coherent mixture of two solid solutions [6]. This conforms
to the present study as well as to the earlier findings in [9, 35, 36] where composition
fluctuations as well as fluctuations in the lattice constants as a function of position were reported
in an as-cast CCFN ingot produced by arc melting and subsequent casting.
One alloy composition in the CCFN family that has been subject of limited interest is CCFN-Pd,
probably because of the high cost of Pd. The structure and some physical properties have been
reported in [37, 38] and it was found to be single-phase with some interesting magnetic
properties. However, later work showed undoubtedly that it was at least dual-phase with a
structure clearly depending on the Pd content [35, 36].
The work presented below has been performed within the AccMet European project and it is
aiming at giving detailed information on the structure of the CCFyN alloys with different Fe contents and on the CCFN-Pdx alloys with different Pd contents by using high energy and
standard X-ray as well as neutron diffraction techniques. Other papers will deal with alloy
microstructure as well as with physical and magnetic properties of alloys with similar
5
2. Experimental details
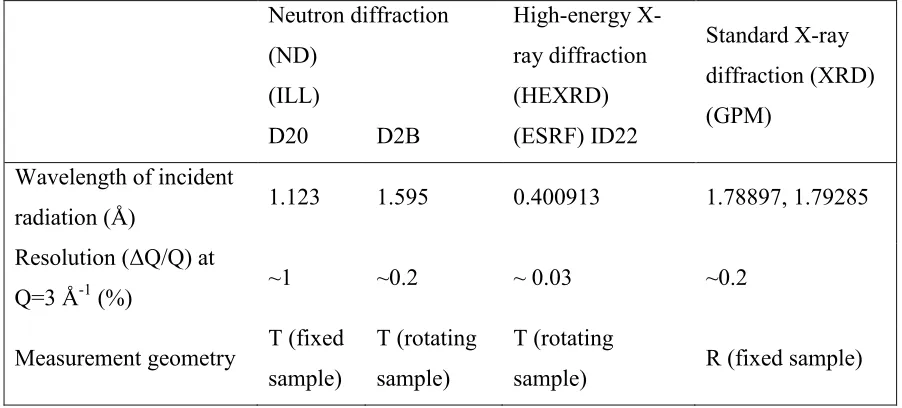
Three different experimental diffraction techniques were used. Neutron diffraction (ND)
measurements were performed on the D20 and D2B diffractometers at Institut Laue-Langevin
(ILL), Grenoble (France), high-energy X-ray diffraction (HEXRD) measurements on the ID22
diffractometer at the European Synchrotron Research Facility (ESRF), Grenoble (France) and
standard X-ray diffraction (XRD) with a Cobalt source at GPM, University of Rouen, France.
Relevant characteristic features of the different measurements are given in table 1. All
measurements were performed at ambient temperature. As all samples were found to have a
pronounced texture they were rotated during the measurements, whenever possible. However, it
has to be strongly emphasized that this does not completely eliminate texture effects in the
recorded diffraction patterns. The penetration depth of the standard X-rays into the alloys is of
the order of 1 µm and the measurements by XRD thus give information of the structure only in a
surface layer while both the ND and the HEXRD techniques yield structural information valid
for the entire irradiated volume. Only a few of the ND measurements were performed on the
D2B diffractometer and will be denoted ND(D2B) below, whenever referred to. Likewise, only
one XRD measurement was performed with a Molybdenum source and it is denoted XRD(Mo),
whenever referred to.
Ingots of CoCrFeyNi (y=0.8, 1.0 and 1.2) and CoCrFeNi-Pdx (x= 0.0, 0.5, 0.8, 1.0, 1.2,
1.5) alloys (in the following denoted CCFyN and CCFN-Pdx, respectively) were prepared by arc melting from pure elements, each with purity higher than 99.9 wt.%, under a Ti-gettered
high-purity argon atmosphere.The nominal alloy compositions are given in table 2. In order for the
alloy production to be similar to most earlier studies on HEAs, the ingots were flipped and
remelted several times in order to achieve melt homogeneity. It should though be noted that it
has been shown in numerous works that this procedure does not ensure that the alloy melt is
homogeneous [41, 42]. However, this procedure was adopted in order to avoid any ambiguity
when comparing our results to those presented in the literature. Cylindrical rods with a diameter
of 3 mm were subsequently prepared by suction casting the mixed alloy into a water-cooled
copper mold. Four thin slices were cut from the rod and placed side by side in order to achieve a
good statistical accuracy in the XRD measurements. In order to investigate their thermal stability
6
2). The heat treatments all lasted three hours at three different temperatures, 1100°C (T1), 700°C
(T3) and 400°C (T2). T0 is the designation used for the as-cast condition in which the samples
were allowed to cool in the Cu mold. The heat treated alloys were either allowed to cool in the
furnace (s) or dropped into ice-water (q). All subsequent measurements were performed at
ambient temperature.
3. Results and discussion
3.1 Results on the CCyFN alloys (y=0.8, 1.0, 1.2)
3.1.1 The structure of the CCFyN alloy in as-cast condition (T0)
Diffraction patterns measured by the three different techniques on the CCFyN (y=1.0) alloy in as-cast condition (T0) are shown in fig. 1a. A first visual inspection of the ND and XRD patterns
shows identical results and would suggest that the structure is single-phase of fcc typebut on the
other hand the peak shapes suggest a pronouced lattice disorder. Furthermore, no broadening of
the peaks is visible in the XRD(Mo) (top curve) and the ND (2nd middle curve) patterns while in the XRD (1st middle curve) a slight symmetric broadening was observed. The effect of the different resolutions is obvious in the enlarged plot (Fig. 1b) of the (220) fcc peak. No additional
phase can be detected in the alloy from the ND and XRD measurements. The asymmetry of the
(220) peak in the ND measurement does indicate the presence of a distinct texture in the sample,
visible due to the fact that the sample was, because of experimental conditions, kept in a fixed
position during the measurements. It should however be mentioned that a peak asymmetry was
seen with rotating sample on the D2B diffractometer from the same ingot. It was also found in
[36] that the lattice constants derived from XRD patterns recorded from different positions in the
same ingot varied slightly which was suggested to be due to the presence of a minority phase
also of fcc structurebut also demonstrates the pronounced texture of the CCFN alloy.
A finer structure investigation of the CCFN alloy was performed by HEXRD. The resolution in
the HEXRD measurements (see table 1) is about an order of magnitude superior to the ones of
the ND and XRD techniques. Thus, the ambiguity in the interpretation of the measured ND and
XRD diffraction patterns could be resolved. A shape analysis of all HEXRD peaks showed that
all could be decomposed into two symmetric intensity components. Several different peak shapes
7
examples of such a breakdown of the peaks with the (hkl) Miller indices equal to (220) and (333,
511) into two components are shown in figs 2a and 2b respectively. The presence of inflection
points in all measured peaks shows that the results are reliable and it definitely demonstrates that
the alloy is not single-phase. Assuming an fcc structure, the lattice constants calculated from the
two components of the first thirteen diffraction peaks are shown as function of (h2+k2+l2) in fig. 2c. The presence of two fcc structures with slightly different lattice constants in CCFN is
obvious. It can be noted that the lattice constants derived from the (200) and the (400) peaks are
significantly above the average value suggesting a definite distortion of the cubic fcc structure.
Such a distortion is also suggested from the variation of both peak intensities and peak widths.
Unfortunately the (600) and (800) diffraction peaks do not fall within the measured angular
range and thus this hypothesis can not be quantified. However, a detailed analysis of these
observations is discussed in relation with simulations in a parallel paper [39]. At the present
stage it is only concluded that there are clear indications that none of the two fcc lattices are true
solid solutions.
In order to investigate the effect of the alloy composition on the structure further, ND and XRD
measurements were performed on two CCFyN (y=0.8, 1.2) alloys in as-cast conditions. The
diffraction patterns for all CCFN alloys as measured by ND displayed in fig. 3a are all of fcc
type and they do not show within the experimental resolution any dependence of the lattice
constant on Fe content. However, both non-equimolar alloys seem to contain some small
additional peaks (see for example the enlarged (111) peaks in fig. 3b) that however are not
numerous enough to be indexed. In HEXRD measurements on the CCFe1.2N alloy, on the other
hand, all diffraction peaks are asymmetric and could be decomposed into two components in the
same way as was the case for the equimolar alloy. Table 3 presents the lattice constants
determined for all the CCFyN compositions by the three diffraction techniques used in this work. In all cases they have been determined from the diffraction peak positions and the estimated
uncertainty due to peak anisotropies are included in the given errors. The two lattice constants
derived from HEXRD data for y=1.2 are slightly larger than the ones for CCFN and the
difference between the two is twice as large. The extra Fe atoms have obviously promoted a
more pronounced phase separation in the CCFN alloy possibly originating from increased
8
3.1.2 Effect of heat treatments on the structure of CCFyN
In order to study their phase stability some of the as-cast CCFN alloys were subjected to
different kinds of heat treatments (see table 2). The temperature values have been chosen after
calorimetric investigation of the alloys. In all cases the main structure as determined from ND
and XRD patterns remained generally unchanged. However, some small additional diffraction
peaks (the most intense ones at ~2.5 and ~4.5 Å-1) were observed in some measured patterns (fig. 4a). However, their intensity and their number are though too small to facilitate conclusive phase
identification. Some clear effects on the diffraction patterns by the heat treatments can be clearly
seen in the left part of fig. 4b.Both after T1(s) and T3(q) the lattice constant is somewhat smaller
than in the as-cast one (T0) and after T1(q) treatment. The decrease might be affected by a
change in alloy texture due to the heat treatment but as the same effect was observed in the
CCFyN (y=0.8, 1.2) alloys it seems to be real. The lattice constant decreases from 3.572Å for
as-cast CCFN to 3.566Å for the same alloy ingot after T1(s) treatment. The difference is within the
experimental error the same for the three investigated CCFyN alloys. This finding clearly proves the importance of considering the production technique as well as the subsequent
annealing/homogenizing treatments when comparing structural and thus also physical properties
of alloys nominally of the same composition. As mentioned above the difference in the thermal
history of the samples can certainly in a part explain the discrepancy range in lattice constants
found in the literature for the CCFN alloy. It was furthermore found that all alloy heat treatments
resulted in a narrowing of the diffraction peaks and after annealing their widths were given by
the experimental resolution in the ND and XRD diffraction measurements. It should though be
mentioned that no CCFN alloy was investigated with HEXRD with its about 10-fold better
resolution after annealing and thus nothing can be said whether its phase composition has
changed.
3.1.3•Discussion•of•results•on•CCFyN•alloys•
From the HEXRD results it is concluded that the CCFN in as-cast condition is, contrary to earlier
works in the literature, two-phase [6,9 and references therein]. The two lattice constants are
shown in table 3 together with the ones derived from XRD and ND measurements. The
9
account, is very good. It is to be noted that, considering only the XRD and ND techniques, the
results would suggest that, in accordance with most earlier works in the literature, the alloy
appears to be single fcc phase and to form a perfect solid solution. However, the higher
resolution HEXRD results are totally excluding this possibility. Furthermore, if carefully
observed, results from other works also suggest the non solid solution as well as the non single
phase state, although this was not concluded by the authors of these studies. Thus, for example,
the XRD diffraction peaks shown in [34] for a CCFN alloy are clearly asymmetric in a way
which might indicate the presence of two fcc phases, contrary to the interpretation given.
Additional intermetallic phases have also been clearly observed in some cases. In as-cast and
annealed CCFN alloys a minority Cr-rich phase slightly depleted in Co has for example been
found to exist in the grain-boundaries [13, 15]. A precipitation of Cr has also been found in ab
initio modelling [31]. Furthermore, an alloy produced by mechanical alloying has even been
found to contain a minority bcc phase [43]. It can thus be concluded that not only details of the
production process but also the production technique itself plays an important role in the phase
composition of the alloy. Furthermore, lattice constants, spanning a range from 3.55 to 3.59Å,
reported in the literature were in many cases determined from very few measured XRD
diffraction peaks. It is also important to note that XRD is a surface sensitive technique as the
penetration depth is only of the order of microns. Moreover, the amount of a particular phase it is
possible to detect with a certain technique is dependant on the resolution.
Recently by TEM investigations on CCFN samples that were homogenized at 1300°C (about 120
degrees below the melting point) for 1 week an onset of phase decomposition was detected [6].
The phases were found to have fcc structure and very similar unit-cell dimensions. This
observation may be correlated with the HEXRD results presented above.
XRD and positron annihilation measurements on CCFN buttons produced by arc melting were
reported [33]. The lattice constant was derived to 3.578 Å which is to be compared to 3.5720 Å
obtained from the HEXRD measurements in the present study. It was furthermore found to
decrease with annealing temperature due to a suggested defect recovery during heating. From the
XRD measurements the authors concluded that the alloy was single phase and that it remained
10
with the XRD results presented above. However, none of the CCFyN alloys investigated in the
present study are single phase although having “simple” diffraction patterns”. They obviously consist of two fcc phases with close lattice parameters but the alloys appear as single phase when
analyzed with lower resolution diffraction techniques (see table 1). The difference in absolute
value of the derived lattice constants in the literature is due to different production techniques as
well as to experimental resolution effects [36].
3.2 Results and discussion on CCFN-Pdx alloys
3.2.1•The•structure•of•CCFN-Pdx•alloys•in•as-cast•condition•
Examples of measured diffraction patterns from CCFN-Pdx alloys with different Pd content in as-cast conditions from XRD, HEXRD and ND are shown in fig. 5. Measured pattern for the
CCFN alloy is also shown for comparative reasons. It can immediately be noted that in all cases
the main structure is of fcc type and that the unit cell increases in size with increasing Pd content
[9, 35, 36]. The diffraction peak intensities vary with scattering angle in all sets of measurements
in a way indicating a pronounced texture in the samples. However, it was also noted in [9, 36]
that all peaks are asymmetric and can be divided into components suggesting the existence of
several coexisting phases in the alloys. The suggestion is fully confirmed by the HEXRD
measurements in which the experimental resolution is of the order of 10-4. Furthermore, fig. 6a presents the (111) diffraction peaks measured from the CCFN and CCFN-Pdx (x=0.5, 1.0, 1.5)
alloys. One peak component is sharp, resembling but somewhat wider and displaced relative to
the corresponding diffraction peak in the pure CCFN alloy. One of the phase compositions
identified by atom probe tomography and by microscopy in CCFN-Pd alloys is as a matter fact
CoCrFeNi-rich [40]. The other peak component is considerably more displaced and it is
furthermore significantly broader and asymmetric. A numerical examination based on the
number of inflection points found in the differentiated peak profiles shows that all corresponding
peak components can be separated into two subpeaks. Several different peak profiles were tried
for this separation and all gave very closely identical results for the positions of the two
subpeaks. An example of peak intensity separations assuming Gaussian shapes of the subpeaks is
shown in fig. 6b. As the shape of all sharp intensity components is similar to the diffraction
peaks measured for pure CCFN, it was assumed in the evaluation that the asymmetry of the
11
contrary to what was the case for the CCFN alloy as discussed above no decomposition into
subpeaks is performed due to the absence of inflection points in the differentiated peak profiles.
The lack of knowledge of exact peak shapes might make the fitting procedure non unique but it
is beyond doubt that all CCFN-Pdxalloys in the composition range 0.5≤x≤1.5 consist of at least three phases, and considering the asymmetry of the sharpest intensity component maybe even of
at least four phases. This is in full accordance with APT and EDX analyses on the same samples
from which it was concluded that the alloys contain four different phases [40]. In order to
determine accurately the lattice constants of the different phases the values calculated from the
positions of twelve diffractions peaks for the CCFN-Pdx (x=0.5, 1.0, 1.5) alloys in as-cast conditions and measured by HEXRD are plotted as function (h2+k2+l2) in fig. 7. The difference between x=0.5 and 1.0 on one side and x=1.5 on the other side is strong indicating the large
distortion of the original CCFN lattice with significant amount of included Pd atoms. The
constant values for all x values on fig. 7 unambiguously show the fcc nature of the three peaks
and it also yields strong support for peak analysis procedure. In the ND and the XRD
measurements the experimental resolution made it possible convincingly to separate the
measured peaks only into two components. Thus, the second component is to be considered as
being a convolution of peaks 2 and 3 in the HEXRD measurements The ND and XRD results are
though fully compatible and those obtained from alloys in as-cast conditions are collected in
table 4. They are also displayed as a function of x in fig. 8 and compared to values from [37].
However, the results obtained from XRD give somewhat different lattice constants, very
probably both due to texture effects and to surface layer effects as was earlier observed [9, 35,
36]. The difference illustrates the difficulty to derive accurate lattice constants for an alloy being
multi-phase, having small differences in lattice cell parameters. The values shown in table 4 are
in some cases slightly different from the values given in [36] which is due to a refined analysis
procedure.
It can be observed from fig. 6a that the relative amounts of the different phases that corresponds
to the different peaks present in the alloys vary with Pd concentration. This is illustrated in fig. 9
that shows the average of the intensity ratios peak2/peak1 and peak3/peak1 as a function of the
12
composition. From microscopy investigation [40], the equimolar composition, x=1, is the one
with the most distinct dendritic pattern. From the width of the peak in fig. 6b it can also be
concluded that it has the smallest grain size. A similar variation of the ratios is also seen in the
decomposition of the diffraction peaks measured by ND and XRD and the agreement between
the different sets of data is very good. It can be concluded that the relative amounts of the
different phases vary with Pd content. As the atomic compositions of the different phases are not
known a full refinement will not give some relevant new information in this respect. Further
discussion on the phase compositions are given in [40].
3.2.2 Effect of heat treatments on the structure of CCFN-Pd
Measured ND patterns for x=0.8, 1.0, and 1.2 after different heat treatments (see table 2) are
shown in fig. 10. All patterns show that the main phase is fcc for all compositions and after the
heat treatments. The pattern for the CCFN-Pd1.0 alloy after annealing at 700°C (T3) is
significantly different showing that at least one additional phase has grown in the alloy during
annealing. Refinement suggests that one of these additional phases might be monoclinic. This is
a slightly distorted cubic phase and can thus be considered as a metastable intermediate phase
forming during the T3 annealing. The microstructure after T3 is still dendritic while it has
disappeared after T1 [40]. The cell volume of this monoclinic phase happens to be almost exactly
the same as the main fcc phase. However, the refinement is not fully conclusive as at least one
diffraction peak in the measured pattern is not indexed. Accordingly one can conclude that an
annealing of the equimolar CCFN- Pd1.0 alloy at 700°C for three hours causes the alloy to
decompose into at least four intermetallic phases. This conclusion is very important as 700°C is
the expected temperature of use for many potential applications of High Entropy Alloys.
It can furthermore be observed that for all the alloys studied the heat treatment at 1100°C (T1)
resulted in a narrowing of all diffraction peaks as compared to the as-cast alloys. Moreover, their
two-component nature disappeared almost completely within the resolution in both the ND and
XRD measurements. This is exemplified in fig. 11 where the (311) and the (222) peaks for the
CCFN-Pd0.8 alloy measured by ND are shown. The same behavior was observed also for the CCFN-Pd and CCFN-Pd1.2 alloys. The position of the fcc peaks after T1 is very close to the average position of the two peak components measured in as-cast condition. The measured peaks
are though still slightly asymmetric indicating either a two-phase nature or a strained lattice but
13
equimolar alloy the alloy that was annealed at 1100°C and ice-water cooled was again annealed
at 700°C, thus T1+T3. Fig. 12 shows the measured XRD patterns compared to the ones
measured in as-cast condition after all sample heat treatments. Comparing with the patterns
shown in fig. 10 it is seen that the alloy structure after the second annealing is completely
different. The main fcc diffraction peaks are still the most intense and their positions compare
exactly with the ones measured from the as-cast alloy, i.e. corresponding to a lattice constant of
3.660 Å. However, on each side of these two well resolved peaks can now be seen, the positions
of which can be refined to correspond to two fcc structures, one with a=3.615Å and one with a=
3.743Å. The small lattice constant does not correspond to any binary compound of the alloy
containing elements while the largest one closely corresponds to the CoPd alloy, 3.75Å. The
calculated lattice constant for the ordered FeCrNi alloy has been found to 3.562Å [44] in fair
agreement with the a=3.615Å value given above [39]. The T1+T3 pattern also shows some faint
indications of further diffraction peaks but these are too few to be used for a structure
identification. The patterns presented in fig. 10 to 12 unequivocally show that the phase content
of the CCFNPd alloy after heat treatment T1 is different from the phase content in as-cast
condition (T0) and that the detailed structural evolvement during subsequent heatings from T0
and from T1 is significantly different. This fact has a pronounced influence of the physical
properties [39,40].
4. Conclusions
It was concluded from the diffraction patterns measured with the highest experimental
resolution, i.e. by high-energy X-rays, that the CoCrFeyNi (y=0.8 and 1.2) alloy in as-cast
condition is, contrary what is claimed in the literature, not single-phase but consists of at least
two different phases both of fcc type. The difference in lattice constant between the two phases is
close to 0.001Å. Diffraction patterns measured by X-ray and neutron diffraction have shown that
the structure of the alloy is not obviously affected by 3 hours heat treatments up to 1100°C.
Changing the amount of Fe has no drastic effect on alloy structure.
The structure of the high-entropy CoCrFeNi-Pdx (x= 0.0, 0.5, 0.8, 1.0, 1.2, 1.5) alloys in as-cast
conditions and after heat treatments has been characterized by using three different kinds of
14
have experimental resolutions varying from about 0.03 to about 1%. All Pd containing alloys
have been found to consist of at least four different phases, all being of fcc type. The lattice
constants for all phases increase with Pd content which indicates that Pd atoms have been
incorporated in the CoCrFeNi lattice. The relative amounts of the different phases are found to
depend on Pd concentration. Heat treatments during three hours at different temperatures have a
significant effect on the alloy phase composition.
Accordingly and contrary to the standard definition found in the literature, the CoCrFeyNi-Pdx
HEAs investigated in the present study are not single phase but have “simple” diffraction pattern,
e.g. one or several fcc-type, bcc-type, or hcp-type of close lattice distances. Thus a more
15
References
1. Y. Zhang, T.T. Zuo, Z. Tang, M.C. Gao, K.A. Dahmen, P.K. Liaw, Z.P.Lu, Microstructures
and properties of high-entropy alloys, Prog. Mater. Sci. 61 (2014) 1-93.
2. M.-H. Tsai, J.-W. Yeh, High-entropy alloys: A critical review, Mater. Res. Lett. 2 (2014)
107-123.
3. B. Cantor, I.T.H. Chang, P. Knight, A.J.B. Vincent, Microstructural development in
equiatomic multicomponent alloys, Mater. Sci. Eng. A 375-377 (2004) 213-218.
4. B. Cantor, Multicomponent and high entropy alloys, Entropy 16 (2014) 4749-4768.
5. O.N. Senkov, J.D. Miller, D.B. Miracle, C. Woodward, Accelerated exploration of
multi-principal element alloys for structural applications, CALPHAD 50 (2015) 32-48.
6. R. Kozak, A. Sologubenko, W. Steurer, Single-phase high-entropy alloys – an overview, Z. Kristallogr. 230 (2015) 55-68.
7. J.-W. Yeh, S.-K. Chen, S.-J. Lin, J.-Y. Gan, T.-S. Chin, T.-T. Shun, C.-H. Tsau, S.-Y. Chang,
Nanostructured high-entropy alloys with multiple principal elements: Novel alloy design
concepts and outcomes, Adv. Eng. Mater. 6 (2004) 299-303.
8. L.J. Santodonato, Y. Zhang, M. Feygenson, C.M. Parish, M.C. Gao, R.J. Weber, J.C.
Neuefeind, Z. Tang, P.K. Liaw, Deviation from high-entropy configurations in the atomic
distributions of a multi-principal-element alloy, Nature Com. 6 (2015) 5964.
9. J. Cornide, U. Dahlborg, Z. Leong, L. Asensio Dominguez, J. Juraszek, S. Jouen, T. Hansen,
R. Wunderlich, S. Chambreland, I. Todd, R. Goodall, M. Calvo-Dahlborg, Structure and
properties of some CoCrFeNi-based high Entropy alloys, The Minerals, Metals & Materials
Society 2015, TMS2015, Supplemental Proceedings, John Wiley & Sons, Inc., Hoboken, NJ,
USA. DOI: 10.1002/9781119093466.ch139.
10. D.B. Miracle, J.D. Miller, O.N. Senkov, C. Woodward, M.D. Uchic, J. Tiley, Exploration
and development of high entropy alloys for structural applications, Entropy 16 (2014) 494-525.
11. Z.P. Lu, H. Wang, M.W. Chen, I. Baker, J.W. Yeh, C.T. Liu, T.G. Nieh, An assessment on
the future development of high-entropy alloys: Summary from a recent workshop, Intermetallics
66 (2015) 67-76.
12. S. Guo 2013, C. Ng, J. Lu, C.T. Liu, Effect of valence electron concentration on stability of
16
13. S. Guo, C. Ng, Z.J. Wang, C.T. Liu, Solid solutioning in equiatomic alloys: Limit set by
topological instability, J. Alloys Comp. 583 (2014) 410-413.
14. F. Otto, Y. Yang, H. Bei, E.P. George, Relative effects of enthalpy and entropy on the phase
stability of equiatomic high-entropy alloys, Acta Mater. 61 (2013) 2628-2638.
15. A.K. Singh, A. Subramaniam, On the formation of disordered solid solutions in
multi-component alloys, J. Alloys Comp. 587 (2014) 113-119.
16. A.K. Singh, N. Kumar, A. Dwivedi, A. Subramaniam, A geometrical parameter for the
formation of disordered solid solutions in multi-component alloys, Intermetallics 53 (2014)
112-119.
17. M.G. Poletti, L. Battezzati, Electronic and thermodynamic criteria for the occurrence of high
entropy alloys in metallic systems, Acta Mater. 75 (2014) 297-306.
18. Y.F. Ye, Q. Wang, J. Lu, C.T. Liu, Y. Yang, Design of high entropy alloys: A
single-parameter thermodynamic rule, Scripta Mater. 104 (2015) 53-55.
19. Y.F. Ye, C.T. Liu, Y. Yang, A geometric model for intrinsic residual strain and phase
stability in high entropy alloys, Acta Mater, 94 (2015) 152-161.
20. Yiping Lu, Yong Dong, Li Jiang, Tongmin Wang, Tingju. Li, Yong Zhang, A criterion for
topological close-packed phase formation in high entropy alloys, Entropy 17 (2015) 2355-2366.
21. O.N. Senkov, D.B. Miracle, A new thermodynamic parameter to predict formation of solid
solution or intermetallic phases in high entropy alloys, J. Alloys Compd. 658 (2016) 603-607.
22. Zhijun Wang, Weifeng Qiu, Yong Yang, C.T. Liu, Atomic-size and lattice-distortion effects
in newly developed high-entropy alloys with multiple principal elements, Intermetallics 64
(2015) 63-69.
23. I. Toda-Caraballo, E.I. Galindo-Nava, P.E.J. Rivera-Diaz-del-Castillo, Unravelling the
materials genome: Symmetry relationships in alloy properties, J. Alloys Comp. 566 (2013) 217–
228.
24. I. Toda-Caraballo, J.S. Wrobel, S.I. Dudarev, D. Nguyen-Manh and P.E.J.
Rivera-Diaz-del-Castillo. Interatomic spacing distribution in multicomponent alloys, Acta Mater. 97 (2015)
156-169.
25. L. Asensio Dominguez, R. Goodall, I. Todd, Prediction and validation of quaternary high
17
26. R. Raghavan, K.C. Hari Kumar, B.S. Murty, Analysis of phase formation in
multi-component alloys, J. Alloys Comp. 544 (2012) 152-158.
27. M.C. Gao, D.E. Alman, Searching for next single-phase high-entropy alloy compositions,
Entropy 15 (2013) 4504-4519.
28. F. Zhang, C. Zhang, S.L. Chen, J. Zhu, W.S. Cao, U.R. Kattner, An understanding of high
entropy alloys from phase diagram calculations, CALPHAD 45 (2014) 1-10.
29. M.C. Troparevsky, J.R. Morris, P.R.C. Kent, A.R. Lupini, G.M. Stocks, Criteria for
predicting the formation of single-phase high-entropy alloys, Phys. Rev. X 5 (2015) 011041(6).
30. F. Tian, L.K. Varga, N. Chen, L. Delczeg, L. Vitos, Ab initio investigation of high-entropy
alloys of 3d elements, Phys. Rev. B 87 (2013) 075144(8).
31. S.C. Middleburgh, D.M. King, G.R. Lumpkin, M. Cortie, L. Edwards, Segregation and
migration of species in the CrCoFeNi high entropy alloy, J. Alloys Comp.599 (2014) 179-182.
32. Z. Wu, H. Bei, F. Otto, G.M. Pharr, E.P. George, Recovery, recrystallization, grain growth,
and phase stability of a family of FCC-structured multi-component equiatomic solid solution
alloys, Intermetallics 46 (2014) 131-140.
33. S. Abhaya, R. Rajaraman, S. Klavathi, G. Amarendra, Positron annihilation studies on
FeCrCoNi high entropy alloy, J. Alloys Comp. 620 (2015) 277-282.
34. M.S. Lucas, G.B. Wilks, L. Mauger, J.A. Munoz, O.N. Senkov, E. Michel, J. Horwath, S.L.
Semiatin, M.B. Stone, D.L. Abernathy, E. Karapetrova, Absence of long-range chemical
ordering in equimolar FeCoCrNi, Appl. Phys. Lett. 100 (2012) 251907(4).
35. J. Cornide, M. Calvo-Dahlborg, S. Chambreland, L. Asensio Dominguez, Z. Leong, U.
Dahlborg, A. Cunliffe, R. Goodall, I. Todd,Combined Atom Probe Tomography and TEM
investigations of CoCrFeNi, CoCrFeNi-Pdx (x=0.5, 1.0, 1.5) and CoCrFeNi-Sn, Acta Phys.
Polonica A 128 (2015) 557-560.
36. U. Dahlborg, J. Cornide, M. Calvo-Dahlborg, T.C. Hansen, Z. Leong, L. Asensio
Dominguez, S. Chambreland, A. Cunliffe, R. Goodall, I. Todd, Crystalline structures of some
High Entropy Alloys obtained by Neutron and X-ray diffraction, Acta. Phys. Polonica 128
(2015) 552-556.
37. M.S. Lucas, L. Mauger, J.A. Muňoz, Y. Xiao, A.O. Sheets, S.L. Semiatin, J. Horwath, Z.
Turgut, Magnetic and vibrational properties of high-entropy alloys, J. Appl. Phys. 109 (2011)
18
38. M.S. Lucas, D. Belyea, C. Bauer, N. Bryant, E. Michel, Z. Turgut, S.O. Leontsev, J.
Horwath, S.L. Semiatin, M.E. McHenry,C.W. Miller, Thermomagnetic analysis of FeCoCrxNi
alloys: Magnetic entropy of high-entropy alloys, J. Appl. Phys. 113 (2013) 17A923(3).
39. M. Calvo-Dahlborg, J. Cornide, D. Nguyen-Manh, J.S. Wróbel, J. Tobola, J. Juraszek, S.
Jouen, U. Dahlborg, Effect of Pd on structural and magnetic properties of CoCrFeyNi-Pdx alloys,
for x between 0 and 1.5 and y=0.8, 1.0 and 1.2, to be submitted.
40. Distribution of Pd atoms in CoCrFeNi-Pdx High Entropy Alloys, J. Cornide, G.D. Hatton,
M.Calvo-Dahlborg, Z. Leong, S. Chambreland, U. Dahlborg, A. Fones, R. Goodall, to be
submitted.
41. I.G. Brodova, P.S. Popel, G.I. Eskin, Liquid Metal Processing: Applications to Aluminium
Alloy Production, Advances in Metallic Alloys, J.N. Fridlyander, D.G. Eskin (Eds.), Taylor &
Francis, London, 2002.
42. P.S. Popel, M. Calvo-Dahlborg, U. Dahlborg, Metastable microheterogeneity of melts in
eutectic and monotectic systems and its influence on the solidified alloy, J. Non-Cryst. Solids
353 (2007) 3243-3253.
43. S. Praveen, B.S. Murty, R.S. Kottada, Alloying behavior in multi-component AlCoCrCuFe
and NiCoCrCuFe high entropy alloys, Mater. Sci. Eng. A 534 (2012) 83-89.
44. J.S. Wrobel, D. Ngyuen-Manh, M.Y. Lavrentiev, M. Muzyk, S.L. Dudarev, Phase stability of
19
Acknowledgement
The authors are thankful to Institute Laue-Langevin, Grenoble, France, for awarding beam-time
on the D20 and D2B diffractometers at the ILL reactor. The present work has been carried out
within the FP7 European project AccMet, Contract NMP4-LA-2011-263206.
Neutron diffraction (ND) (ILL) High-energy X-ray diffraction (HEXRD) (ESRF) ID22 Standard X-ray diffraction (XRD) (GPM)
D20 D2B
Wavelength of incident
radiation (Å) 1.123 1.595 0.400913 1.78897, 1.79285
Resolution ("Q/Q) at
Q=3 Å-1 (%) ~1 ~0.2 ~ 0.03 ~0.2
Measurement geometry T (fixed sample)
T (rotating
sample)
T (rotating
[image:20.595.68.519.227.431.2]sample) R (fixed sample)
Table 1. Experimental parameters for the different diffraction measurements. The wavevector Q
is given by Q=4π/λsin(θ) where λ is the wavelength of the incident radiation and 2θ the
20
CCFyNPdx
Nominal alloy composition
ND (ILL)
HEXRD
(ESRF) XRD (GPM)
y x D20 D2B
0.8 0 Co26.3Cr26.3Fe21.1Ni26.3 T0, T1(q), T1 (s),
T2(q), T3(q)
1.0 0 Co25Cr25Fe25Ni25 T0, T1(q), T1(s),
T2(q), T3(q)
T0 T0, T1(q), T1(s),
T3(q), T3(q),
T1(q)+T3(q)
0.5 Co22.2Cr22.2Fe22.2Ni22.2Pd11.1 T0 T0
0.8 Co20.8Cr20.8Fe20.8Ni20.8Pd16.7 T0, T1(q), T3(q)
1.0 Co20Cr20Fe20Ni20Pd20 T0, T1(q), T3(q) T1(q),
T1(s)
T0 T0, T1(q), T3(q),
T1(q)+T3(q)
1.2 Co19.2Cr19.2Fe19.2Ni19.2Pd23.1 T0, T1(q), T3(q)
1.5 Co18.2Cr18.2Fe18.2Ni18.2Pd27.3 T0 T0
[image:21.595.67.530.115.613.2]1.2 0 Co23.8Cr23.8Fe28.6Ni23.8 T0, T1(q), T3(q) T0
Table 2. List of alloys in different conditions investigated by the experimental techniques used
in the present work. (T0) corresponds to an alloy in as-cast condition allowed to cool in the Cu
21
annealing has been dropped into ice water and (s) that the alloy was allowed to cool in the
furnace. All measurements were performed at ambient temperature.
Alloy High-energy X-rays (HEXRD) Standard X-rays (XRD)
Neutrons
(ND) Peak 1 Peak 2
CCF0.8N - - 3.573(2) 3.570(3)
CCF1.0N 3.5721(1) 3.5733(3) 3.575(3) 3.580(3)
[image:22.595.65.517.166.269.2] [image:22.595.62.540.394.558.2]CCF1.2N 3.5749(2) 3.5770(5) 3.572(3) 3.575(3)
Table 3. Determined fcc lattice constants of investigated CCFyN (y=0.8, 1.0, 1.2) alloys in
as-cast conditions (T0). Peak 1 and peak 2 correspond to the two intensity components in fig. 2. The
numbers within brackets indicates the error in the last digit as obtained from a realistic
refinement.
Alloy High-energy X-rays (HEXRD)
Standard X-rays
(XRD) Neutrons (ND)
Peak 1 Peak 2 Peak 3 Peak 1 Peak 2 Peak 1 Peak 2
CCFN-Pd0.5 3.6201(3) 3.6327(6) 3.6437(8) 3.631(3) 3.643(5) - -
CCFN-Pd0.8 - - - 3.634(2) 3.656(3)
CCFN-Pd1.0 3.6595(3) 3.6752(7) 3.6871(6) 3.662(3) 3.678(5) 3.656(2) 3.673(3)
CCFN-Pd1.2 - - - 3.668(3) 3,686(3)
CCFN-Pd1.5 3.699(1) 3.705(1) 3.710(1) 3.705(3) 3.721(5) - -
Table 4. Determined fcc lattice constants of investigatedCCFN-Pdx (x=0.5, 0.8, 1.0, 1.2, 1.5)
alloys in as-cast conditions (T0). Peak 1, peak 2 and peak 3 correspond to the two and three
intensity components identified with similar method as in fig. 6b. The numbers within brackets
22
Figure captions
Fig. 1 (a) Measured diffraction patterns for a CCFN alloy by different experimental techniques.
(b) The fcc (220) peak on an enlarged scale. Patterns are measured by HEXRD (bottom curve),
XRD (1st middle curve), ND (2nd middle curve) and XRD(Mo)(top curve).The corresponding Miller indices are shown in a).
Fig. 2 (a) The fcc (220) and (b) the fcc (333, 511) peaks in the diffraction pattern measured be
high-energy X-rays divided into two components. (c) Lattice constants derived from the two
components of every diffraction peak assuming an fcc lattice.
Fig. 3 (a) ND patterns measured from CCF0.8N (bottom curve), CCFN (middle curve), and
CCF1.2N (top curve). (b) The (111) fcc peak at an enlarged scale. The corresponding Miller
indices are shown in a). The arrow in b) points to an unindexed peak.
Fig. 4 (a) Measured neutron diffraction patterns from CCFN after different heat treatments.
Notations from bottom to top: (T0) in as-cast condition. (T1(q)) after 3 hours at 1100°C and
cooled in ice-water. (T1(s)) after 3 hours at 1100°C and cooled in furnace, (T3(q)) after 3 hours
at 700°C and cooled in ice water. The vertical bars correspond to diffraction peaks for an fcc
lattice with a=3.572 Å. The corresponding Miller indices are shown. (b) The fcc (311) peaks at
an enlarged scale.
Fig. 5 Diffraction patterns obtained by different experimental techniques from CCFN-Pdx alloys
of several Pd contents. a) HEXRD, b) XRD and c) ND. In a) and b) the patterns correspond to,
from below, x=0, 0.5, 1.0 1.5 and in c) to x=0.0, 0.8, 1.0, 1.2. The corresponding Miller indices
are located at the positions of the diffraction peaks for the CCFN alloy.
Fig. 6 (a) The (111) diffraction peaks for CCFN-Pdx (x=0, 0.5, 1.0, 1.5) alloys as measured by
23
Fig. 7 Lattice constants for the three peak components according to figure 5 derived separately
from all diffraction peak with Miller indices (hkl) assuming the alloys contain only fcc structures
for a) CCFN-Pd0.5, b) CCFN-Pd1.0, and c) CCFN-Pd1.5.
Fig. 8 Derived average lattice constants corresponding to first two diffraction peaks for
CCFN-Pdx alloys as a function of x, determined by HEXRD (squares), ND (circles), and XRD
(triangles). The crosses refer to values reported in [38].
Fig. 9 Ratio between measured intensities of the peaks defined in fig. 5 for CCFN-Pdx alloys as function of x, determined by HEXRD (squares), ND (circles) and XRD (triangles). Full symbols
correspond to the ratio peak2/peak1, open symbols to peak3/peak1 in fig. 5.
Fig.10 Measured ND patterns for a) CCFN-Pd0.8, b) CCFN-Pd1.0, and c) CCFN-Pd1.2 after
different heat treatments. From below T0, T1(q), T3(q).The vertical bars correspond to
diffraction peaks for an fcc lattices with lattice constants given in table 4. The corresponding
Miller indices are shown.
Fig 11 The fcc (331) and (420) peaks as measured by ND from the CCFN-Pd0.8 alloy after
different heat treatments. From below T0, T1(q), T3(q).
Fig.12 (a) Measured XRD patterns CCFN-Pd alloys after different heat treatments. The curves
correspond to, from below, T0, T1(q), T3(q), T1(q)+T3(q) conditions. The Miller indices are
shown. (b) the fcc (111) and (200) peaks on an enlarged scale. The order of the curves is the
same as in (a). Vertical bars correspond to fcc lattices with, from below, lattice distances
Highlights
As-cast CoCrFeNi is not single-phase but made of at least two different fcc phases.
All investigated CoCrFeNiPdx alloys consist of at least three different fcc phases.
Figure
Figure
Figure
Figure
Figure
Figure
Figure
Figure
Figure
Figure
Figure
Figure
Figure
Figure
Figure
Figure