eurostat
TOTAL INCOME
OF AGRICULTURAL HOUSEHOLDS
^¿L
eurostat
STATISTISCHES AMT DER EUROPÄISCHEN GEMEINSCHAFTEN STATISTICAL OFFICE OF THE EUROPEAN COMMUNITIES OFFICE STATISTIQUE DES COMMUNAUTÉS EUROPÉENNES L-2920 Luxembourg - Tél. 43 01-1 - Télex: Comeur Lu 3423
B-1049 Bruxelles, bâtiment Berlaymont, rue de la Loi 200 (bureau de liaison) — Tél. 235 1111
Eurostat hat die Aufgabe, den Informa-tionsbedarf der Kommission und aller am Aufbau des Binnenmarktes Beteilig-ten mit Hilfe des europäischen statisti-schen Systems zu decken.
Um der Öffentlichkeit die große Menge an verfügbaren Daten zugänglich zu machen und Benutzern die Orientierung zu erleichtern, werden zwei Arten von Publikationen angeboten: Statistische Dokumente und Veröffentlichungen. Statistische Dokumente sind für den Fachmann konzipiert und enthalten das ausführliche Datenmaterial: Bezugsda-ten, bei denen die Konzepte allgemein bekannt, standardisiert und wissen-schaftlich fundiert sind. Diese Daten werden In einer sehr tiefen Gliederung dargeboten. Die Statistischen Doku-mente wenden sich an Fachleute, die in der Lage sind, selbständig die benötig-ten Dabenötig-ten aus der Fülle des dargebote-nen Materials auszuwählen. Diese Daten sind In gedruckter Form und/oder auf Diskette, Magnetband, CD-ROM verfüg-bar. Statistische Dokumente unterschei-den sich auch optisch von anderen Veröffentlichungen durch den mit einer stilisierten Graphik versehenen weißen Einband.
Die zweite Publikationsart, die Veröffent-lichungen, wenden sich an eine ganz bestimmte Zielgruppe, wie zum Beispiel an den Bildungsbereich oder an Ent-scheidungsträger in Politik und Verwal-tung. Sie enthalten ausgewählte und auf die Bedürfnisse einer Zielgruppe abge-stellte und kommentierte Informationen. Eurostat übernimmt hier also eine Art Beraterrolle
Fur einen breiteren Benutzerkreis gibt Eurostat Jahrbucher und periodische Veröffentlichungen heraus. Diese enthal-ten statistische Ergebnisse für eine erste Analyse sowie Hinweise auf weiteres Datenmaterial für vertiefende Untersu-chungen. Diese Veröffentlichungen werden in gedruckter Form und In Datenbanken angeboten, die in Menü-technik zugänglich sind.
Um Benutzern die Datensuche zu erleichtern, hat Eurostat Themenkreise, d. h. eine Untergliederung nach Sachge-bieten, eingeführt. Daneben sind sowohl die Statistischen Dokumente als auch die Veröffentlichungen In bestimmte Reihen, wie zum Beispiel „Jahrbücher", „Konjunktur", „Methoden", unterglie-dert, um den Zugriff auf die statistischen
It is Eurostat's responsibility to use the European statistical system to meet the requirements of the Commission and all parties involved in the development of the single market.
To ensure that the vast quantity of accessible data is made widely avail-able, and to help each user make proper use of this Information, Eurostat has set up two main categories of document: statistical documents and publications. The statistical document is aimed at specialists and provides the most com-plete sets of data: reference data where the methodology is well established, standardized, uniform and scientific. These data are presented in great detail. The statistical document is intended for experts who are capable of using their own means to seek out what they re-quire. The information is provided on paper and/or on diskette, magnetic tape, CD-ROM. The white cover sheet bears a stylized motif which distinguishes the statistical document from other publica-tions.
The publications proper tend to be com-piled for a well-defined and targeted public, such as educational circles or political and administrative decision-makers. The information in these docu-ments is selected, sorted and annotated to suit the target public. In this instance, therefore. Eurostat works in an advisory capacity.
Where the readership is wider and less well defined, Eurostat provides the infor-mation required for an initial analysis, such as yearbooks and periodicals which contain data permitting more in-depth studies. These publications are available on paper or in Videotext data-bases.
To help the user focus his research. Eurostat has created 'themes', i.e. a subject classification. The statistical documents and publications are listed by series: e.g. yearbooks, short-term trends or methodology in order to facili-tate access to the statistical data.
Y. Franchet Director-General
Pour établir, évaluer ou apprécier les différentes politiques communautaires, la Commission des Communautés euro-péennes a besoin d'informations. Eurostat a pour mission, à travers le système statistique européen, de répon-dre aux besoins de la Commission et de l'ensemble des personnes impliquées dans le développement du marché unique.
Pour mettre à la disposition de tous l'importante quantité de données acces-sibles et faire en sorte que chacun puisse s'orienter correctement dans cet ensemble, deux grandes catégories de documents ont été créées: les docu-ments statistiques et les publications. Le document statistique s'adresse aux spécialistes. Il fournit les données les plus complètes: données de référence où la méthodologie est bien connue, standardisée, normalisée et scientifique. Ces données sont présentées à un niveau très détaillé. Le document statis-tique est destiné aux experts capables de rechercher, par leurs propres moyens, les données requises. Les informations sont alors disponibles sur papier et/ou sur disquette, bande magnétique, CD-ROM. La couverture blanche ornée d'un graphisme stylisé démarque le document statistique des autres publications.
Les publications proprement dites peu-vent, elles, être réalisées pour un public bien déterminé, ciblé, par exemple l'en-seignement ou les décideurs politiques ou administratifs. Des informations sélectionnées, triées et commentées en fonction de ce public lui sont apportées. Eurostat joue, dès lors, le rôle de con-seiller.
Dans le cas d'un public plus large, moins défini, Eurostat procure des éléments nécessaires à une première analyse, les annuaires et les périodiques, dans les-quels figurent les renseignements adé-quats pour approfondir l'étude. Ces publications sont présentées sur papier ou dans des banques de données de type vidéotex.
TOTAL INCOME OF AGRICULTURAL HOUSEHOLDS
1992 REPORT
This report has been prepared for Eurostat by Berkeley Hill, Wye College, University of London.
May 1992
Cataloguing data can be f o u n d at the end of this publication.
Luxembourg: Office for Official Publications of the European Communities, 1992 ISBN 92-826-4420-0
© ECSC-EEC-EAEC, Brussels · Luxembourg, 1992
TABLE OF CONTENTS
PART ONE - GENERAL REPORT
1 Introduction 1
1.1 Background to the project, including guidelines and objectives 1 1.2 The relationship between the existing Eurostat Indicators and
the new measure of net disposable income 5
1.3 Progress so far 10
2 Summary of the major features of the methodology 12
2.1 Background 12 2.2 Definition of disposable income 12
2.3 Definition of a household 16 2.4 Classification of households into agricultural and
non-agricultural groups 18 2.5 The impact of time on household classification 21
2.6 Examples of the impact of alternative definitions of the
agricultural household 22 2.7 The methods (models) used for generating results and the
problems of bringing together estimates produced by
macroeconomic and microeconomic approaches 25
3 An overview of first results and of progress still to be made 30
3.1 Introduction 30 3.2 Progress still to be made 31
3.3 Future steps 37
PART TWO - COUNTRY REPORTS 39
Review of the methodology and results from the Total Income of Agricultural Households project on a country-by-country basis
Belgium 40 Denmark 41 Germany 52 Greece 65 Spain 73 France 78 Ireland 89 Italy 99 Luxembourg 107
Figures and Tables
Figures
Figure 1 Income indicators relating to the agricultural production branch of
the economy, as calculated by Eurostat
Figure 2 Definition of (Net) Disposable Income
Figure DK1 Denmark: Composition of total income, and deductions. Agricultural households. 1985
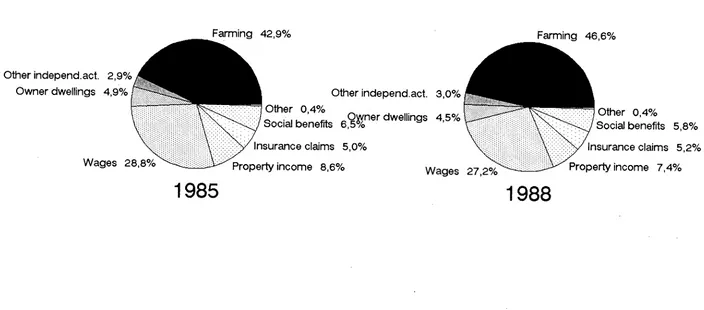
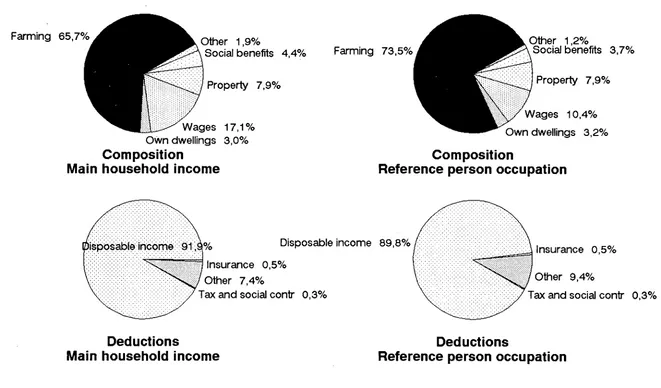
Figure DK2 Denmark: Composition of total income, and deductions. Agricultural households. 1988
Figure D1 Germany: Number of households, 1972-89. Agricultural and other independent households.
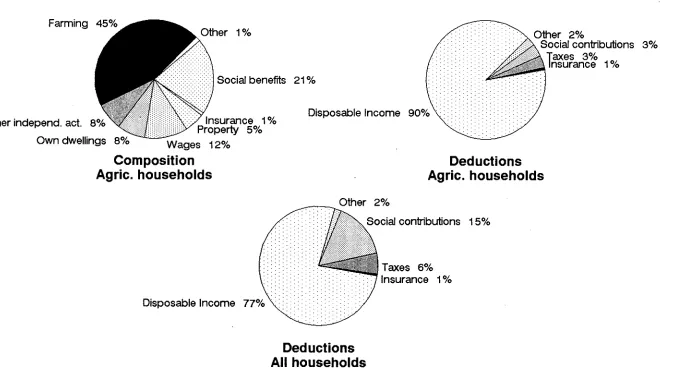
Figure D2 Germany: Composition of total income. Agricultural households. 1985 and 1988
Figure D3 Germany: Deductions from total income. Agricultural households. 1985 and 1988
Figure D4 Germany: Income per household, 1972-89. Agricultural households.
Figure D5 Germany: Disposable income per unit, 1972-88. Agricultural and all households.
Figure D6 Germany: Disposable income of households classed by socio-professional group. 1985 and 1988
Figure D7 Germany: Alternative income indicators. Indicators from TIAH project and from Eurostat, 1973-89.
Figure ELL1 Greece: Composition of total income, and deductions. Agricultural households. 1985
Figure ELL2 Greece: Composition of total income, and deductions. Agricultural households (excluding independent adults). 1985
Figure ELL3 Greece: Disposable income per unit. Alternative definitions of agricultural households. 1985
Figure ELL4 Greece: Income per household, 1982-88. Agricultural households
Figure ESP1 Spain: Composition of total income, and deductions. Agricultural households and all households. 1981
Figure ESP2 Spain: Development of aggregate income, 1981-86. Agricultural households
Figure ESP3 Spain: Relative income levels. Disposable income per unit. 1981 and 1986
8
13
45
46
53
55
56
57
59
60
62
68
69
71
72
76
77
Figure F1 France: Composition of total income. Agricultural households. 1984
and 1989 80
Figure F2 France: Income per household, 1984-89. Agricultural
households. 81
Figure F3 France: Alternative income indicators. Indicators from TIAH project
and from Eurostat, 1984-89. 83
Figure F4 France: Relative incomes, 1984-89. Disposable income per
household. Agricultural households and other groups. 84
Figure F5 France: Relative incomes per unit. Agricultural households and other
groups. 1989 86
Figure IRL1 Ireland: Composition of total income. Four definitions of an
agricultural household. 1987 91
Figure IRL2 Ireland: Composition of total income. Marginal farming households.
1987 93
Figure IRL3 Ireland: Deductions from income. Four definitions of an agricultural
household. 1987 95
Figure IRL4 Ireland: Disposable income per unit. Four definitions of agricultural
households. 1987 96
Figure 11 Italy: Composition of total income. Agricultural households. 1984
and 1988 101
Figure I2 Italy: Deductions from total income. Agricultural households and all
households. 1988 103
Figure I3 Italy: Disposable income per unit, 1984-88. Agricultural and all
households. 104
Figure I4 Italy: Relative change in main components of total income (current
Lira), 1984-88. Agricultural households. 105
Figure L1 Luxembourg: Composition of total income, and deductions.
Agricultural households. 1989 109
Figure NL1 Netherlands: Composition of total income. CBS estimates
(socio-economic accounts). Agricultural households. 1983 and 1985 114
Figure NL2 Netherlands: Deductions from total income. CBS estimates (socio-economic accounts). Agricultural and all households. 1983 and
1985 115
Figure NL3 Netherlands: Income per unit. CBS estimates. Agricultural and all
households. 1983 and 1985. 117
Figure NL4 Netherlands: Composition of total income, and deductions. LEI
Figure P1
Figure P2
Figure P3
Figure UK1
Figure UK2
Tables
Table 1
Portugal: Composition of total income, and deductions. Agricultural households and all households. 1980
Portugal: Composition of total income, and deductions. Agricultural households and all households. 1989
Portugal: Relative income levels. Disposable income per unit. Agricultural households and all households. 1980
United Kingdom: Composition of income assessed for tax. Agricultural and horticultural tax cases. 1980 and 1986
United Kingdom: Development of income, 1980-86. Income per tax case. Agricultural and horticultural tax cases.
Ireland: Numbers of households resulting from alternative definitions of an agricultural household. 1987
126
127
128
132
134
23
Table 2 Denmark: Numbers of agricultural households and characteristics by
criterion. 1988 24
Table 3 Denmark: Numbers of households and characteristics by criterion.
1985 and 1986
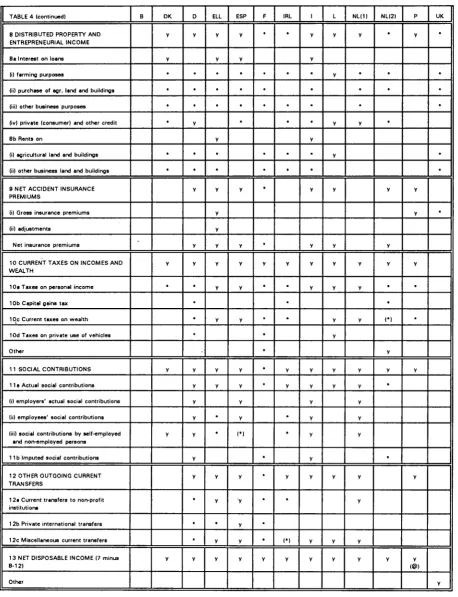
Table 4 Matrix of results for TIAH project (revised October 1991)
Table DK1 Denmark: Comparison of agricultural households with other socio-professional groups. 1985
24
34/5
42
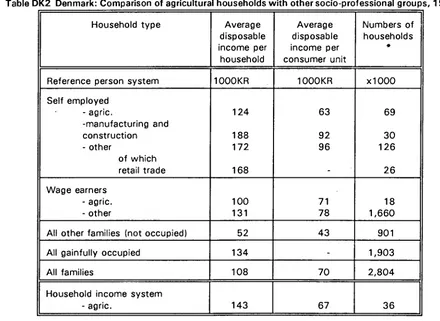
Table DK2 Denmark: Comparison of agricultural households with other
socio-professional groups. 1988 42
Table DK3 Denmark: Aggregate incomes of agricultural households using
"broad" and "narrow" definitions 49
Table DK4 Denmark: Income of agricultural households in aggregate. 1985 and
latest (1988) 51
Table D1 Germany: Income of agricultural households. 1985 and latest (1988)
Table D2 Germany: Average disposable income per unit, 1972-88
Table ELL1 Greece: Numbers of units resulting from alternative definitions of the agricultural household
63
64
66
Table ELL2 Greece: Estimated numbers of agricultural households in base year of the Family Budget Survey
Table F1 France: Average disposable income per unit, 1984-89
Table F2 France: Composition of total income, and deductions. 1984 (base year) and 1989 (latest)
67
87
Table IRL1 Ireland: Numbers of households and average disposable income per
unit for alternative definitions of an agricultural household. 1987 97
Table L1 Luxembourg: Disposable income (index of FLUX per month) per
household and per consumer unit. 1985 110
Table NL1 Netherlands: Numbers of agricultural households and average income for alternative definitions of an agricultural household. 1985
Table NL2 Netherlands: Aggregate income of agricultural households. 1985
118
PART ONE - GENERAL REPORT
Chapter 1 Introduction
1.1 Background to the project, including guidelines and objectives
1.1.1 It is becoming increasingly important to have available harmonized information on the income situation of agricultural households in Member States for the purpose of guiding Community agricultural and other policies. Central to the Common Agricultural Policy (CAP) is the objective of ensuring a fair standard of living for the agricultural community, reflecting Article 39 of the Treaty of Rome. Though alternatives are possible, the conventional way to approach this issue has been through the measurement and monitoring of farmers' incomes.
1.1.2 With the success of the CAP in achieving, even over-achieving, most of its other aims, the concern with incomes has come to dominate agricultural policymaking. Reform of the CAP is interpreted largely in terms of finding ways in which the income objective can be more effectively approached without at the same time encouraging further volumes of production. Changes to make farming more subject to market conditions are being accompanied by the introduction of new forms of assistance which aim to be neutral in their effect on production decisions at the farm level, at least as far as agricultural commodities which are in surplus are concerned. Some measures have been introduced for social reasons, some for environmental reasons, and some are to mitigate the impact of reductions in product prices which for so long have been supported by CAP commodity regimes. Examples include pre-pensions, transitional income aids, the encouragement of farm diversification, payments for extensification and for the provision of environmental services. Though few if any are completely neutral, since even transitional income aids are likely to retain temporarily in agriculture some resources which might otherwise have left, they are far less distorting than the market interventions which they are intended partly to replace.
1.1.3 As CAP reform proceeds it is to be expected that the activities of farmers and their families will broaden to include new forms of enterprise which are not strictly agricultural, as defined by the conventional industrial classification. These include the results of diversification (such as tourism, food processing and other small and medium enterprises). The greater amount of spending committed to the Community's Structural Funds for the support of rural areas (projected to double from 1989 to 1993) can be expected to increase the diversity of economic activities taking place there, with implications for the income and employment patterns of farmers and their families. Already about one third of Community farmers have some other gainful activity, typically off the farm, and pluriactivity is likely to be found on a rising share of holdings. In addition to earnings from gainful occupations, members of agricultural households may have income from property and, as citizens, are likely to be in receipt of welfare transfers and other payments.
the agricultural community, though clearly not an exact one, will need to cover income from all sources, not just that from farming activity. It will focus on the household or family unit rather than the farmer (agricultural holder) alone. And because not all the income is available to be spent, due allowance has to be made for taxation, social contributions and other transfers. The name given to the residual income is (Net) Disposable Income, and this forms a widely accepted concept for assessing the income situation of households.
1.1.5 At present, most of the support of agricultural commodity prices is given irrespective of the type of farmer, his farm tenure, size of business, family involvement and so on. Support is primarily given in proportion to the level of output, with only small additional assistance for small farms; under such a system, the bigger farms receive most of the benefits. Whether or not the farmer, or a member of his household, has other sources of income in addition to the farm is not taken into account. However, there is a general movement towards greater selectivity in targeting aid1. Under the reform of the structural funds, some of the new forms of assistance have various tests of eligibility associated with them, the aim being to target aid to farmers who are mainly engaged in agriculture or who gain most of their income from farming. Thus information on the total income of farmers and on income composition, which would enable the balance between the various components to be assessed, can play an increasing role in shaping policy and in monitoring its performance.
1.1.6 Anticipating the emerging need for additional income information, in 1985 Eurostat proposed the Total Income of Agricultural Households (TIAH) project. This was supported by the European Community's Agricultural Statistics Committee (ASC). The intention was that a measure of farmers' aggregate disposable.income should be developed which could eventually stand alongside existing indicators relating to the income of the agricultural branch of the economy in each Member State (calculated by Eurostat and described below), thereby enhancing the range of information available to policy decisionmakers. Though summary statistics on disposable income cannot, of course, reveal the distribution of incomes among agricultural households, estimates at Member State level were seen as representing a necessary and important advance in knowledge. However, such measures of aggregate disposable income marked a substantial departure in thinking from that usually adopted within the CAP and, indeed, within most national agricultural policies. Consequently the information systems in most Member States were not capable of enabling estimates to be made. It was recognised that substantial effort would be required to achieve results on a comparable basis for each country, and that this would take several years.
1.1.7 The ASC gave some general guidelines which subsequently have proved
1For example, see Commission of the EC (1991) The Development and Future of the Common
very important. These were that: the definition of agricultural households should be in line w i t h the methodology of the European System of Integrated Economic Accounts (ESA), the Community's national accounting system to which all Member States subscribe; the coverage should be restricted to the households of holders (ie farmers, and not households of hired workers); and that provision should be made for comparison w i t h non-agricultural occupation groups. The Working Party on the Economic Accounts for Agriculture was requested to look into the technical problems of the project; this it has continued to do, making regular reports back to the ASC.
1.1.8 A first main task was to collect and collate information which already existed in Member States on the total income situation of agricultural households and on the data sources which might be used to estimate aggregate disposable income. The alternative methods by which estimates might be constructed were also to be explored; these were expected to vary between countries according to ■ the available data sources. The outcome of this first task was summarized in Eurostat's first report on the TIAH project, published in 1988.2 This
systematically listed and analysed all relevant information known to national statistical authorities. T w o Member States (Germany and France) were found to already publish estimates of disposable income for agricultural households (and for other socio-professional groups) as part of their system of national accounts. The Netherlands had an experimental calculation for a single year. Other countries varied widely in the basic data which might be used for such a calculation.
1.1.9 All EC countries carry out annual farm accounts surveys. One reason for doing so is the commitment to contribute harmonized data to the Community's Farm Accountancy Data Network (FADN, also known by its French acronym RICA), whose results are published regularly by the Commission3. But, at present, for a
variety of reasons farm accounts surveys in most Member States do not provide information on the overall income situation of agricultural households. There is no requirement in FADN to cover information on income from outside the farm business, though this may be collected for national purposes. Most surveys do not gather such data; the exceptions were found to be Germany, Netherlands, Denmark and the United Kingdom. Moreover, the administrative requirement that these surveys should achieve a high coverage of national production in an economic way means that they leave out many small farms which fall below some imposed minimum size threshold and which contribute relatively little to total
2Hill, Berkeley (1988) Total Incomes of Agricultural Households: Existing information and proposed
methodology for a harmonized aggregate indicator. Theme 5 Series D. Luxembourg: Eurostat. 133 pages. Versions in French and German were published in 1989.
output. Nevertheless, these small farms may be the main source of livelihood or occupation of their holders and may form a substantial element of "the farm income problem".
1.1.10 All countries also undertake family (household) budget surveys, co-ordinated by Eurostat. The methodology is not yet completely harmonized, but
similar approaches are taken by Member States4. However, these surveys are
often widely spaced in time (with intervals of up to seven years between surveys), are frequently weak in terms of income data, especially from self-employment (independent activity) since they were not set up with income measurement primarily in mind (their focus was expenditure information needed to construct indices), and the number of cases formed by farmer households is, at least in the northern countries, often too small to be statistically reliable.
1.1.11 Among the other sources encountered, taxation records are hampered by incomplete coverage and, in many Member States, by regimes that levy tax at a flat rate per hectare (the "forfait" approach) rather than on actual income. Information sources found in a few countries included social security schemes and occasional surveys. Perhaps not unexpectedly, some Member States had several good data sources while others had none.
1.1.12 The second main task at the outset of the TIAH project was to develop an agreed methodology by which harmonized estimates could be generated for each Member State. After much discussion of details within the Working Party, this was published in 1990.5 One vital step in this process was the clarification of the aims of the TIAH project. In the Manual of Methodology the specific objectives are set out. They are to generate an aggregate income measure, using a harmonized methodology, in order to:
(i) monitor the year-to-year changes in the total income of agricultural households at aggregate level in Member States;
(ii) monitor the changing composition of income, especially income from the agricultural holding and from other gainful activities, from property and from welfare transfers;
The basic methodology for the latest round of surveys is described in Eurostat (1990) Family Budgets: Methodological handbook. Theme 3 Series D. Results are given in Eurostat (1990) Family Budgets: Comparative tables. However only the methodologies and results for six countries (Germany, Spain, France, Ireland, Italy, Netherlands) are covered. For a more complete account reference should be made to the earlier round of surveys, made in about 1979, and reported in Eurostat (1985) Family Budgets: Comparative Tables - Federal Republic of Germany, France, Italy, United Kingdom and Eurostat (1986) Family Budgets: Comparative Tables - Netherlands, Belgium, Ireland, Denmark, Greece. Spain. Both Theme 3 Series C. Luxembourg: EEC.
(iii) enable comparisons to be made in the development of total incomes of agricultural households per unit (household, household member, consumer unit) with those of other socio-professional groups.
and (iv) enable comparisons to be made between the absolute incomes of farmers and other socio-professional groups, on a per unit basis.
1.1.13 The main features of the harmonized methodology are outlined in Chapter 2. It consists of a set of target definitions and procedures to be adopted in the estimation of the aggregate disposable incomes of agricultural households. The methodology's development drew on the conceptual framework of national accounting, the experience of countries (both inside and outside the EC) which already construct estimates, the view of the policy sections of the Commission (in particular the Directorate-General for Agriculture DGVI), and the opinions of the relevant national statistical authorities in Member States. For the latter purpose bilateral discussions were held between Eurostat (with an external expert) and each Member State.
1.1.14 The diversity of data sources found in Member States has meant that, though target definitions are harmonized, the way in which estimates are actually created must be allowed to vary from country to country. Three broad approaches to making estimates were proposed, representing points on a spectrum between macroeconomic and microeconomic methodology. The first was to base the estimation firmly within national accounting. The second was to gross-up results from surveys. The third was to take the estimates of income from farming from the aggregate branch Economic Accounts for Agriculture (described below) and to
use other sources (often survey data) for the other components of disposable income. These approaches are described in more detail later.
1.2 The relationship between the existing Eurostat Indicators and the new measure of net disposable income
1.2.1 Eurostat already calculates a range of indicators (Indicators 1, 2 and 3, and a Cash Flow) which are published in its annual Agricultural Income report and in other Community documents, notable the Agricultural Situation in the Community
series. These Indicators play an important role in the monitoring of the CAP, and they will continue to do so long after the TIAH project reaches maturity. In order to understand the methodology adopted by the TIAH project and to put the initial results in context, it is necessary to outline briefly the nature of the existing indicators.
agricultural accounts6. This set of EAAs in turn forms part of the harmonized national accounts system for the EC, the European System of Integrated Economic Accounts (ESA)7. Within the ESA two types of account are of direct relevance to the discussion here - the Production Account and the Distribution of Income Account. The existing Indicators are derived from the first of these; the TIAH methodology belongs to the second.
1.2.3 The Production Account shows, on one side, the value of output from
productive- activity (good and services) and, on the other, intermediate consumption (goods and services bought); the balancing item is Gross Value Added (GVA) at market prices. After allowing for capital consumption and adjusting for subsidies and taxes linked to production, this becomes Net Value Added (NVA) at factor cost. In the ESA the overall Account is subdivided into parts, and the account of the agricultural branch of the economy is shown separately. As a historically important part of the economy of most countries, especially so in the period during and following the Second World War when the conceptual framework of the present accounting system took shape, this singling out of agriculture reflects the way that national accounting developed.
1.2.4 The "branch agriculture" is defined in terms of economic activities to produce commodities deemed to be agricultural and which are listed in the EAA Manual. Consequently, the production by farms of non-agricultural commodities (such as tourism services, food processing and environmental services) is excluded when measuring the activities of the agricultural branch. In practical terms the building up of an account for agricultural production is relatively straightforward; its products are fairly easily distinguished from those of other industries, and the inputs it buys from other industries can also be measured, though not so easily. The values of outputs and inputs are, in the main, taken from information on physical levels of production and input use which are multiplied by average prices of outputs and inputs. This enables an account to be drawn up rapidly, so that, typically, estimates for the calendar year are available to Eurostat within a few weeks of its closing date, with early estimates possible before the year end (as soon as the main harvest period is over). The balancing item in the agricultural production account (agriculture' s Net Value Added) can be interpreted as the increase in value which agricultural production gives to the goods and services (including capital goods) which farming buys from other parts of the economy.
1.2.5 A "branch" is described in the ESA Manual as consisting of "groups of units of homogeneous production which are exclusively engaged in the production of a single product or groups of products". In essence, the account for the agricultural branch of the economy relates to the total production of agricultural goods
Eurostat (1987) Manual on Economic Accounts for Agriculture and Forestry. Theme 5 Series E. Luxembourg: Eurostat. A new English version has been published in 1992.
irrespective of the nature of the operators who produce them. Though most of this productive activity takes place on what would be generally accepted as being commercial farms, some takes place on units which are not primarily farms (for example, religious institutions) and some takes place in domestic gardens. No notice is taken of the nature of the operator, so the agricultural branch's production is the combination of output from full-time farmers, part-time farmers with various degrees of off-farm activity, from corporate bodies and so on.
1.2.6 Agriculture's Net Value Added at factor cost forms the reward to all the fixed factors used in agricultural production - all land, all capital and all labour (both independent and dependent). From the Net Value Added of agricultural productive activity it is possible to deduct the costs of interest payments and rents paid to leave a residual which forms the reward to a bundle of resources consisting of the total labour input employed and the capital and land owned by producers. A further deduction of the cost of hired labour leaves a residual which is the reward to the unpaid (family) labour (including its managerial activities) and the owned land and capital. From these three Eurostat calculates its Indicators 1, 2 and 3 by deflating and dividing by the number of Annual Work Units (AWUs), in the manner shown in Figure 1.
1.2.7 These Indicators have been interpreted, for policy purposes, as showing the changing income situation of agriculture. Of the three, Indicator 1 (Real NVA/AWU) has been given the greatest weight because it pre-dated the others and is considered statistically the most reliable. However, it is self-evident that, except in very particular circumstances, they represent concepts which are far removed from the personal income of farmers and their households; this applies especially to Indicator 1. They ignore any income accruing to farmers and their families from sources other than farming. They make no allowance for the amounts taken by taxation and other forms of involuntary spending. It would be wrong therefore to interpret them as representing personal incomes; even using them as proxies for
developments in personal incomes over time is suspect, since the existence of multiple income sources means that it is possible for the total income situation of farmers and their households to be improving while their incomes from farming are declining, and vice versa. Nevertheless these Indicators have been misused as a proxy for personal incomes, probably because they were published and no other measure nearer the policy needs was available.
Figure 1 : Income indicators relating to the agriculture production branch of the economy, as calculated by Eurostat.
Note: computation or estimation of these income indicators is based on the Economic Accounts for Agriculture, which form part of the European System of Integrated Economic Accounts. Indicators are worked out as shown below.
ι Final production
| Intermediate | consumption
Gross value added at ■arket prices
Taxes linked to pro-duction
Subsidies
Gross value added at factor cost
Depre-ciation
Net value added at factor cost
Rents Inter-est
Net incoae froi agricultural activity of total labour input
Coapen-| Net incove froa sation | agricultural of e i - | activity of faaily ployeesj labour input
Deflated, divided by AVU (total labour input)
Deflated, divided by AMU (total labour input)
Deflated, divided by AVU (faaily labour input)
INDICATOR 1
INDICATOR 2
1.2.9 Within the ESA there is provision for further sub-division of households into socio-professional groups. However, this has not as yet been developed. As will be seen later, even the methodology by which households should be classified into occupation groups has not been worked out. Nevertheless, it would seem quite likely that the households of farmers would be adopted as one distinct socio-professional group. The TIAH project is, in effect, an anticipation of a more general disaggregation of the household sector account. The aim is to construct a Distribution of Income Account for agricultural households, and for other groups where possible, in order to estimate aggregate Net Disposable Income for these households. Disposable income of the agricultural household sub-sector can be expressed per household, per household member and per consumer unit. Comparisons can be drawn with the income situation of all households and, where the data exist, with other socio-professional groups. The account also allows the composition and distribution of agricultural households' total income to be examined.
1.2.10 In this sector approach some conceptual problems (described later) are encountered because agricultural households are engaged both in consumption activities and in production, no separation being made in the ESA Distribution of Income Account. On a more practical level, it is important to realise that in the Distribution of Income Account all the resources flowing towards agricultural households are covered, not just the rewards from farming. Drawing up the Account presents more data problems than are encountered in the EAA, since the economic activities of agricultural households extend well beyond the limits of agricultural production. Many of the aggregate data sources (such as the interest paid or received by banks) will not keep separate records on the amounts paid or received from agricultural households; a variety of sources have to be used to build up the income picture. Some of the practical difficulties and the ways in which they may be overcome are described in Chapter 2.
1.3 Progress so far
1.3.1 During 1990 and 1991 Member States have been applying the TIAH methodology and have supplied Eurostat with their results. At the outset countries differed greatly in the extent of the existing information and available data sources. Therefore some had to take far larger steps in order to make estimates than others. Consequently, Member States are at various stages of development. At one extreme, Germany can supply estimates of household disposable income for agricultural households and other selected socio-professional groups on an annual basis from 1972. At the other, some Member States can only provide figures for a single year for agricultural households, with no comparisons possible. A variety of approaches to estimation have been used; all countries, however, have operated within the harmonized methodology.
1.3.2 The years for which results are now (beginning of 1992) available are as follows:
Belgium 1987 (only partial information)
Denmark 1985, 1988 (some data also for 1983, 1984, 1986, 1987)
Germany 1972 to 1989, for each year.
Greece 1982 to 1988 for each year
Spain 1981 base year, extrapolation for 1982 - 1986
France 1984 to 1989 (non-comparable estimates for 1970, 1979, 1983 are also
available from national accounts)
Ireland 1987
Italy 1984 to 1988 for each year
Luxembourg 1989
Netherlands 1 9 8 1 , 1983, 1985 (from socio-economic accounts) 1985/86/87 (from farm accounts survey)
Portugal 1980 to 1990 in two series (1980-85 and 1986-90)
United 1980 to 1986 (and partial information for 1987) Kingdom 1988/9 (from farm accounts)
report (from the 1987 report, published in 1988, onwards). Internal working papers have reviewed the results from a methodological perspective, but these are unsuitable for general distribution. The ASC has pointed to the necessity of ensuring that adequate explanation of the methodology is given in order to avoid misinterpretations. The Working Party is also adamant that publication should not be premature.
Chapter 2: Summary of major features of the methodology
2.1 Background
2.1.1 The full methodology of the TIAH project is presented in the Manual on the Total Income of Agricultural Households (hereafter called the TIAH Manual), published in three languages (French, German and English) in 1990. This methodology was developed by Eurostat staff concerned with the Economic Accounts for Agriculture and with national accounting in collaboration with the Working Party on the Economic Accounts for Agriculture, representing the relevant statistical authorities in Member States. Other parts of the Commission were consulted and kept informed; these included sections of Eurostat concerned with national accounts and family budget surveys and the Directorate-General for Agriculture, DGVI.
2.1.2 The TIAH Manual sets out "target" definitions and procedures. It is recognised that Member States are not yet fully capable of applying the methodology. Nevertheless, by having targets it is clear what the harmonized basis of producing results should be, and any changes in actual practice should be in the direction of the targets. The TIAH Manual also sets out, for key elements in the methodology, a number of acceptable interim alternatives to the "target" which Member States may adopt. As will be seen below, this applies principally to the method by which households are classified into socio-professional groups. Member States are requested to supply documentation on any departures from the harmonized methodology.
2.1.3 Here only an outline of the most important features can be given. Attention is focused on three issues; the definition of disposable income, the definition of a household, and the classification system used to distinguish agricultural households from those belonging to other socio-professional groups.
2.2 Definition of disposable income
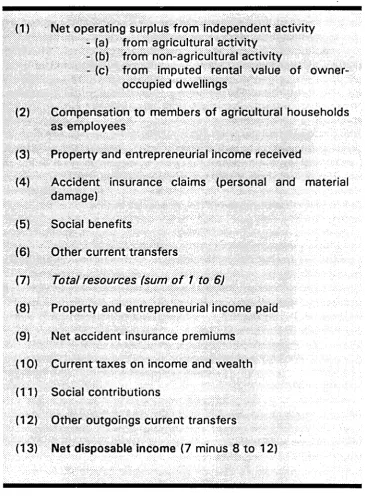
2.2.1 The main income concept used in the TIAH project is (Net) Disposable Income. The way that this is defined is shown in Figure 2. It should be noted that this concept includes not only income from other gainful activities, but also from pensions and other forms of transfer. The value of farm-produced goods consumed by agricultural households and the rental value of the farmhouse are treated as positive components of income. Elements deducted include current taxes and social contributions.
Figure 2: Definition of (Net) Disposable Income
(1) Net operating surplus from independent activity > (a) from agricultural activity
- (b) from non-agricultural activity
-(c) from imputed rental value of owner-occupied dwellings
(2) Compensation to members of agricultural households as employees
(3) Property and entrepreneurial income received
(4) Accident insurance claims (personal and material damage)
(5) Social benefits
(6) Other current transfers
(7) total resources (sum of 1 to 6)
(8) Property and entrepreneurial income paid
(9) Net accident insurance premiums
(10) Current taxes on income and wealth
(11) Social contributions
(12) Other outgoings current transfers
them at something less than the target income definition. In the longer term, the detail will permit the consideration of a range of alternative income concepts, such as income before the deduction of tax.
2.2.3 Some features of the definition are worthy of note, since lack of awareness may lead to a misinterpretation of results. Many of these reflect the macroeconomic origins of the methodology. There are differences between the nature of individual items listed in Figure 2 and concepts using similar names within microeconomic sources (such as family budget surveys). However, their importance should not be overstated.
2.2.4 First, in the flow of resources to agricultural households in Figure 2, the reward from independent activity (self-employment) is shown in the form of Operating Surplus (value of output minus costs of hired labour). Rent and interest costs (property and entrepreneurial income paid) are deducted later, among the list of negative items. However, in practice many Member States deduct these two at the level of Item 1, showing what is in effect an income figure. The end result is the same, but there are implications when looking at the composition of total income.
2.2.5 Second, accident insurance premiums and claims (receipts) are shown as separate items. This may seem strange, but is explained by the fact that the Distribution of Income Account for households, as part of the ESA, has to record flows between all the various sectors; one of these is the Insurance Enterprises sector. On the negative side, at the individual household level insurance premiums would normally be regarded as a cost to be deducted before the calculation of disposable income, but receipts from claims, especially for the replacement of assets destroyed by accident, probably would not. This is a specific example of a general point; in microeconomic approaches some items would not normally be regarded as elements in the calculation of disposable income although they appear in the list in the macroeconomic approach.
2.2.6 Third, in the TIAH methodology all interest charges are treated as negative items, whether the borrowing is for business purposes or to finance consumption goods. This reflects the dual role of agricultural households within the ESA as both production and consumption units (see 1.2.10 above). Again, a family budget approach might accept the former as being a cost associated with independent activity, but would probably claim that payment of interest on consumer borrowing should be made out of disposable income, and not treated as a cost in its determination. However, even if the methodology required a distinction between the two, for agricultural households it may be impossible in practice for surveys to separate them in any meaningful way because of the close association of business and personal wealth.
services taken from farms by their operators in non-money forms (farmhouse consumption of farm products, the rental value of owned accommodation) it is by no means certain that these are either adequately captured or correctly valued. Furthermore, Net Disposable Income is only a measure of current flows, and no account is taken of capital gains which, according to some conventions, could form a part of personal income.8 Capital gains can be realised in many ways other than by sale, and it has been found that farmers with capital gains can adjust their consumption spending (or sums set aside for pensions) to reflect these gains. Wealth, which represents a potential source of purchasing power and therefore of economic status, is also ignored. Hence Net Disposable Income must be regarded only as a partial measure of the command which agricultural households have over goods and services.
2.2.8 Particular care must be taken when drawing comparisons between the income levels of agricultural households and those of other socio-professional groups. Here the coverage of income in kind is a particularly sensitive issue. Comparisons in the development of incomes of agricultural households over time are not likely to be hampered by an inadequate coverage, and even for comparisons between different groups of farmers (for example, those belonging to different farming types) the impact would probably be small. However, this is not the case when comparisons are drawn between agricultural households and the all-household average, which is dominated by all-households, mainly urban, in which wages from dependent activity form the main income source. In contrast to this last group, farmers have the opportunity to consume directly the output from their productive activities (food, fuel), and to treat some items of personal consumption as business expenses. Often farmers live in houses which would command substantial rental values; there is an impression among the statistical authorities of Member States that, where this item is included as a form of income, the value of owner-housing on farms is often understated. In some countries the estimate of own-consumption is too low, as it is valued at farm-gate prices whereas perhaps it should be measured at retail prices, with appropriate reductions to allow for any lack of processing, presentation and so on. On the other hand, the costs of consumer goods are often higher in rural than urban areas, so that a given disposable income could indicate lower physical consumption9. To ease some, though not all, of these sources of disparity, the Working Party has proposed that comparisons should be made, where possible, with other households which rely for their main income source on independent activity.
Q
For a discussion of the definition of personal income, and the relevance of different form of income measurement to agricultural policy, see: Hill, Berkeley (1989) Farm Incomes, Wealth and Agricultural Policy. Aldershot, UK: Gower.
g
2.2.9 It is also evident that the income of agricultural households differs in the nature of the rewards it represents from that accruing to households in general. Income from independent agricultural activity (the main source for farmers) is a mix of rewards, being the residual available to the owned capital and land, and the unpaid labour of the household, including an element for the risk-taking function of entrepreneurship. In contrast, the main source of income of households in general is from dependent activity (that is, wages) alone. While not denying the different economic function of the main income source, this is not a valid reason for objecting to comparisons between the disposable income of farmer households and other groups, even those whose income comes entirely from state welfare benefits. Net Disposable Income is essentially an indicator of potential for spending on consumption and/or saving. Whether one group is relatively disadvantaged compared with another will depend on the level of disposable income, not its composition (though composition may be used as a means by which the groups to be compared are defined). For policy purposes there may be special interest in drawing comparisons of income levels between farm households and the households of, for example, other independent businessmen, but again this has nothing directly to do with matching the mix of factor returns. This is an important point.
2.2.10 Finally, there is the matter of comparability between incomes in different countries. Such an exercise is beset with problems. Even in the absence of the present disharmony between actual TIAH methodologies, the balance between private and public provision of goods and services varies, and this may lead to false pictures of real consumption potentials. There may be different cost structures, reflecting national indirect taxation regimes. And the means of expressing national currencies in a common unit (ECU exchange rates, or Purchasing Power Standards) may be inadequate for the purpose. Hence, at this stage, comparisons of Net Disposable Incomes of agricultural households between Member States are best avoided.
2.3 Definition of a household
2.3.1 For the purpose of measuring Net Disposable Income, the most appropriate unit is that of the household. This is the practice in Family Budget Surveys. The logic for preferring the household rather than the individual as the income unit is that members of households, and especially married couples and their dependent children, usually pool their incomes and spend on behalf of the members jointly. This is not to deny that there may be some differentiation; a wife may consider part of her income, perhaps some minor sums coming from outside the farm, as her own to do with as she wishes. However, in general it makes much more sense to use the household as the unit. Otherwise, in a farm family with the business operated as a sole proprietorship, all the farming income would be shown against the farmer, and his wife and children would be shown as having zero income, a situation which obviously inaccurately expresses their real position as potential consumers.
(Household) Budget Surveys. Though not completely harmonized, the definitions of household employed in Member States typically include all members who live under the same roof and share meals. A household can consist of a single person. Large groups of persons living together in institution (religious houses, universities etc) are normally excluded.
2.3.3 In order that households of different sizes and compositions can be brought together for income measurement purposes, it is convenient to express incomes per household member and per consumer unit. While the former is simply the result of a count of the number of persons in households, the latter uses coefficients (in the form of an equivalence scale) to express children and additional adults in terms of consumer units. A variety of approaches can be used to calculate these coefficients.10 However it appears that, whatever scales are chosen, arbitrary judgements are inevitable. Scales devised for general application may not necessarily be suitable for application in agriculture, though they may be accepted as being the only ones available. The use of such scales is nevertheless important to any comparison between farmers and non-farmers, since agricultural households are on average larger than households in general in all Member States11. Small variations in the scales used are found between Member States (which may reflect real differences in socio-economic conditions between countries), but in practice most Member States adopt a standard set of coefficients; typically the head of the household counts as 1 unit, additional adults 0.7 units, and children as 0.5 units.
2.3.4 It is important to note that households of farmers, defined in this way, may include persons who contribute no labour input to the agricultural holding. These individuals may or may not have other occupations or sources of income. Their treatment reflects the consumption orientation of income measurement in the TIAH methodology. In contrast, some of the assistance given by the CAP under structural aids adopts a narrower view of the household. For example, in applying income tests to the "Transitional aids to agricultural income" (Regulations (EEC) Nos 768/89, 3813/89, 1279/90) income is measured only for the farmer and those members of his family working on the holding, though it captures all forms of
Some of these methods are reviewed in Buhmann, B., Rainwater, L., Schmaus, G. and Smeeding, T. M. (1987) Equivalence Scales, Well-being, Inequality, and Poverty Sensitivity Estimates Across Ten Countries Using the Luxembourg Income Study (LIS) Database. Review of Income and Wealth, 33, 115-42.
In Eurostat (1986) Family Budgets - Comparative Tables, the average numbers (persons) per
household were as follows, (all households followed by households headed by farmers and agricultural workers): Belgium 2.9, 4.2; Denmark 2.2, 2.8; FR Germany 2.5, 4 . 1 ; Spain 3.7, 4.2; France 2.8, 3.6; Ireland 3.7, 4.0; Italy 3.2, 4.0; Netherlands 2.9, 3.8. The reference year varies from 1978 to 1982.
income for these persons. Early retirement aids (Regulation (EEC) No 1096/88) only consider the income from the applicant (that is, the one person). These various approaches taken to the size of the unit over which income measurement takes place are not necessarily in conflict. Aids directed at those engaged in agriculture will, understandably, not wish to consider people who do not work in agriculture. Given sufficient detail in its basic data, the TIAH project might throw light on the relative contributions made to the total income of households by members who do no work on the holding. In practice, it is felt that very few people who live as parts of agricultural households would contribute zero labour input to the farm at times of labour shortage, such as harvest, even if they held full-time jobs off the farm. The essence of the TIAH project is to provide information on the overall income position of agricultural households, not fractions of them.
2.3.5 As will be seen below, all but two of the Member States who have supplied results to the TIAH project have adopted the household as the basic unit over which income has been measured. The exceptions are Denmark and the United Kingdom. In the former, where the "Family" is used, this is not felt to be a major departure since the social structure of Denmark means that multi-generation households (and other extended forms) are not common. The latter uses tax cases, as this is the only practical option in the UK.
2.4 Classification of households into agricultural and non-agricultural groups
2.4.1 The most significant part of the target methodology, and one which can have a substantial effect on the results, is the system used for classifying households as agricultural or belonging to some other socio-professional group. As noted above, the national accounts methodology for the European Community as a whole (ESA) has not yet developed such a classification system. Nevertheless, it is clear that it would have to be capable of allocating all households in a systematic way using the same basic criterion. For example, it would not be satisfactory to classify agricultural households on the basis of occupation of agricultural land, but to classify households of waged workers according to their main income source. The possibility would exist of one household being included in two groups or being left out of any. Such inconsistencies must be avoided.
2.4.3 Another possible approach was to allocate households to occupation groups on the basis of the occupation group of one of its members, termed the reference person (normally the head of the household). Many Member States already have such systems in operation. The reference person's socio-professional group is determined by criteria such as the main source of income, or main use of time, or combinations of the t w o . This is typically the approach adopted by Family Budget Surveys. Developments in ESA methodology made after the TIAH target definitions were settled suggest that such a reference person system is now more likely to be adopted for the proposed general disaggregation of the household sector, for reasons of practicality rather than theory. To cater for this possibility, and as a reflection of what is practically possible within Member States, during 1991 the TIAH methodology was expanded to encourage the estimation of results by all Member States using a reference person classification system. This was seen as a supplement to (not a substitute for) using the original target definition. Under this system an agricultural household is one in which the main source of income of the reference person (or, failing that, the main occupation of the reference person) is independent activity in agriculture.
2.4.4 A reference person system carries with it the possibility that the nature of the total household may be poorly represented. For example, an elderly person who considers himself as being the head and also as being a farmer may have living in his household many younger people whose main income sources and occupations are off the farm. While the household may be classed as agricultural using a reference person system, it might be non-agricultural in terms of its overall income composition. Such situations can be reduced by imposing criteria to determine who is taken as the reference person; it could the member with the highest income. However, as will be seen later in the country chapters (Part Two), typically the determination of the reference person, or head of the household, is subjective and self-declared, though there are examples of explicit criteria being applied.
2.4.5 In most examples of main-occupation classification systems, the choice of socio-professional group is also left to the subjective judgement of the reference person. This would not necessarily correspond to the view of an outside observer. Neither does it necessarily reflect dependency; there is plenty of evidence to show that wide differences exist between the proportionate use of time and the proportionate composition of income, particularly among small farms.
2.4.6 It should be noted that households headed by hired workers in the agricultural industry are not included within the agricultural household group under any of the classification systems put forward. In practice, only farmer-households are covered.
operated in non-corporate form; the structural arrangements are often made for taxation convenience rather than to secure other advantages. Taxation data form an important information source in countries where these farms are found. However, farmer-directors of such farms will normally be treated in taxation statistics as receiving income as employees of their own businesses, rather than as receiving income from independent activity (self-employment). Consequently, they may escape inclusion as agricultural households; they may be classed among the large group of dependent households (wage or salary earners). Special arrangements have been made in the TIAH methodology to cover such households.
2.4.8 The definition of an agricultural household used here is consistent with the background and aims of the TIAH project. In other circumstances other definitions are appropriate12. Specific policy programmes will have target groups which may be either more or less restricted in their coverage than the definition adopted here. For some policy purposes it may be desirable to treat all households with which a holding is associated as "agricultural". Eurostat has considered this "broad" definition and the problems of estimating results to cover all the households involved. In some countries (Greece, for example) such an approach would have little meaning; small holdings operated on a part-time basis and associated with large families whose members are predominantly engaged in urban jobs will not produce meaningful information on the income situation of the agricultural community. For other programmes some minimum threshold of holding size might be imposed on the "broad" approach, but this runs the danger of excluding families who produce little but who nevertheless are mainly dependent on farming for their livelihood. Also, some large farms will be included where the occupiers are mainly dependent on even larger earnings from other businesses; these may be significant agricultural producers and thus of importance to policies directed at influencing the level of production, but they will be outside the boundary of policies aimed at families which are mainly dependent on farming. Given enough basic data, it might be possible to estimate disposable incomes for agricultural households defined in many alternative ways. However, for the present purpose it was necessary to give priority to a definition which was appropriate to the general direction of the TIAH project.
2.4.9 Though the main focus of attention of the TIAH project remains the "narrow" approach to what constitutes an agricultural household, during the period since the target definition was established the desirability of also making income estimates using the "broad" approach has risen. It is accepted that this could never be the basis for a complete disaggregation of all households into socio-professional groups. But in the opinion of the Commission's DGVI (a major potential user of the results) there are particular policy situations where information gathered in this way might be useful. By subtraction it should also be possible to throw light on the income situation of those households with agricultural holdings
ι o
which are not primarily dependent on farming for their livelihood (those households which fall outside the "narrow" but inside the "broad" approaches). The conceptual and practical problems of using a "broad" definition are still under consideration.
2.4.10 To sum up, the present position in the TIAH methodology is that the "target" criterion for defining the agricultural household remains the income composition of the entire household. However, in addition all countries have been asked to generate estimates using a reference person system. In the short term this should enable greater harmonization of results from Member States. In the longer term it would permit the TIAH methodology to adapt to the ESA methodology when the latter has been settled. Steps are also being taken to made aggregate income estimates for all households which operate an agricultural holding, for use in particular policy situations outside the main line of development of the TIAH project.
2.5 The impact of time on household classification
2.5.1 An income-based system which only looks at figures for a single year is likely to result in many temporary reclassifications at the margin from year to year due to the fluctuating nature of farm incomes. This problem exists whether the income classification is applied at the level of the household or the reference person. Not only will the number of agricultural households change; their average income will be affected, though it is not clear if this results in an overstatement or an understatement of the position relative to that of a more consistent group of households13. Averaging incomes over a run of years would present a more stable classification; analysis of farm-level data in Germany suggests that taking a three year period removes most of the unpredictable variation in incomes. Taking longer periods gives more stability, but there is an increasing danger that changing farm structure (changes in the size distribution of the farms concerned) will affect the
long-term trend in income variability14. Classifying according to the main
occupation (defined according to time spent) of the reference person may show
13
Situations could beset out in which either possibility might arise. Also a distinction has to be drawn between those circumstances in which the number of agricultural households remains unchanged and those where the same individuals remain in the group. Taking a rather extreme case, if falling agricultural incomes are restricted to households with low total incomes, marginal reclassification could result in a rise in the average income for the remaining agricultural households. Conversely, rising agricultural incomes could cause a fall in the overall average if many previously-excluded low income farms are brought in.
14See: Cordts, W., Deerberg, K. H. and Hanf, C. H. (1984) Analysis on the Intra-sectoral Income
more stability, but this system has other major disadvantages; time spent is not a satisfactory guide to income dependency, and it does not correspond to the suggested ESA methodology.
2.5.2 The TIAH project encourages the exploration of classification involving the averaging of incomes over time. While at present income measurement systems are rarely set up in ways which enable this to be carried out formally, in practice an element of averaging seems to take place. For example, when information on the main source of income involves some subjective judgement by administrators (such as is used in the UK by taxation authorities in allocating taxpayers according to their normal main income source) a form of averaging is already being employed.
2.5.3 Whichever means of classification is used, the households which are classified as agricultural will not form a constant group over time. In the long term numbers will be expected to fall, in line with the historic pattern. If the policy interest were to be to trace the development of income of people who started any given period as members of agricultural households, some attempt would have to be made to retain these in the group. For example, the households which are most successful in diversification into non-agricultural activities can be expected sooner of later to fall outside the agricultural group and to join some other. Under the present arrangement, farmers who face a fall in their income from farming will eventually be excluded from the agricultural category as their welfare transfers grow in relative importance. Thus when commenting on income developments over time, changes in the composition of the group of agricultural households must be borne in mind.
2.6 Examples of the impact of alternative definitions of the agricultural household
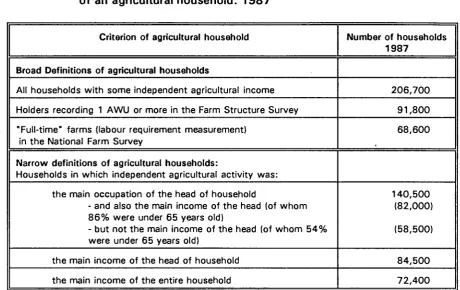
Table 1 Ireland: Numbers of households resulting from alternative definitions of an agricultural household. 1987
Criterion of agricultural household
Broad Definitions of agricultural households
All households with some independent agricultural income
Holders recording 1 AWU or more in the Farm Structure Survey
"Full-time" farms (labour requirement measurement) in the National Farm Survey
Narrow definitions of agricultural households:
Households in which independent agricultural activity was:
the main occupation of the head of household
- and also the main income of the head (of whom 8 6 % were under 65 years old)
- but not the main income of the head (of whom 5 4 % were under 65 years old)
the main income of the head of household
the main income of the entire household
Number of households
1987
206,700
91,800
68,600
140,500 (82,000)
(58,500)
84,500
72,400
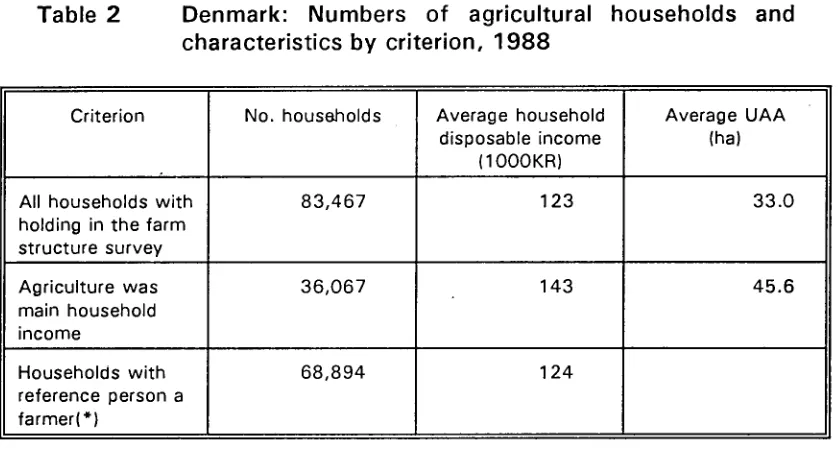
2.6.2 Results for Denmark from using alternative bases for classifying households as agricultural in 1988 are shown in Table 2. It should be recalled that here the definition of "household" was narrower than the TIAH target, consisting only of the couple and dependent children; however, this discrepancy was not felt to be of great importance. The use of a reference person system (income based) clearly caused more households to be brought into the category of agricultural households than did a household income criterion, though not to the extent of covering all households associated with a holding in the Farm Structure Survey. Moreover, the average household disposable income was lowered. This effect is compatible with these additional households having smaller incomes and, very probably, smaller farms. The differences between household numbers and average incomes are much greater than was experienced in Ireland (where the main impact was caused by moving from an income-based system for a reference person to a main-occupation based system, again using a reference person). However, 1988 was a year in which the income from Danish farming was particularly low. The way in which these low incomes may have affected numbers and income levels produced by the alternative classification systems is explored further in the country-by-country section of this report.
eliminated from being classed as "agricultural" by using a main-income definition for a single year (1985), but this left considerably more than in the very poor farming year of 1988. Though not shown by the Table, the largest reduction was among cereal farms and the smallest in cattle farming, a finding which is compatible with the association commonly seen between levels of pluriactivity and farming types. Overall, a further 6 percent were excluded by applying the income criterion for t w o successive years; the average household disposable income, already marginally higher from applying the criterion once, saw a further small increase. As would be expected, the average size of holdings followed a similar pattern.
Table 2 Denmark: Numbers of agricultural households and characteristics by criterion, 1988
Criterion
All households with holding in the farm structure survey
Agriculture was main household income
Households with reference person a farmer!*)
No. households
83,467
36,067
68,894
Average household disposable income
(1000KR)
123
143
124
Average UAA (ha)
33.0
45.6
[image:34.595.105.524.244.472.2]Note: (*) households where the person with the highest gross income has agriculture as his or her industry and employment status as self-employed (independent).
Table 3 Denmark: Numbers of households and characteristics by criterion, 1985 and 1986
Criterion
Households with a holding in the farm structure survey
Agriculture was main household income in 1985
Agriculture was main household income in 1985 and 1986
No. households
90,722
48,293
42,307
Average disposable
income (1000KR)
79
84
86