RESEARCH ARTICLE
10.1002/2016GC006471
Strain localization in polycrystalline material with second phase
particles: Numerical modeling with application to ice mixtures
D. Cyprych1, S. Brune2, S. Piazolo1, and J. Quinteros2
1Department of Earth and Planetary Sciences, Australian Research Council of Excellence for Core to Crust Fluid Systems/
GEMOC, Macquarie University, New South Wales, Australia,2GFZ German Research Centre for Geosciences, Potsdam, Germany
Abstract
We use a centimeter-scale 2-D numerical model to investigate the effect of the presence of a second phase with various volume percent, shape, and orientation on strain localization in a viscoelastic matrix. In addition, the evolution of bulk rheological behavior of aggregates during uniaxial compression is analyzed. The rheological effect of dynamic recrystallization processes in the matrix is reproduced by vis-cous strain softening. We show that the presence of hard particles strengthens the aggregate, but also causes strain localization and the formation of ductile shear zones in the matrix. The presence of soft par-ticles weakens the aggregate, while strain localizes within the parpar-ticles and matrix between parpar-ticles. The shape and the orientation of second phases control the orientation, geometry, and connectivity of ductile shear zones. We propose an analytical scaling method that translates the bulk stress measurements of our 2-D simulations to 3-D experiments. Comparing our model to the laboratory uniaxial compression experi-ments on ice cylinders with hard second phases allows the analysis of transient and steady-state strain dis-tribution in ice matrix, and strain partitioning between ice and second phases through empirical calibration of viscous softening parameters. We find that the ice matrix in two-phase aggregates accommodates more strain than the applied bulk strain, while at faster strain rates some of the load is transferred into hard par-ticles. Our study illustrates that dynamic recrystallization processes in the matrix are markedly influenced by the presence of a second phase.1. Introduction
Many large-scale geological processes, such as plate tectonics and mountain building, are controlled by the properties of the ductile flow of the crust and mantle, which are predominantly composed of polymineralic rocks. Increasingly sophisticated numerical models are used to advance our understanding of these tectonic processes; however, their accuracy is highly dependent on the use of realistic flow laws that link stresses to strain rates at a given temperature. In most lithospheric-scale numerical models rheological behavior of pol-ymineralic rocks is represented by single phase flow laws assuming that the weakest or most abundant material controls the bulk rheology [e.g.,Weinberg et al., 2007;Rosenbaum et al., 2010;Brune et al., 2014]. Some models use a laboratory-determined flow law for polymineralic rocks like granite, diabase, or gabbro [Lavier and Manatschal, 2006;van Wijk and Blackman, 2007], while a very recent lithospheric-scale numerical modeling study suggests strong control of bimineralic heterogeneities on fault and shear zone evolution during rifting [Jammes and Lavier, 2016].
It is well accepted that in two phase aggregates the bulk viscosity of the dominant phase is significantly affected by second phases [Handy, 1990;Tullis et al., 1991;Renner et al., 2007; Montesi, 2013;Cook et al., 2014;Jammes et al., 2015]. However, the partitioning of strain in polyphase aggregates is difficult to predict. In the case of monomineralic rocks, it is assumed that, depending on deformation conditions, i.e., tempera-ture, pressure, and bulk stresses or strain rates the mechanisms governing the deformation are either elasto-plastic (brittle) or viscoelastic (ductile). In the latter case, strain is distributed relatively homogenously. Some heterogeneity in strain distribution may exist in a monomineralic material deforming in a ductile manner by crystal-plasticity, especially if the material is highly anisotropic [e.g.,Piazolo et al., 2013]. However, such het-erogeneities are continuously being reduced by ongoing recrystallization processes. In contrast, in polymi-neralic rocks extensive discrepancies in strain distribution can occur that may result in complex deformation behavior. For example, in polymineralic rocks one phase can show viscous behavior, while the other
Key Points:
A 2-D numerical model is used to study the interaction of a power law matrix with soft and hard particles under compression
Stresses of two-phase aggregates are affected by rheology, shape, orientation, and grain size of the particles
A method of comparing 3-D laboratory experiment and 2-D numerical model has been developed and successfully applied
Supporting Information: Supporting Information S1
Correspondence to: D. Cyprych,
Citation:
Cyprych, D., S. Brune, S. Piazolo, and J. Quinteros (2016), Strain localization in polycrystalline material with second phase particles: Numerical modeling with application to ice mixtures,
Geochem. Geophys. Geosyst.,17, 3608– 3628, doi:10.1002/2016GC006471.
Received 3 JUN 2016 Accepted 16 AUG 2016
Accepted article online 19 AUG 2016 Published online 13 SEP 2016
VC2016. American Geophysical Union. All Rights Reserved.
Geochemistry, Geophysics, Geosystems
deforms in the brittle regime [e.g.,White and White, 1983;Simpson, 1985; Tullis and Yund, 1992;Jammes
et al., 2015]. In addition, there may be a large viscosity difference between the phases representing
visco-elastic behavior. In the latter case, strain is not distributed homogenously at the microscale in the aggre-gate, but localizes in the rheologically softer phase [Handy, 1990]. Localized microscale strain may lead to the development of meso and crustal-scale shear zones. As these zones are believed to govern the overall rheological behavior within the crust and mantle [Rutter, 1999], an in-depth understanding of strain localiza-tion processes and a realistic numerical representalocaliza-tion of polyphase rocks is of fundamental importance for large-scale geotectonic modeling.
The most important variables controlling the strain distribution in polymineralic rocks are, next to the defor-mation conditions, the volume percentage of the phases, their grain size, and grain-size distribution, grain shape, and relative strength of the minerals [Tullis et al., 1991;Bons and Cox, 1994;Heilbronner and Bruhn, 1998;Handy et al., 1999;Ji, 2004;Takeda and Griera, 2006;Gerbi, 2012;Czaplinska et al., 2015;Gerbi et al., 2015]. These factors are further modified by the chemical and metamorphic reactions between the phases [e.g.,Brodie and Rutter, 1987]. This complexity of natural polymineralic systems and the limited data on the mechanical properties of the varied phases makes them difficult to represent numerically. One way to obtain valuable rheological data for polyphase systems is to conduct laboratory deformation experiments on well-characterized polymineralic samples and record the stress and strain rate relationships during defor-mation. In addition, through the examination of starting and final microstructures of experimentally deformed materials, the experiments provide valuable information about the processes governing deformation.
Commonly, such experiments are uni and triaxial compression experiments conducted at constant displace-ment rate or constant load on poly and monomineralic samples [Tullis and Yund, 1977;Kronenberg and Shelton, 1980; Shea and Kronenberg, 1992; Tullis and Wenk, 1994; Gleason and Tullis, 1995; Piazolo et al., 2013]. A number of laboratory experiments with natural and analogue materials are used to characterize rheological properties of matrix containing soft [Wilson, 1983; Tullis and Wenk, 1994;Holyoke and Tullis, 2006a] and hard second phases [Hooke et al., 1972; Durham et al., 1992;Renner et al., 2007;Austin et al., 2014;Cyprych et al., 2016]. The major disadvantage of the experimental studies is the inability to monitor the changing microstructure, the interaction between the phases, and their response to imposed stress at various stages of the deformation, without terminating the experiment. In addition, for practical reasons, laboratory tests must be performed at conditions that do not necessarily represent the conditions prevailing in Earth [e.g.,Paterson, 1987].
To overcome the latter limitation, a numerical model simulating polymineralic deformation can be utilized. Such a model also has the advantage that the strain distribution between the phases at each stage of the deformation can be visualized and quantified. However, numerical simulations usually require a simplifica-tion of the sample microstructure and mineral properties. Therefore, to ensure validity of the simulasimplifica-tion, the model needs to be verified against experimental results. To date, there have been limited attempts to numerically model experimentally derived microstructures [Tullis et al., 1991;Bons and Cox, 1994;Ji, 2004;
Piazolo et al., 2004;Montagnat et al., 2011;Cook et al., 2014;Herwegh et al., 2014;Cross et al., 2015;Piazolo
et al., 2015]. Those that concern deformation microstructures focused either on the high-strain, steady-state
stage of deformation, or the initial low-strain response. As the rheological response of rocks often changes with strain, such models fail to take the full rheological behavior into account. Consequently, a more sophis-ticated numerical approach, including the elastic and viscoplastic response of the rock, strain-dependent hardening, and softening is needed to represent the dynamically changing microstructure. A good example of such approach is a recent numerical study ofJammes et al. [2015], in which the semibrittle behavior of quartz-feldspar aggregates was investigated. Their results, however, were not explicitly compared to labora-tory deformation experiments.
In the following, we present a numerical model, which allows investigation of elastoviscoplastic polyphase materials in terms of rheological response before, at and after a rheological near steady-state is reached. At the same time, the model permits visualization of the dynamics of strain and stress characteristics at the microscale. We utilize the FEM software Slim3D [Popov and Sobolev, 2008], which allows modeling of defor-mation processes involving an elastoviscoplastic rheology on geological time scales [Brune et al., 2012;
et al., 2015;Brune, 2016]. In addition, we develop a method of comparing the results of 3-D uniaxial com-pression experiments and their analog 2-D centimeter-scale numerical models.
In the first part of this contribution the model is used to study the impact of soft and hard second phases of different shape, grain-size distribution, and orientation on strain localization processes in an elastoviscous matrix and the bulk rheological response of the composite. In the second part, we apply the developed model to compression experiments of D2O ice with second phases [Cyprych et al., 2016]. The combination
of these two approaches enhances our in-depth understanding of the local and bulk rheological behavior of the matrix and second phases during progressive deformation.
2. Model Description
For this study, we use the geodynamic modeling software Slim3D [Popov and Sobolev, 2008], an Arbitrary Lagrarian-Eulerian, particle-in-cell, finite element code with a free surface.
2.1. Basic Formulas
Total deviatoric strain rate is described with the elastic (el), viscous (vi), and plastic (pl) components and can be written as follows:
_
eij5e_elij1e_ vi ij1_e
pl ij5
1 2G^sij1
1 2geffsij1c_
@Q @sij
(1)
whereGis the elastic shear modulus,^sijis the objective stress rate [e.g.,Bonet and Wood, 1997],geff is the
effective viscosity,c_ is the plastic multiplier, andQis the plastic potential function [e.g.,Simo and Hughes, 2006].
The effects of elastic compressibility and thermoelasticity are included in the model with the continuity equation, which is coupled with the constitutive equation for hydrostatic pressure:
Dp
Dt52K
_
h2aDT
Dt
(2)
wherepis the hydrostatic pressure,Kis the bulk modulus,ais the coefficient of thermal expansion, andTis the temperature.
The total viscous strain rate_evi
ij is decomposed into three temperature and stress-dependent creep regimes:
dislocation creep, diffusion creep, and Peierls creep. The corresponding effective creep viscosity is:
geff5 1
2sII e_L1e_N1e_PÞ
21
(3)
wheresIIis second invariant of effective deviatoric stress given by:
sII5
ffiffiffiffiffiffiffiffiffiffiffiffiffiffiffiffiffiffiffiffiffiffiffiffiffiffiffiffiffiffiffiffiffiffiffiffiffiffiffiffiffiffiffiffiffiffiffiffiffiffiffiffiffiffiffiffiffiffiffiffiffiffiffiffiffiffiffiffiffiffiffiffiffiffiffiffiffiffiffiffiffiffiffiffiffiffiffiffiffiffiffiffiffiffiffiffiffiffiffiffiffiffiffiffiffiffiffiffiffiffiffiffiffiffiffi
1
2 ðrxx2pÞ
21 1
2 ryy2p
2
11
2 ðrzz2pÞ
21r2
xy1r2xz1r2yz
r
wherepis pressure, ande_L,e_N;and_ePare the effective scalar strain rates due to linear (diffusion), nonlinear
(dislocation), and Peierls creep, respectively. In this contribution, we focus on the dislocation creep regime, thus,e_L, and_ePare set to zero.
The strain rate due to dislocation creep can be written as follows:
_
eN5ANðsIIÞnexp 2 Q RT
(4)
withANas material-dependent constant,Qas activation energy,Ras the gas constant, andnas power law
stress exponent.
processes may result in rock softening during deformation: (i) shear heating
[Kaus and Podladchikov, 2006], (ii)
dynamic recrystallization-induced grain-size reduction [White et al., 1980;
Handy, 1989] and a potential switch
from dislocation to diffusion creep
[Rybacki and Dresen, 2004;Austin and
Evans, 2009], (iii) melting [e.g.,
Zimmerman and Kohlstedt, 2004], or
(iv) chemical reactions [Rubie, 1983;
Brodie and Rutter, 1987]. In this contri-bution, we focus on modeling high temperature deformation without flu-ids and melt present and without change in deformation mechanism. Therefore, for simplicity, we use a strain-dependent parameterization of viscous softening; a behavior com-monly observed in dynamically recrys-tallizing materials [e.g., Piazolo et al., 2013].
We compute viscous strain by integrat-ing the second invariant of the devia-toric strain rate tensor through time. SLIM3D uses the marker-in-cell tech-nique to resolve the advection of material phases and field variables, such as accumulated viscous strainE: prior to solving the system of equa-tions, accumulated strain of all markers in the cell is averaged along with other variables to the cell center. All markers located inside of the cell are updated with the same increment of history, before they are advected with the mesh. Viscous softening is parameterized in relation toEby means of three scalars:E1,E2andS, whereE1andE2define at what strain the phase starts and stops to soften, respectively,
andSis the amount of softening modifying the material-dependent constantAN0. The operation can be defined
as a piecewise linear function where the preexponential factorAN(equation (4)) is equal to AN0at strains smaller
thanE1, linearly rising for strains betweenE1andE2, and equal toSANfor strains larger thanE2:
AN5 AN0
1 if E< E1
11 S21
E22E1
E2E1
ð Þ if E1<E< E2
S if E> E2
:
8 > > > < > > > :
(5)
Since the accumulated viscous strain is tracked through markers, spurious numerical diffusion is minimized allowing to generate shear zones with a typical width of 2–3 elements.
2.2. Model Setup
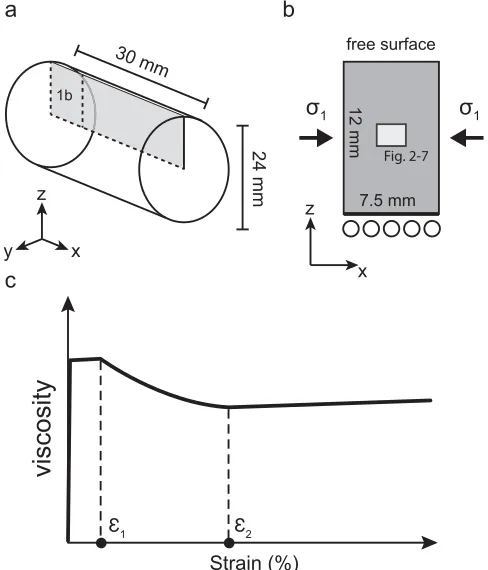
The model represents a 2-D plane that is shortened at constant velocity alongx-direction (Figure 1a-b). That is, thexaxis of the model is parallel to the main stress axisr1. Similar to constant displacement laboratory
[image:4.630.179.423.100.385.2]experiments, in the used numerical scheme shortening of the sample at constant velocity results in a gradu-al change in the axigradu-al strain rate during the experiment. The lower boundary is free slip with no through-flux or shear stress allowed. The upper boundary is a free surface and boundaries in the out of plane (y) direction are fixed. Thus, the model setup can be viewed as a 2-D representation of the upper half of a plane cutting through a 3-D cylindrical sample (Figure 1a). In accordance with typical uniaxial compression
Figure 1.Schematic illustration of model setup showing (a) two-dimensional area in the sample cylinder represented by the model; (b) model dimensions and boundary conditions; small, grey rectangle in the middle shows the 2-D area of the model represented in Figures 2–4, 6, and 7; arrows show compression axis (r1); (c) sketch of viscous strain softening which models the strain weakening resulting from the activity of dynamic recrystallization processes (see text for details). The amplitude of viscosity reduction is governed by the parameterS
experiments in the laboratory, the model dimensions are 7.5 mm length (x-direction), and 12 mm height (z -direction; Figure 1b). In the following no confining pressure is applied, however, it is possible to include it in the code for future applications. We chose a numerical cell size of 12.5mm to allow modeling of particles down to 25mm in diameter.
Separate flow laws can be applied to the matrix and second phase particles. These particles are distributed randomly in the matrix, while the long axis of the particles is oriented at a specific range of angles relative to the compression axis. We modified the code such that it allows computing circular, rhombic, and square/ rectangular second phases with various aspect ratios (AR). AR is defined as a ratio between the particle short (a) and long (b) axis, i.e., AR5a/b. It is also possible to define the grain-size range and grain-size distribution (using White Noise or Gaussian Noise) of particles.
To model the behavior of the viscoelastic matrix, we use the experimentally derived flow law of D2O ice
(supporting information Appendix A) and elastic constants of H2O ice [Gammon et al., 1983] (Table 1). We
use the elastic properties of calcite [Chen et al., 2001] and flow law of quartz [Gleason and Tullis, 1995] (Table 1), rendering hard inclusions essentially undeformable within the ice matrix. For a soft second phase, we use mica properties, i.e., elastic properties of muscovite [Vaughan and Guggenheim, 1986] and flow law of biotite [Kronenberg et al., 1990]. To model the overall rheological effect of dynamic recrystallization in a polycrystalline matrix, we implement viscous softening (equation (5), Figure 1c). The deformation conditions were adjusted to represent high temperature deformation: the model temperature is set to278C represent-ing a homologous temperature Thof 0.96. The compression velocity inx-direction (parallel tor1) was
cho-sen to obtain a starting axial strain rate of 131025s21or 2.531026s21.
We perform two numerical simulations sets. Set I investigates the effect of particle volume percent, particle shape, and particle orientation on bulk rheology and strain localization at high grade conditions. Set II applies the model to deformation experiments of ice mixtures, including a direct comparison to laboratory experiments byCyprych et al. [2016].
2.3. Terminology and Definitions
Variables that describe material deformation, such as strain, strain rate, and stress are defined at any element of the model. In contrast, we use the word ‘‘bulk’’ when referring to variables that describe deformation of the sample as a whole, such as bulk strain or bulk stress, which are usually measured in laboratory experiments. In order to compare these quantities to numerical simulations, we need to extract bulk stress from the numerical model, which is accomplished by integrating tractions along a lateral model boundary. We therefore also use the term boundary stress to refer to this numerical variable. The term ‘‘viscosity’’ is employed as an equivalent to the effective viscosity defined in equation (3), and with ‘‘viscous strain softening’’ we describe a parameter-ized dependency of the viscosity on accumulated viscous strain, as described in section 2.1.
2.4. 2-D Representation of 3-D Experiments
Most of the rheological data available from the experimental studies, including ice experiments, is derived from tests on cylindrical samples [e.g.,Durham et al., 1992;Tullis and Wenk, 1994;Gleason and Tullis, 1995;
Holyoke and Tullis, 2006a]. Cylindrical samples are generally easy to prepare by, for example, coring or press-ing the material into custom made molds. In addition, edge effects can be avoided when confinpress-ing pressure is applied. In order to compare 3-D laboratory experiments under uniaxial compression with 2-D numerical
Table 1.Elastic Constants and Flow Laws for Two-Phase Models
Phase
Elastic Parameters Flow Laws Viscous Softening
Bulk ModulusK(kbar)
Shear Modulus
G(kbar) n
log10A (Pa2n
s21
) Q (kJ mol21
) E1 E2 S
Ice matrix 90.14a 35.6a 2.77 0.82 117.9 0.025 0.16 2.9
Rigid second phase 760b
328b
4c
228 223c
Soft second phase 500d 440d 18e 226.19e 51e
a
FromGammon et al. [1983], recalculated to2108C. b
FromChen et al. [2001]. c
FromGleason and Tullis[1995]. d
Vaughan and Guggenheim[1986]. e
models of plane-strain compression, we first have to quantify the relation between the resulting stresses in both setups [e.g.,Tullis et al., 1991;Ranalli, 1995;Gerya, 2009].
To this aim, we derive an analytical formulation for (1) the relationship between stress and strain rate and (2) the effective viscosity of a power law material that is deformed under both configurations. The resulting ratio R relates peak stresses modeled in the 2-D plane-strain setup to stresses recorded during 3-D uniaxial compression experiments. Our theoretical considerations (supporting information Appendix B) allow us to determine a constant ratioRthat is notably independent of the applied strain rate:
R54
3
ffiffiffip3
2
n21
n
ð Þ
(6)
For example,Requals 4/3 for a matrix stress exponentn51. That is, the numerically derived stresses using a 2-D representation are expected to be 1.33 times the recorded stresses from 3-D laboratory experiments, if Newtonian flow is assumed. For non-Newtonian deformation,Rdecreases with increasing stress exponent
n(supporting information Appendix B Figure 1 and Table 1). For a typical non-Newtonian stress exponent ofn53, R is equal to 1.21.
2.5. Model Limitations
As the model is a 2-D representation of a 3-D sample, we are not able to include the 3-D characteristic of second phases and their spatial arrangement into the numerical results. In this contribution, we consider a varied shapes of second phases and their effect on rheology of the aggregate. However, due to a lack of a third dimension the rheological effect of the particles can be overestimated, especially for minerals of iso-tropic shape, such as garnets.
In the current model, no chemical reaction between matrix and particles is allowed. Changes in deformation regime, for example, from dislocation to diffusion creep, with progressive deformation are not considered in this study, though there are possible to model. While the overall rheological effect of dynamic recrystallization in a polycrystalline matrix is represented by viscous softening (Figure 1c, equation (5)), the heterogeneity at the scale of the microstructure, e.g., grain size and grain orientation, is not taken into account. Such heterogeneity is important at the microscale, as, due to viscoplastic anisotropy of ice crystals, the variation in grain crystallo-graphic orientations causes stress and strain heterogeneity in polycrystalline samples that is necessary for the onset of recrystallization [Piazolo et al., 2015]. Local strain amplitudes in ice can be as high as 10 times the mac-roscopic strain [Grennerat et al., 2012]. In single-phase models without inclusions, the lack of the microstructural heterogeneity in the matrix results in a uniform strain distribution. Therefore, strain softening is activated in every cell in the matrix at certain bulk strain. This results in an abrupt beginning and end of strain softening stage and angular shape of the stress-strain curves for matrix-only models (cf. Figure 2a). This limitation is mini-mized when modeling the behavior of mixtures, as the presence of second phases introduces heterogeneity into the numerical microstructure. Stress concentrations develop between two or more grains leading to ele-vated strains and thereby generate a weaker matrix in response to strain softening. Consequently the shapes of stress-strain curves of two-phase models are more similar to laboratory data (cf. Figure 6). As mentioned before, in our models we apply strain-dependent softening to investigate behavior of dynamically recrystalliz-ing matrix material durrecrystalliz-ing constant displacement uniaxial compression experiments. An alternative parameteri-zation could be to implement stress-dependent softening, i.e., reducing the strength of the rock as a function of deviatoric stress. This might affect the specific strain distribution within individual shear zones; however, shear zones will still form in the same places, since locations of high strain and of high stress coincide.
It should be noted, that we do not simulate separately the rheological effect of individual recrystallization processes such as nucleation, subgrain rotation or grain boundary migration [e.g.,Drury and Urai, 1990;
Piazolo et al., 2001] that arise from a heterogeneous microstructure. Hence, no true microstructural
develop-ment in terms of grain boundary network changes is being modeled.
3. Numerical Set I: Effect of Second Phase Particles on Rheological Behavior and
Strain Localization
resulting bulk stress measured at the boundary. In the presented numerical simulations, we keep the parameters describing the matrix flow, including the viscous softening parameters, constant.
3.1. Effect of Volume Percentage of Second Phases
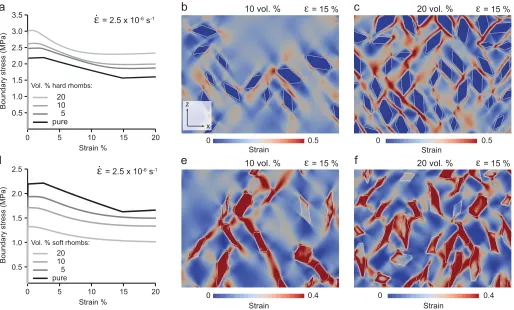
We conduct numerical experiments with a matrix containing 0, 5, 10, and 20% hard and soft second phase particles. The particles are rhomb shaped with a fixed AR of 0.5 and a long axis between 150 and 355mm. Particles are initially randomly distributed and oriented. The bulk stress-strain relationships and distribution of strain in the matrix in two-phase models are compared with those of matrix phase only (Figure 2). The addition of 5, 10, and 20% of hard second phase particles increases the peak stresses by 13, 20, and 38%, respectively; and steady-state stresses increase by 12, 15, and 25%, respectively (Figure 2a). The strain values at peak stress and beginning of near steady-state decrease with increasing volume of second phases (Figure 2a). Also, the transitions to strain softening and steady-state stages are not as abrupt as in case of matrix only model (Figure 2a). At 15% shortening, strain localizes in the matrix in proximity of the second phases (Figure 2c). In high-strain bands, local strain can be much higher than bulk strain and reaches up to 0.5. In models with 10% second phases, strain localizes within the matrix at the tips of the isolated second phase rhombs, and in narrow, discontinuous high-strain bands between neighboring second phases (Figure 2b). In models with 20% second phase, strain is highly localized into a few continuous, and several discontinu-ous high-strain bands oriented at 45–558tor1, which develop between second phases (Figure 2c).
[image:7.630.62.576.98.408.2]For models with soft, rhombic second phases, the addition of 5, 10, and 20% second phase decreases peak stresses by 13, 25, and 43%, respectively, while steady-states stresses decrease by 11, 22, and 43%, respec-tively (Figure 2d). Again, the strain value at peak stress decreases with increasing volume of second phases, however none of the two-phase models reaches rheological near steady-state, before the experiment fin-ishes (i.e., at 20% strain). At 15% in models with 10% soft particles, high-strain bands oriented 55–608tor1
develop in the particles and in the matrix between the particles (Figure 2e). Matrix distant from any particles shows homogenously distributed strain (Figure 2e). In models with 20% soft second phases, developing high-strain bands within the matrix are shorter, thinner, and more continuous than in the matrix with 10% soft second phase (Figure 2f). They are oriented 50–558tor1.
3.2. Effect of Particle Shape
The effect of second phase shape on the stress value and stress distribution in the matrix is tested by changing the shape of the inclusions, but keeping the particle volume percent and grain size constant. We consider circular, square, rectangular, and rhombic shapes of the second phase. Circles have diameters in the range of 155–355mm, rhombs have their long axis in the range of 155–355mm and fixed AR of 0.5. The long axis of the rectangles is set to a range between 155 and 355mm with AR fixed to either 1 (squares) or 0.5 or 0.2. Initially, second phases are oriented and distributed randomly.
There are only small variations in boundary stress between the aggregates with hard circular, square, and rhombic second phases (Figure 3a). In aggregates with circles, boundary stress values are the lowest, fol-lowed by stresses of the matrix with squares, rhombs, and rectangles (AR50.5). The models with rectangles of AR 0.5 show stresses approximately 5% higher than those in matrix with circles (Figure 3a). Aggregates with rectangles with AR of 0.2 show 18% higher stresses than those with circles (Figure 3a). Although the variation in shape and aspect ratio affects the stress values of the aggregate, it neither delays nor advances the strain weakening and transition into the near steady-state (Figure 3a).
To better understand the link between particle shape, aspect ratio, and aggregate stresses, we study in detail the strain distribution in the matrix and second phases at 15% shortening (Figures 3b–3f). All the models show similar strain distribution in the matrix, i.e., part of the strain is localized in high-strain bands oriented at 50–558tor1with some areas of matrix deforming homogenously, and some areas not
deform-ing, usually localized in strain shadows, in direct vicinity to particles. In the model with circles there are only a few discontinuous, and relatively wide, high-strain zones within the matrix (Figure 3b). Similarly, in models with squares only a few high-strain bands develop, however they are more continuous and narrower (Figure 3c). Multiple narrow high-strain bands develop in models with rhombs and rectangles, where both have an AR of 0.5 (Figures 3d and 3e). With decreasing aspect ratio of the rectangles, the high-strain bands in the matrix become narrower and more discontinuous (Figure 3f).
We performed the same models using soft second phases (Figures 3g–3l). Here, there are small variations in stresses between the models with squares, rhombs, and rectangles with AR of 0.5 (approx. 6% difference; Figure 3g). However, the model with soft circles shows 11% higher peak stresses and 17% higher steady-state stresses than that with rhombs (Figure 3g). The lowest stresses can be observed in models with low AR (<0.2) rectangles. This trend is opposite to the trend observed for the models with hard particles (Figure 3a).
At 15% shortening the strain localizes preferentially in the soft phase resulting in the distortion of the par-ticles shape (Figures 3h–3l). In some cases only the edges of soft parpar-ticles localize a large amount of strain, while centers are weakly deformed (Figure 3h). In addition, isolated soft particles, i.e., those not in the prox-imity other particles, accommodate little strain. The model with circles (Figure 3h) shows a relatively high number of weakly deformed soft particles and strain is localized in high-strain bands oriented about 458to
r1 that develop in row of now elongated particles and matrix between the circles. In the models with
squares, rhombs, and rectangles with AR of 0.5 (Figures 3i–3k) a thinner high-strain bands develops and number of soft particles defining these bands is larger than that in the model with circles (Figures 3i–3k). The orientation of majority of high-strain bands in these models changes to about 508tor1. In case of
rec-tangles with AR<0.2 (Figure 3l), almost all particles are incorporated into a network of irregular, thin high-strain bands without a clear preferred orientation towardr1.
3.3. Particle Orientation
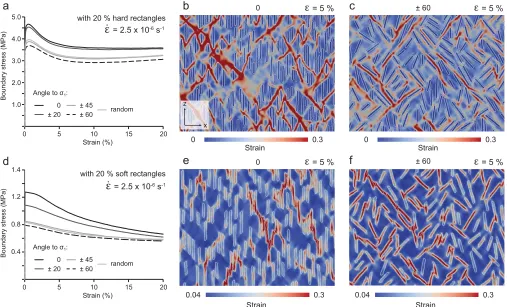
Here we use hard and soft rectangles with long axes in the range of 150–355mm and a fixed short axis of 30mm. We compare models with rectangles oriented perpendicular tor1(parallel to model z-direction;
Figures 1b and 4) with models with rectangles oriented620, 45, 608, and randomly toz.
In the model with hard rectangles, the variation in orientation affects the stresses through the whole period of the experiment (Figure 4a). The model with hard rectangles oriented perpendicular tor1(08toz) is the
strongest, while the model with rectangles deviated6608fromzis the weakest, i.e., bulk stresses are high-est and lowhigh-est, respectively (Figure 4a). The difference in stress between these two models equals 21% (Figure 4a). At 5% shortening, when particles are oriented perpendicular tor1(08toz), strain is localized in
several discontinuous relatively wide high-strain bands in the matrix (Figure 4b). However, some matrix areas surrounding groups of particles may remain undeformed. High-strain bands feature a mean angle of about 55–658with respect tor1(Figure 4b). In the model with hard particles oriented6608toz, strain is still
localized in high-strain bands in the matrix, however, bands are narrower and more uniformly distributed between second phases (Figure 4c). Undeformed areas in the matrix are scarce and high-strain bands feature a mean angle of about 45–508with respect tor1(Figure 4c).
Soft particle orientation has a significant impact on peak stress values; however, this impact diminishes with increasing strain (Figure 4d). Again, the model with particles oriented perpendicular tor1(parallel to z) is
the strongest, while the model with particles deviated6608fromzis the weakest (Figure 4d). The differ-ence in maximum stress value between the two is 38%. At 5% shortening, in the model with particles ori-ented perpendicular tor1, strain is highly localized in a few discontinuous high-strain bands that develop in
rows of soft particles (Figure 4e). The high-strain bands are oriented 70–758tor1. Little strain is
[image:10.630.63.570.389.696.2]accommo-dated by the matrix and soft particles not involved in the high-strain bands are only weakly deformed
(Figure 4e). Where the particles are randomly oriented between6608toz, strain is still preferably localized in soft particles, however, a larger number of particles accommodate the strain (Figure 4f). Also, less strain is accommodated by the matrix. In contrast to the previous case, the orientation angle of the high-strain bands is roughly 458(Figure 4f).
4. Numerical Set II: Application to Deformation Behavior of Ice Mixture
Experiments
In the Numerical Set I, we examined strain distribution and rheological response in theoretical examples of matrix with soft and hard second phases of different shape, grain-size distribution, and orientation. In the Set II models, we apply the conditions and matrix-particle characteristics following those from laboratory experiments ofCyprych et al. [2016]. This allows us to evaluate the robustness of the model results as well as the necessary changes to softening parameters needed to reproduce the experimental results.
4.1. Summary of Laboratory Experiments
Recently,Cyprych et al. [2016] conducted a series of high-temperature uniaxial compression experiments on D2O ice with hard calcite particles of isotropic shape to study the effect of the presence of the second
phases on the deformation mechanisms and recrystallization processes in the ice matrix. Using a neutron diffraction facility, they recorded crystallographic-preferred orientation (CPO) and grain-size evolution of the ice matrix, along with the mechanical data, at incremental strain steps of0.6% strain up to 20% short-ening. This continuous recording of data had the advantage over previous experiments, which recorded only initial and final stages, and allowed assessment of the relationships between the changing microstruc-ture, CPO, and rheology of the matrix containing hard second phases.
Two calcite grain size ranges were used: 150–355mm and<150mm. Particles were randomly distributed and oriented in the ice matrix. Cylindrical samples were deformed under uniaxial compression withr1
paral-lel to the long axis of the sample cylinder. Experiments were performed at two constant displacement rates, to axial strains of 10 and 20%. The displacement rate was calculated to obtain a starting strain rate of 2.5
31026and 1.031025s21. The experimental temperature was set to278C, close to D2O melting point.
From their experimental study,Cyprych et al. [2016] conclude that, at the applied temperatures and strain rates, in all the tested samples, ice deforms in the dislocation creep regime through slip on basal (0001) planes in the<11–20>direction and, thus, samples deform under power law behavior. Strain is predomi-nantly accommodated by grains oriented favorably for slip, i.e., with c-axis (pole to (0001)) oriented about 458 tor1. Grains unfavorably oriented for slip undergo strain hardening. This single-slip behavior causes
large strain heterogeneities in the ice matrix. The heterogeneities are accommodated by dynamic recrystal-lization processes, including nucleation and strain-induced grain boundary migration (GBM), with the latter increasing the area of grains with c-axis oriented about 458tor1at the expense of grains accumulating
dis-locations. These two recrystallization processes cause strain weakening i.e., viscous softening within the deforming ice matrix, but their extent and efficiency is affected by the presence of second phases. GBM of ice is partially hindered due to pinning of the grain boundaries. In addition, high stresses at the ice-calcite grain boundaries promote nucleation of new grains. The modification of the activity of dynamic recrystalli-zation processes in matrix with second phases results in a weaker CPO in two-phase samples while com-pared to ice matrix-only sample. The authors speculate that load transfer onto hard second phases may also play a role in the bulk rheological behavior and further reduce the CPO as some of the stress is removed from ice. Importantly, a detailed monitoring of developing CPO shows that a weaker CPO in ice-calcite samples has formed without a change in deformation mechanism in the ice matrix.
4.2. Numerical Representation of the Laboratory Experiments
the natural habit of calcite crystals. The rhombs have diameters of 155–355 and 50–155mm, and a fixed AR of 0.5. Within these bounds, the grain size is varied using a white noise distribution. Flow laws and elastic parameters used in this set of models are the same as in Numerical Set I and are listed in Table 1.
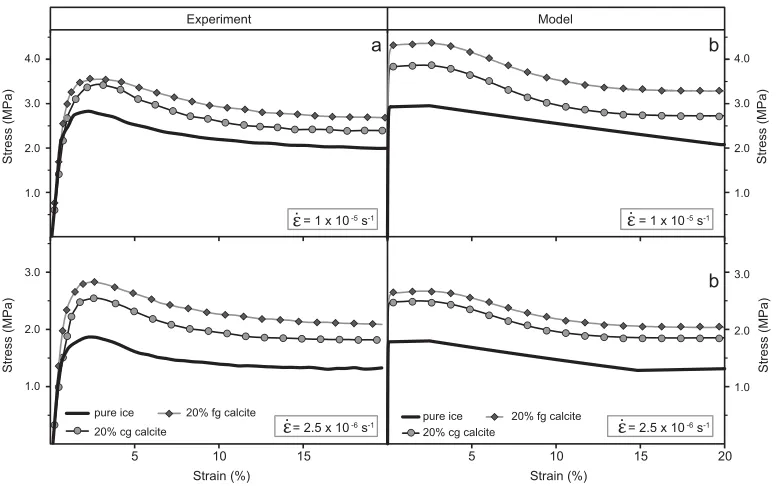
The general rheological effect of dynamic recrystallization processes in the ice matrix is again simulated using the three viscous softening parameters (equation (5), Figure 1c). However, comparison of stresses in the model with 20% hard rhombs in section 3.1 (Figure 4a) with the experimental stresses (Figure 5a) shows that viscous softening determined for pure ice models does not represent accurately the recrystallization processes in the ice matrix for two-phase aggregates. First, the modeled strain values at peak stress and the beginning of near steady-state are lower than the experimental values. Second, the ratio between peak stress and steady-state stress is different. Thus, viscous softening parameters in ice needed to be adjusted to correctly represent the rheological behavior of the ice mixtures. The calibrated viscous softening parame-ters are listed in Table 2. Notably, these parameparame-ters vary between different types of aggregates.
4.3. Stress-Strain Relationships
[image:12.630.190.578.97.340.2]We first compare the experimental and modeled stress-strain curves at the applied strain rates (Figures 5a and 5b). All the modeled stresses were divided by R51.22 to compensate for the difference between plane strain and the experimental uniaxial compression setup based on a stress exponentnof 2.77 (section. 2.3; supporting information Appendix B, Table 1). The ratio between the experimental and modeled two-phase
Figure 5.Comparison between laboratory derived and modeled stress-strain relationships; (a) laboratory experiments (pure ice:Piazolo et al. [2013]; ice mixtures:Cyprych et al. [2016]); (b) Numerical Set II results; note modeled stresses were recalculated by dividing the result byR51.22 (see section 2.4 for further explanation). cg: coarse-grained, fg: fine-grained,_e:- starting axial strain rate.
Table 2.A Summary of Viscous Softening Parameters Determined for Pure Ice and Ice-Mixtures
Second Phase Viscous Softening Parameters
Experiment Strain Rate (s21
) Vol. % Type Grain Size (mm) E1 E2 S
CC_05
2.531026 20 Isotropic-hard
150–355 0.10 0.18 3.3
FC_07 <150 (50–150)a
0.10 0.30 3.4
MD3 Pure 0.025 0.16 2.9
CC_06
131025 20 Isotropic-hard
150–355 0.10 0.20 3.6
FC_01 <150 (50–150)a
0.10 0.30 3.5
MD22 Pure 0.025 0.22 3.2
a
[image:12.630.182.586.656.739.2]aggregate differs from 1.22, especially for the strain rate of 131025s21(Figure 5). However, the ratio
between the peak stress and steady-state stress in experiments and models is identical. Also, the strain val-ues at peak stress and at the beginning of the steady-state stress are the same.
The largest discrepancy in experimental versus numerical boundary stress can be seen at the stage of experiment preceding the peak stress, i.e., elastic response and strain hardening in experimental samples are different to the modeled results (Figure 5). In the experimental ice samples deformed at high tempera-tures the initial, exclusively elastic response is very short, as ice slip systems and recrystallization processes begin almost instantaneously [Piazolo et al., 2015]. However, in the presented numerical models strain soft-ening that represents these processes is only applied to the matrix after the peak stress is reached (i.e., usu-ally at 2–2.5% bulk strain). Consequently, different to laboratory experiments [e.g.,Durham et al., 1983;
Durham et al., 1992;Piazolo et al., 2013], our models show a purely elastic response at the beginning of
each simulation and then a period of almost constant stress until softening applies (Figures 5a and 5b). Therefore, the difference in the rheological behavior below 2.5% bulk strain between model and experi-ment can be directly related to the lack of some dynamic recrystallization at small strains in the numerical model. In the following, since the model does not encompass this complex behavior, we do not discuss stress and strain distribution below 2.5% strain.
4.4. Strain, Strain Rate, and Viscosity Distribution in Ice-Calcite Aggregates
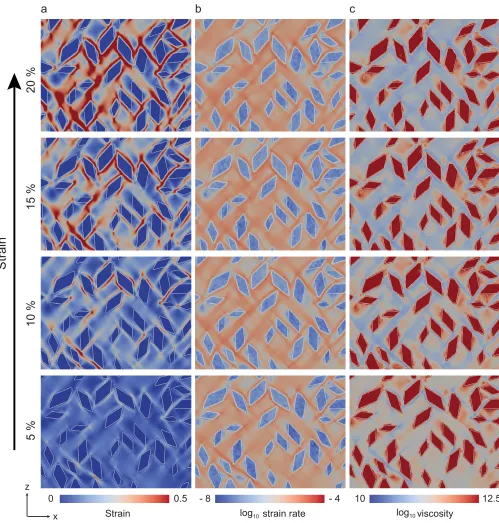
In models with coarse and fine-grained calcite particles, strain localizes in the ice matrix while second phases remain undeformed (Figures 6 and 7). Areas of strain localization are characterized by relatively fast strain rates and low viscosity (Figures 6 and 7). After 5% shortening, strain localizes in the matrix adjacent to second phase particle tips and propagates along the edge of the particle (Figure 6a). With progressive shortening, initially narrow high-strain bands form (Figure 6a). Subsequently, more high-strain bands nucle-ate and the preexisting ones widen (Figure 6a). At 20% shortening strain is localized in a network of anasto-mosing high-strain bands oriented at 508 to r1 located predominantly in narrow passages between
second phases (Figure 6a). During the first 10% shortening, strong strain rate heterogeneity can be seen in the ice matrix (Figure 6b). However, with increasing strain and widening of the high-strain bands strain rate in the matrix becomes more evenly distributed (Figure 6b). A similar trend is observed for viscosity, where variations in viscosity decrease with strain (Figure 6c).
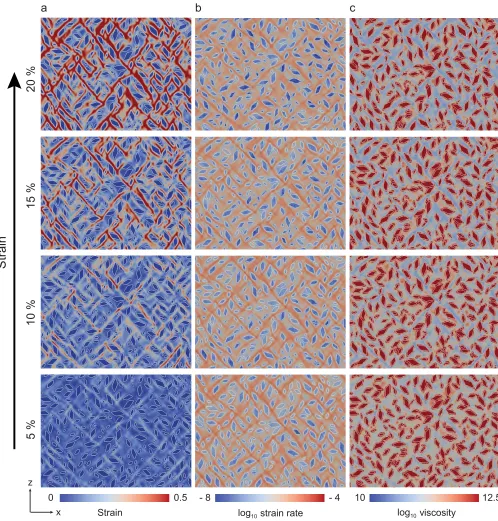
Reducing the grain size of the second phases affects the dynamics of strain localization. In the matrix with fine-grained calcite particles, a larger number of high-strain bands oriented at508tor1develop that are
characterized by high strain rates and low viscosity (Figure 7a). These bands are narrower than those in matrix with coarse-grained particles (Figure 7a). In addition, the strain rates in the high-strain bands contin-ue to be localized in bands of low viscosity at high strains (Figures 7b and 7c), in contrast to strain rates in matrix with coarse-grained hard second phases.
5. Discussion
5.1. Strain Distribution and Resulting Rheological Behavior in Two Phase Aggregates: Hard Second Phase
where increasing volume percent of hard second phases results in formation of high-strain bands (Figures 2b and 2c).
The distribution and geometry (i.e., angle tor1) of high-strain bands is affected by the shape and
[image:14.630.67.566.96.619.2]orienta-tion of the hard second phases (Figures 3b–3f, 4b, and 4c).Tullis et al. [1991] andTreagus[2002] investigat-ed the effect of the particle shape on stresses in the matrix, comparing square, and circular inclusions. Both studies found that hard square inclusions strengthen the aggregate more than circular inclusions. This is consistent with our results for hard particles in section 3.2 (Figure 3a). Higher stresses in square second
Figure 6.Numerical Set II: changes in strain distribution, strain rates and viscosity with increasing strain in ice with hard coarse-grained calcite particles, as bulk strain increases.r1is horizontal; starting axial strain rate is 2.531026
s21
phases originate from high stress concentration in the particle tips, where the corners interfere with the flow of the matrix [Tullis et al., 1991]. The orientation of high-strain bands at508 tor1, and not 458, is
forced by the presence of the hard particles. The interference of second phases and the matrix flow in high-strain bands is even larger for elongated hard particles, i.e., rhombs and rectangles, which are oriented ran-domly (Figures 3a and 3d–f). Elongated particles have a larger potential to be an obstacle for a developing high-strain band. Thus, they feature larger strain shadows, and also concentrate more stress than square or circular hard second phases (Figure 3a). Elongated hard particles force high-strain bands to form at 558to
[image:15.630.67.565.97.618.2]r1.Treagus[2002] studied the effect of particle ellipticity, i.e., aspect ratio of rigid circular particles on the
Figure 7.Numerical Set II: changes in strain distribution, strain rates and viscosity with increasing strain in ice with hard fine-grained calcite particles, as bulk strain increases.r1is horizontal; starting axial strain rate is 2.531026
s21
resulting stresses, and, as in our case, observed that in pure shear, elliptical clasts make stiffer mixtures than circular ones at the same volume fraction, especially in case of high particle to matrix viscosity ratios. Thus, we conclude that when a soft matrix-hard particle mixture is considered, the stress values increase with decreasing AR of particles.
The orientation of the hard elongated particles also affects the high-strain band formation. As previously mentioned, closely spaced hard particles promote strain localization, as the decreasing distance between the particles increases strain rate in the matrix. High-strain bands should predominantly form at458tor1
(e.g., Figure 6). Thus, if closely spaced elongated particles are oriented at similar angle tor1, high-strain
bands will not encounter any obstacles. However, if the particles are oriented at high angle tor1, as in our
example in Figure 4b, high-strain bands are forced to develop at higher angles tor1(i.e., 55–658). The
potential for blocking high-strain band development by the hard phase is high, thus, strain localizes in a network of short, discontinuous bands. This results in relatively high stresses in the aggregate (Figure 4a). Progressing randomization of hard particles decreases stresses (Figure 4a), as it provides more particles ori-ented preferably for the development of high-strain bands, i.e., at45-508tor1(Figure 4c). This probability
is lower for randomly oriented hard particles, which results in a stress increase (Figure 4a).
In terms of general rheological behavior, the matrix with hard particles shows a strain-dependent behavior close to a steady-state flow law (e.g., Figure 2a). Thus, such aggregates can be represented by composite/ modified power law flow laws. Similar results were obtained in previous numerical studies [e.g.,Takeda and Griera, 2006;Cook et al., 2014]. Our result is also in agreement with the experimental study ofCyprych et al. [2016], where the stress exponent values calculated for ice-calcite aggregates point to an upper bound for the dislocation creep field. However, since the heterogeneity of strain distribution and the potential for strain localization is higher than in ice-only aggregates, the stress exponent in ice-calcite aggregates is higher than in pure ice.
5.2. Strain Distribution and Resulting Rheological Behavior in Two Phase Aggregates: Soft Second Phase
The addition of soft second phases decreases bulk stresses and changes the strain distribution from homo-geneous, to localized into second phase. The effectiveness of strain localization depends on the viscosity contrast between the matrix and soft second phase [Takeda and Griera, 2006], the stress exponent of sec-ond phase [Montesi, 2013], and connectivity of soft second phases [Tullis et al., 1991;Gleason and Tullis, 1995;Holyoke and Tullis, 2006b;Montesi, 2013;Hunter et al., 2016]. An increase in the viscosity ratio enhan-ces strain localization in the softer phase [Takeda and Griera, 2006]. If the viscosities of the matrix and sec-ond phase are comparable (e.g.,Tullis et al. [1991] models), the strain rates in the matrix and the soft phase are comparable, thus, the potential for localization is low. However, changes in fabric, e.g., grain-size reduc-tion of the soft phase of similar viscosity to the matrix may increase the strain localizareduc-tion potential in the soft second phase [Montesi, 2013]. Phases with a high nonlinear rheology, such as micas, may cause a large increase in the potential for strain localization [Montesi, 2013]. Therefore, in our models, where n-value of second phase is high, we observe strong strain localization in the soft particles.
If there is no interconnection of soft phases, deformation of the aggregate involves the stronger matrix between the particles, and little strain is accommodated by the soft second phase [Tullis et al., 1991]. A good example of such behavior is a model ofCook et al. [2014], who analyzed a simplified two-phase steady-state microstructure of plagioclase matrix with a weak, anastomosing biotite foliation at highTand strain rates of 1024to 1026s21. They found strain rates in isolated biotite grains comparable to strain rates
The volume percent of particles is the first important factor affecting strength of the matrix with soft par-ticles. With increasing volume percent the distance between the soft particles decreases, thus, smaller areas of matrix are involved in the deformation. As more strain is localized in particles, the stress in the aggregate decreases (Figure 2d). At constant volume percent of particles, their shape and orientation can facilitate or hamper formation of interconnected high-strain bands. From Figures 3h–3l, we conclude that in case of ran-domly oriented particles, elongated shapes increase the connectivity, while those with an aspect ratio of 1 decrease it. Thus, the stresses observed for circles are largest, while those observed for rectangles with AR<0.2 are smallest. However, as in the case of the aggregate with hard particles, the overall stress will be lowest if high-strain bands are able to form in orientation of40–458tor1. Consequently, an aggregate
composed of elongated particles in close proximity to each other, oriented at high angle to minimum stress direction shows higher stresses than that with randomly oriented particles, as in former high-strain bands largely follow the orientation of soft particles, and form at 70–758tor1. The initial response of the
aggre-gate changes with increasing strain (Figure 4d), as at 20% shortening, particles are connected with a net-work of high-strain bands that develop in the soft particles and in the matrix between the particles.
The rheology of the aggregates with a soft second phase is characterized by progressive weakening with increasing strain, without a strain hardening phase (Figure 3g). This results from the fact that the soft phase (biotite), which accommodates most of the strain has a very high stress exponent (n518) [Kronenberg et al., 1990]. In the middle crust, biotite and other micas are considered to play a significant role in localizing the strain into shear zones, as they are weaker than quartz [Handy, 1990;Holyoke and Tullis, 2006b]. Accord-ingly, we suggest that our models with soft rectangles confirm the dominant nonlinear behavior of mica-bearing aggregates implied byMontesi[2013].
5.3. Strain Distribution in Ice-Calcite Mixtures
The simulation of the ice-calcite mixture is a valid representation of the experimental samples, despite its 2-D setup. In the numerical models, strain is localized in zones within the matrix oriented45–508tor1. In
real ice mixtures, these zones would correspond to areas of enhanced dynamic recrystallization. There is a large heterogeneity in strain accommodated by the ice matrix, with some areas accommodating almost no strain, while others accommodate as much as 0.5 strain after 20% shortening. The density of the high-strain band network, and the width of the individual bands, depends on the grain size of the hard particles, as this parameter controls the distance between the particles (Figures 6 and 7). However, it should be noted that the geometry of high-strain areas is simplified, as the heterogeneity of the microstructure, in terms of grain size and crystal lattice orientation and anisotropy of ice crystals at the microscale, is not explicitly taken into account.
The ratio between the experimental and modeled stress-strain curve (equation (6), Figure 5) provides infor-mation on the participation of phases in rheological response. The ratio is controlled by then-value of the phase actively accommodating deformation. Thus, a ratio close to theoreticalR(equal 1.22) for ice-calcite aggregates deformed at strain rate of 1026
s21
, suggests that second phases do not actively contribute to the overall deformation. However, ratios different toRfor sample deformed at 1025s21, especially in case
of the sample with fine-grained calcite particles, results from a clacite flow law contribution to the rheologi-cal response. As hard particles do not accommodate viscous strain, this contribution may be related to load transfer onto the hard particles, which is in agreement with the interpretation ofCyprych et al. [2016].
5.4. Effect of Second Phase Particles on Dynamic Recrystallization Processes: A Rheological Perspective
The necessity of applying different viscous softening parameters to ice-only, and ice-calcite numerical mod-els representing samples deformed in the laboratory, proves that the presence of second phases has a direct effect on the relative activity of the dynamic recrystallization processes in the ice matrix. This is in accordance with inferences from the laboratory data alone byCyprych et al. [2016]. At the same time, the variation in viscous softening parameters between the one and two-phase models, can be used as a meth-od of quantifying the increased or decreased amount of strain that has to be accommmeth-odated by the ice matrix, due to the presence of hard and soft second phases, respectively. Here, this approach was applied to quantify the response of the ice matrix to the presence of hard second phases.
pure ice. Therefore, in ice-calcite samples ice accommodates more strain than the bulk strain. In addition, the strain values defining the beginning and termination of the viscous softening need to be increased for two-phase aggregates, especially in those with fine-grained calcite (Table 2). In other words, strain induced weakening in ice matrix of two-phase samples is more prolonged than in pure ice; it takes a larger strain to reach a rheological steady-state.
The strain threshold at which the viscous softening occurs (E1andE2) in two-phase models, is very similar
at the two applied strain rates, implying that strain rate has little influence on the strain needed to reach rheological equilibrium. What is worth noticing, is the relative change in theSvalue between the aggregate with fine and coarse-grained calcite at slow and fast strain rate (Table 2). At the slow strain rate, the aggre-gate with coarse-grained calcite has a smallerSvalue than the aggregate with fine-grained calcite (that is the matrix weakens less), while at the fast strain rate, S is larger in aggregate with coarse-grained calcite then in the aggregate with fine-grained calcite (Table 2). In other words, at a strain rate of 1025s21in ice with fine-grained calcite some strain has been ‘‘removed’’ relative to ice with coarse-grained calcite. This support the interpretation that load transfer onto hard second phases occurs in this setup.
5.5. Implication for Geodynamic Models
Even though we have used ice as a matrix phase, our results can be applied to polymineralic rocks. Ice is a valuable rock analog, as it replicates the microstructural and fabric changes, as well as the non-Newtonian response of other nonlinear viscoplastic anisotropic minerals, such as olivine and quartz [Wilson et al., 2014]. Thus, an ice matrix with hard-isotropic and soft-anisotropic second phases can be used as an approximation of, for example, peridotites, and mica-bearing quartz-mylonites, respectively.
The presented approach can be scaled up to model and understand large-scale strain localization. For example, the network of developing high-strain bands in soft matrix with hard second phase aggregates closely resembles the geometry of anastomosing shear zones, at a meter to kilometer scale, such as those documented in granulites from the Kohistan Arc [Arbaret and Burg, 2003]. As the numerical model is scal-able from micrometer to kilometer scale, it is possible to model the rheological behavior of kilometer-scale heterogeneous rock units with a range of rheological ‘‘components.’’ Furthermore, our derived softening parameters (S,E1,E2) can be used to assign a lower bound on the amount of viscous softening
imple-mented in large-scale geodynamic modeling [Huismans and Beaumont, 2003;Lavier and Manatschal, 2006;
Brune et al., 2014]. Note however, that we cannot constrain the maximum amount of viscous strain
soften-ing, as we do not account for processes like pressure solution creep [Wheeler, 1992] and switching from dis-location creep to diffusion creep during dynamic recrystallization [Rybacki and Dresen, 2004; Austin and
Evans, 2009;Cross et al., 2015]. Ideally in the future the presented model can be expanded to include the
local evolution of the grain boundary network of matrix and second phases, allowing incorporation of the local effects of grain scale processes on microstructure and rheology.
In addition, presented results can be used to improve large-scale numerical models of the movement of ice sheets and glaciers, as we provide a new way to approach modeling the elastoviscoplastic behavior of ice and ice mixtures. Several field studies show that much of the internal deformation of ice masses occurs in impure ice layers, at the base of glaciers and ice sheets [e.g.,Hubbard and Sharp, 1989;Hubbard et al., 2009]. Therefore, the understanding of the rheology of ice layers containing other phases is crucial for predicting the small to large-scale flow and evolution of large ice masses.
6. Conclusions
We develop a robust centimeter-scale 2-D model that can be used to investigate strain localization and stress distribution in two-phase aggregates. The model is able to represent an elastoviscoplastic behavior from the undeformed state to high strains. The rheological effect of dynamic recrystallization processes is reproduced using viscous softening.
particles. Therefore, the lowest stresses are exhibited by an aggregate with elongated soft particles, orient-ed parallel to the direction of maximum shear stresses. Here, the importance of the effect of the shape, and orientation of soft particles, decreases with shortening and progressing strain softening of the ice matrix. In contrast, in aggregates with hard particles, the stresses are controlled by the second phase characteristics through the whole deformation period.
In addition, we have developed a method to directly compare stresses recorded during uniaxial compres-sion experiments on rock or ice cylinders with stresses calculated for 2-D models. We have applied this method to study the effect of rigid calcite particles on the strain, strain rate, and viscosity distribution, and related recrystallization processes in the ice matrix. Strain distribution in the ice matrix is very heteroge-neous, with largest strains being accommodated in narrow passages between aligned particles. The hetero-geneity in strain and strain rate distribution on the centimeter scale persists to high strains, even after a mechanical quasi steady-state is reached. Using empirically calibrated viscous softening parameters, we find that the ice matrix in aggregates with calcite accommodates more strain than the bulk strain applied, and the relative activity of recrystallization processes in the matrix changes. At higher strain rates load trans-fer into hard particles can be significant.
Our presented model promises to offer an alternative approach to model deformation in rheologically het-erogeneous materials from micro to kilometer scale. The formation of high-strain zones in such heteroge-neous materials is of high relevance for understanding crustal-scale deformation, which is argued to be governed by strain localization.
References
Arbaret, L., and J. P. Burg (2003), Complex flow in lowest crustal, anastomosing mylonites: Strain gradients in a Kohistan gabbro, northern Pakistan,J. Geophys. Res.,108(B10), 2467, doi:10.1029/2002JB002295.
Austin, N., and B. Evans (2009), The kinetics of microstructural evolution during deformation of calcite,J. Geophys. Res.,114, B09402, doi: 10.1029/2008JB006138.
Austin, N., B. Evans, E. Rybacki, and G. Dresen (2014), Strength evolution and the development of crystallographic preferred orientation during deformation of two-phase marbles,Tectonophysics,631, 14–28, doi:10.1016/j.tecto.2014.04.018.
Bonet, J., and R. D. Wood (1997),Nonlinear Continuum Mechanics for Finite Element Analysis, Cambridge Univ. Press, Cambridge, doi: 10.1017/CBO9780511755446.
Bons, P. D., and S. J. D. Cox (1994), Analogue experiments and numerical modelling on the relation between microgeometry and flow properties of polyphase materials,Mat. Sci. Eng.,175, 237–245, doi:10.1016/0921-5093(94)91063-4.
Brodie, K. H., and E. H. Rutter (1987), The role of transiently fine-grained reaction products in syntectonic metamorphism: Natural and experimental examples,Can. J. Earth Sci.,24, 556–564. doi:10.1139/e87-054.
Brune, S. (2014), Evolution of stress and fault patterns in oblique rift systems: 3-D numerical lithospheric-scale experiments from rift to breakup,Geochem. Geophys. Geosyst.,15, 3392–3415, doi:10.1002/2014GC005446.
Brune, S. (2016), Rifts and rifted margins: A review of geodynamic processes and natural hazards, inPlate Boundaries and Natural Hazards, edited by J. C. Duarte and W. P. Schellart, pp. 13–37, John Wiley & Sons, Inc., Hoboken, N. J.
Brune, S., A. A. Popov, and S. V. Sobolev (2012), Modeling suggests that oblique extension facilitates rifting and continental break-up,
J. Geophys. Res.,117, B08402, doi:10.1029/2011JB008860.
Brune, S., A. A. Popov, and S. V. Sobolev (2013), Quantifying the thermo-mechanical impact of plume arrival on continental break-up,
Tectonophysics,604, 51–59, doi:10.1016/j.tecto.2013.02.009.
Brune, S., C. Heine, M. Perez-Gussinye, and S. V. Sobolev (2014), Rift migration explains continental margin asymmetry and crustal hyper-extension,Nat. Commun.,5, 4014, doi:10.1038/ncomms5014.
Chen, C.-C., C.-C. Lin, L.-G. Liu, S. V. Sinogeikin, and J. D. Bass (2001), Elasticity of single-crystal calcite and rhodochrosite by Brillouin spec-troscopy,Am. Mineral.,86, 1525–1529, doi:10.2138/am-2001-11-1222.
Clift, P. D., S. Brune, and J. Quinteros (2015), Climate changes control offshore crustal structure at South China Sea continental margin,
Earth Planet. Sci. Lett.,420, 66–72, doi:10.1016/j.epsl.2015.03.032.
Cook, A., S. Vel, C. Gerbi, and S. Johnson (2014), Computational analysis of nonlinear creep of polyphase aggregates: Influence of phase morphology,J. Geophys. Res. Solid Earth,119, 6877–6906, doi:10.1002/2014JB011197.
Cross, A. J., S. Ellis, and D. J. Prior (2015), A phenomenological numerical approach for investigating grain size evolution in ductiley deform-ing rocks,J. Struct. Geol.,76, 22–34, doi:10.1016/j.jsg.2015.04.001.
Cyprych, D., S. Piazolo, C. J. L. Wilson, V. Luzin, and D. J. Prior (2016), Rheology, microstructure and crystallographic preferred orientation of matrix containing a dispersed second phase: Insight from experimentally deformed ice,Earth Planet. Sci. Lett.,449, 272–281, doi: 10.1016/j.epsl.2016.06.010.
Czaplinska, D., S. Piazolo, and I. Zibra (2015), The influence of phase and grain size distribution on the dynamics of strain localization in polymineralic rocks,J. Struct. Geol.,72, 15–32, doi:10.1016/j.jsg.2015.01.001.
Drury, M. R., and J. L. Urai (1990), Deformation-related recrystallization processes,Tectonophysics,172, 235–253, doi:10.1016/0040-1951(90)90033-5. Durham, W. B., H. C. Heard, and S. H. Kirby (1983), Experimental deformation of polycrystalline H2O ice at high pressure and low
tempera-ture: Preliminary results,J. Geophys. Res.,88, B377–B392, doi:10.1029/JB088iS01p0B377.
Durham, W. B., S. H. Kirby, and L. A. Stern (1992), Effects of dispersed particulates on the rheology of water ice at planetary conditions,
J. Geophys. Res.,97, 2156–2202, doi:10.1029/92JE02326.
Gammon, P. H., H. Kiefte, and M. J. Clouter (1983), Elastic constants of ice samples by Brillouin spectroscopy,J. Phys. Chem.,87, 4025–4029, doi:10.1021/j100244a004.
Acknowledgments
This work was supported by the Australian Research Council (project DP120102 and FT1101100070) and the Australian Nuclear Science and Technology Organisation (ANSTO) through ANSTO project 2910 and 2178. S.B. has been funded by the Helmholtz Association through the Helmholtz Young Investigators Group CRYSTALS and via Marie Curie International Outgoing Fellowship (Project 326115). J.Q. thanks the support of the Helmholtz Association through the Helmholtz International Research Group (HIRG-0008). We acknowledge the editor Thorsten W. Becker and two excellent reviewers: Susan Ellis and Christopher Gerbi for their constructive criticism. This contribution benefitted from initial discussion with Chris Wilson and Mark Peternell with regard to