eurostat
OFICINA ESTADÍSTICA DE LAS COMUNIDADES EUROPEAS
DE EUROPÆISKE FÆLLESSKABERS STATISTISKE KONTOR
STATISTISCHES AMT DER EUROPÄISCHEN GEMEINSCHAFTEN
ΣΤΑΤΙΣΤΙΚΗ ΥΠΗΡΕΣΙΑ ΤΩΝ ΕΥΡΩΠΑΪΚΩΝ ΚΟΙΝΟΤΗΤΩΝ
STATISTICAL OFFICE OF THE EUROPEAN COMMUNITIES
OFFICE STATISTIQUE DES COMMUNAUTÉS EUROPÉENNES
ISTITUTO STATISTICO DELLE COMUNITÀ EUROPEE
BUREAU VOOR DE STATISTIEK DER EUROPESE GEMEENSCHAPPEN
SERVIÇO DE ESTATÍSTICA DAS COMUNIDADES EUROPEIAS
L2920 Luxembourg Tél. 43 011 Télex COMEUR LU 3423
B1049 Bruxelles, rue de la Loi 200 Tél. 299 11 11
Las publicaciones de Eurostat están clasificadas por temas y por series. La clasificación se encuentra al final de
la obra. Para mayor información sobre las publicaciones, rogamos se pongan en contacto con Eurostat.
Para los pedidos, diríjanse a las oficinas de venta cuyas direcciones figuran en la página interior de la
contracubierta.
Eurostats publikationer er klassificeret efter emne og serie. En oversigt herover findes bag i hæftet. Yderligere
oplysninger om publikationerne kan fås ved henvendelse til Eurostat.
Bestilling kan afgives til de salgssteder, der er anført på omslagets side 3.
Die Veröffentlichungen von Eurostat sind nach Themenkreisen und Reihen gegliedert. Die Gliederung ist hinten in
jedem Band aufgeführt. Genauere Auskünfte über die Veröffentlichungen erteilt Eurostat.
Ihre Bestellungen richten Sie bitte an die Verkaufsbüros, deren Anschriften jeweils auf der dritten Umschlagseite
der Veröffentlichungen zu finden sind.
Οι εκδόσεις της Eurostat ταξινομούνται κατά θέμα και κατά σειρά. Η ακριβής ταξινόμηση αναφέρεται στο
τέλος κάθε έκδοσης. Για λεπτομερέστερες πληροφορίες σχετικά με τις εκδόσεις, μπορείτε να
απευθύ-νεσθε στην Eurostat.
Για τις παραγγελίες μπορείτε να απευθύνεσθε στα γραφεία πώλησης, των οποίων οι διευθύνσεις
αναγράφονται στη σελίδα 3 του εξωφύλλου.
Eurostat's publications are classified according to themes and series. This classification is indicated at the end of
the publication. For more detailed information on publications, contact Eurostat.
Orders are obtainable from the sales offices mentioned on the inside back cover.
Les publications d'Eurostat sont
classées par thème et par série. Cette classification est précisée à la fin
de l'ouvrage. Pour des informations plus détaillées sur les publications, contactez Eurostat.
Pour les commandes, adressez-vous aux bureaux de vente dont les adresses sont indiquées à la page 3
de la couverture.
Le pubblicazioni dell'Eurostat sono classificate per tema e per serie. Tale classificazione è precisata alla fine
dell'opera. Per informazioni più dettagliate sulle pubblicazioni rivolgersi all'Eurostat.
Per eventuali ordinazioni rivolgersi a uno degli uffici di vendita i cui indirizzi figurano nella 3
apagina della
copertina.
De publikaties van Eurostat zijn ingedeeld naar onderwerp en serie. Deze indeling is achter in het boek
opgenomen. Voor nadere informatie over de publikaties kunt u sich wenden tot Eurostat.
Gelieve bestellingen op te geven bij de verkoopbureaus, waarvan de adressen op bladzijde 3 van de omslag zijn
vermeld.
EXTERNAL TRADE
AND BALANCE OF PAYMENTS
Monthly statistics
Luxembourg: Office for Officiai Publications of the European Communilies, 1993
© ECSC-EEC-EAEC, Brussels · Luxembourg, 1993
NOTE
This edition combines external trade and balance of payments statistics for the Community,
the aim being to provide the reader with all statistical information relating to the Community's
external transactions.
Owing to different periodicities of data collection (monthly for external trade, quarterly for
balance of payments), figures for the balance of payments will appear four times a year in this
publication.
The statistical tables will be preceeded by a concise analysis which will comment upon the
main economic trends. To this end, certain Community aggregates will be estimated if the
necessary data is available for most member states.
Foreword
Two important changes have taken place in 1988 with regard
to the collection of external trade statistics:
(i) The introduction of the Single Administrative Document,
which not only covers trade in Community goods
between Member States but is also intended to be used
for the corresponding formalities in trade with
non-member countries. This simplification of declaration pro
cedures in the exchange of goods marks an important
step towards completion of the internal market.
(ii) The simultaneous entry into force of a new goods classi
fication known as the Combined Nomenclature (CN),
which is intended to meet Common Customs Tariff and
statistical requirements alike. This nomenclature is
based on the Harmonized Commodity Description and
Coding System (HS), whose aim is to enhance the world
wide comparability of external trade statistics.
As a result of both these changes, customs and statistical
departments were faced with a considerable amount of work
until the procedures had been properly introduced and
tested and formed part of normal working practice.
This meant that there were delays in the forwarding of data
in all the Member States. In addition, there was bound to be
a higher quota of errors and corrections, so that the first
month's data are not directly comparable with those of the
preceding year and therefore need to be interpreted with
caution.
In particular, it should be noted that considerable diver
gences have arisen at subheading level between the Combi
ned Nomenclature and the formerly used Nimexe, leading to
a break in the goods-related time series between 1987 and
1988. Up to December 1987 this Bulletin used the SITC Rev.
2, which was worked out using the 6-digit Nimexe, while
from January 1988 it uses the SITC Rev. 3, which has been
drawn up using the 8-digit subheadings of the Combined
Nomenclature.
As an aid to interpretation of the statistics, Eurostat has
published in Theme 6 'Foreign Trade, Series E: Methods'
brochures entitled 'Nomenclature of goods, CN-Nimexe cor
relation tables'. These provide a comparison between the old
and new nomenclatures as well as showing the links bet
ween the Combined Nomenclature (CN) and its offshoots.
Eurostat will be glad to provide users of European statistics
with any further information or explanations they may require
with regard to these new developments.
Important note
Table of contents
Commentary
Charts
General summary of trade by country:
Tab. 1: Yearly and quarterly data .
Tab. 2: Monthly data
General summary of trade by commodities:
Tab. 3: Yearly and quarterly data
Tab. 4: Monthly data
Trends in trade by country:
Tab. 5: World, intra- and extra-EC . . .
Tab. 6: Intra-EC by member countries
Tab. 7: Major areas
Trends in trade by commodities:
Tab. 8: SITC sections
Trade by partner countries:
Tab. 9: All commodities (monthly cumulative data)
Tab. 10: SITC sections and main partner countries (quarterly cumulative data)
Indices:
Tab. 11: Volume and unit value indices
Trade of main non-Community countries:
Tab. 12: Trends in total trade and with the EC (EUR 12)
Conversion rates:
Tab. 13: Member countries, United States of America, Japan and Switzerland
EC trade in agricultural products:
Tab. 14: Main product groups
Tab. 15: Products subject to common agricultural policy regulations
EC trade in petroleum products:
Tab. 16: Petroleum and petroleum products
EC and world trade:
Tab. A: World, Community and main non-Community countries
Trade of the FR of Germany, including West Berlin, as constituted prior to 3 October 1990:
Tab. B: Trade by countries
Tab. C: Trade by products
VII
XIX
2
5
8
11
16
24
30
52
92
100
102
106
Catalogue of regular publications of external trade
108
109
112
116
Symbols and abbreviations used
EUR 12: Total of the EC member countries
UEBL: Belgo-Luxembourg Economic Union
DK: Denmark
D: Federal Republic of Germany
GR: Greece
E: Spain
F: France
IRL: Ireland
I: Italy
NL: Netherlands
P: Portugal
UK: United Kingdom
0: Data less than half the unit used
Mio: Million
Mrd: 1 000 million
ECU: European currency unit
Eurostat: Statistical Office of the European Communities
Commentary and graphs
(The commentary refers to the state of the CRONOS database on 1. 3.1993.)
Available data in this issue:
October 1992
November 1992
December 1992
(The tables refer to the state of th«
Methodological notes:
EUR 12
X
UEBL
X
X
DK
X
X
X
D
X
X
GR
Χ
Χ
E
Χ
Χ
Χ
F
Χ
Χ
Χ
IRL
Χ
Ι
Χ
Χ
Χ
CRONOS database on 8.3.1993)
See Glossarium 1992
NL
Χ
Χ
χ
Ρ
χ
χ
υκ
χ
χ
Seasonal Adjustment: Results
Seasonally adjusted European Community exports
to the rest of the world (extra-EC) picked up again
in mid-1991, after the downward tendency at the
end of 1990. They have been fluctuating around a
high level already recorded at the beginning of
1990. Recently, they again showed a slightly
upward movement as economic growth in the
Community's main trading partners is picking up
hesitantly. In October 1992, seasonally adjusted
extra-EC exports increased by 1,8% compared to
September 1992, an indication of the upward
moving tendency of extra-EC exports.
Seasonally adjusted European Community imports
from the rest of the world (extra-EC) have been
decreasing slightly over the past few months due to
the economic slowdown in most EC Member States.
In October 1992, seasonally adjusted extra-EC
imports increased only slightly by 0,9% compared
to September 1992.
The European Community's seasonally adjusted
trade balance started to improve during the second
half of 1991 compared to the first half of 1991 and
continued this movement in 1992. The trade
balance fluctuated around a record low level in the
first half of 1991. After a marked improvement over
recent months, it is now back at its mid-1990 level.
In October 1992, the seasonally adjusted
Community trade deficit stood at -2,6 billion ECU.
Trade between EC Member States (intra-EC)
is stabilising around a high level, after an upward
movement recorded since the beginning of 1991. In
October 1992, seasonally adjusted trade between
European Community Member States dropped
slightly by 0,4% compared to September 1992.
70
EUR 12 Exports Extra-EC
Bio. ECU
1984 1985 1986 1987 1988 1989 1990 1991 1992
Unadjusted Seasonally Adjusted
EUR 12 Imports Intra-EC
1984 1985 1966 1987 1988 1989 1990 1991 1992
— Unadjusted Seasonally Adjusted
EUR 12 Imports Extra-EC
Bio. ECU
1984 1985 1986 1987 1988 1989 1990 1991 1992
— Unadjusted — Seasonally Adjusted
EUR 12 Trade Balance Extra-EC
Bio. ECU
1984 1985 1986 1987 1988 1989 1990 1991 1992
TABEL I - EUR 12 EXPORTS, IMPORTS, TRADE BALANCE (1)
Seasonally Adjusted Series(2) - Mrd. ECU
Period
Jan-89
Feb-89
Mar-89
Apr-69
May-89
Jun-89
Jul-89
Aug-89
Sep-89
Oct-89
Nov-«9
Dec-69
Jan-90
Feb-90
Mar-90
Apr-90
May-90
Jun-90
Jul-90
Aug-90
Sep-90
Oct-90
Nov-90
Dec-90
Jan-91
Feb-91
Mar-91
Apr-91
May-91
Jun-91
Jul-91
Aug-91
Sep-91
Oct-91
Nov-91
Dec-91
Jan-92
Feb-92
Mar-92
Apr-92
May-92
Jun-92
Jul-92
Aug-92
Sep-92
Oct-92
Exports
Not Adjusted
30,3
30,9
34,8
33,7
33,4
37,4
34,0
31,3
34,4
37,6
37,1
37,4
34,1
33,6
37,7
33,3
35,6
35,1
35,5
31,4
31,2
38,8
36,9
35,4
32,6
31,7
34,4
34,5
34,4
34,6
38,6
32,1
34,3
40,0
37,5
38,4
32,7
34,2
38,3
37,1
34,0
35,9
39,4
30,1
35,7
39,8
Extra-EC
Seasonally
Adjusted
33,4
33,0
34,1
33,7
33,9
35,9
33,9
34,3
36,0
34,6
35,0
35,0
37,1
36,0
35,5
35,0
35,6
35,0
34,0
34,7
33,0
35,2
34,7
33,9
34,7
33,9
34,1
34,3
34,6
35,2
36,4
36,5
35,8
35,5
36,4
35,6
35,2
36,2
36,0
37,4
36,1
35,2
36,5
35,5
36,0
36,6
Imports Extra-EC
Not Adjusted
35,4
34,3
38,0
37,6
39,1
40,1
35,3
34,4
.37,7
40,6
39,1
34,8
39,6
35,6
40,2
37,1
39,4
37,8
36,8
35,2
36,6
43,9
41,9
36,0
43,0
37,3
39,2
43,3
42,3
40,4
43,9
37,0
41,6
44,5
42,2
38,3
41,4
39,8
44,0
42,5
40,0
40,6
42,0
33,3
39,8
41,4
Seasonally
Adjusted
35,2
35,9
36,9
36,9
38,5
39,0
36,9
37,3
37,9
37,9
37,9
37,3
38,6
37,5
38,0
37,6
38,1
37,6
36,6
38,6
37,8
40,5
40,2
39,3
41,6
39,4
38,7
41,0
41,1
41,2
42,7
41,7
42,3
40,6
41,5
40,7
40,5
41,6
41,3
41,3
40,6
39,5
40,6
38,9
38,8
39,2
Imports Intra-EC
Not Adjusted
47,7
49,1
54,1
52,0
52,5
57,3
50,4
42,5
50,8
58,1
56,4
51,5
58,9
52,3
60,6
54,4
56,6
54,7
54,8
44,5
53,3
62,3
61,1
52,6
59,3
56,0
59,6
60,0
59,1
59,0
61,9
45,6
57,3
64,9
60,6
57,0
58,1
60,0
66,2
62,9
58,4
60,9
62,3
44,4
59,3
63,0
Seasonally
Adjusted
49,6
49,8
50,3
50,5
51,7
54,0
52,3
52,1
52,9
53,3
53,6
54,0
55,5
53,1
54,8
54,4
54,4
53,8
54,0
55,7
55,9
57,3
56,2
54,1
59,5
56,9
56,7
56,9
57,6
58,7
60,4
58,2
58,9
58,5
59,5
58,6
59,0
60,3
59,3
60,8
59,5
58,0
60,1
58,8
59,3
59,0
Trade Balance Extra-EC
Not Adjusted
-5,1
-3,4
-3,2
-3,9
-5,7
-2,7
-1,3
-3,0
-3,3
-3,0
-2,0
2,5
-5,5
-2,0
-2,5
-3,7
-3,8
-2,7
-1,3
-3,8
-5,3
-5,2
-5,0
-0,6
-10,5
-5,7
-4,9
-8,8
-7,9
-5,7
-5,3
-4,9
-7,3
-4,4
-4,7
0,1
-8,6
-«,6
-5,7
-5,4
-6,0
-4,7
-2,6
-3,1
-4,1
-1,6
Seasonally
Adjusted
-1,8
-2,9
-2,8
-3,2
-4,6
-3,0
-3,0
-3,0
-1,9
-3,2
-2,9
-2,3
-1,5
-1,5
-2,5
-2,5
-2,6
-2,6
-2,6
-4,0
-ifi
-5,2
-5,5
-5,3
-6,9
-5,5
^,6
-6,7
-6,5
-6,1
-6,4 _
-5,1
-6,5
-5,1
-5,1
-5,1
-5,3
-5,4
-5,2
-«,9
-4,6
-»,2
-4,0
-3,4
-2,9
-2,6
(1) As from October 1990, the territory of the Federal Republic of Germany includes the territory of the former German Democratic Republic, including East Berlin.
■
GLOBAL TRENDS: Results for October 1992.
The gap between the rates of change In exports and imports, calculated
between October 1991 and October 1992, was +6 points for the Community,
1 for the United States and +13 for Japan.
The
Community's cumulative external trade
defi
cit from January to October 1992 amounted to ECU
47.5 billion an improvement of nearly ECU 18 billion
overthe same period in 1991. Imports fell slightly (by
1.8%), while exports rose by 3%.
ExtraCommunity trade showed a deficit of ECU 1.6
billion in October 1992 compared with one of ECU
4.4 billion in October 1991, an improvement due to a
substantial falloff of 6.9% in imports from the pre
vious year's level, with exports remaining stable at
0.6%. The cost of the Community's crude oil sup
plies fell by 8% per barrel in dollar terms between
October 1991 and October 1992 and was pushed
further down by the fall of the dollar against the ecu:
the ecu price per barrel fell by almost 17%.
The
United States
registered a trade deficit approa
ching ECU 65 billion for the first ten months of 1992,
representing a deterioration of ECU 6.6 billion
compared with the first ten months of 1991. Exports
increased very slightly during this time (by 0.2%),
while imports rose by 2.1%. The United States' ex
ternal trade balance in October 1992 was ECU 8.8
billion, close to its October 1991 level. Imports were
down by 2.2% in ecu terms but up by nearly 7% when
expressed in dollars. Exports were 3.2% down in
ecus but 6% up in dollar terms.
Japan's surplus for the period JanuaryOctober
1992 was ECU 71 billion 20.4 billion more than in
the corresponding period of the previous year. Its
exports were almost 3% up in ecu terms while im
ports were well down (by 8.9%).
Japan registered a surplus of ECU 7.9 billion for
October 1992, compared with ECU 5.7 billion in
October 1991. Exports remained stable in ecu terms
(0.3%) but were 9% up in dollar terms and 0.5% up
in yen. Japanese imports fell by 13.3% in ecus, 5%
in dollars and 12% in yen.
GR.II IMPORTS AND EXPORTS (CIF, FOB)
(annual % change in value)
jui
M.
■10-Q.
90
91
91
92
91
92
0110
10
EUR12
90
91
, 9 1
92
91 92
0110
10
90
91
91
92
0110
USA
I
Imports
JAPAN
COUNTRIES
EUR-12(2)
United Slates'*
Japan
BLEU
Denmark
Germany
Greece
Spain
France
Ireland
Italy
Netherlands
Portugal
United Kingdom
EUR-12(2)
United States"
Japan
BLEU
Denmark
Germany
Greece
Spain
France
Ireland
Italy
Netherlands
Portugal
United Kingdom
EUR-12(2)
United States
Japan
BLEU
Denmark
Germany
Greece
Spain
France
Ireland
Italy
Netherlands
Portugal
United Kingdom
Memorandum Hem
1 USD
=
...ECU
1 YEN
=
...ECU
1990
-42,9
-95,2
41,2
-5,6
2,4
47,4
-«,2
-20,1
-17,3
2,3
-9,3
0,3
-6,7
-31,9
3,6
-9,3
-3,9
6,0
2,9
10,3
6,0
7,7
4,9
3,8
2,9
5,3
14,0
-1,6
1,6
-6,2
-9,8
2,3
7,3
2,8
-7,8
9,3
3,9
-0,6
4,7
2,0
11,7
4,6
-13,5
-17,3
TABLE II
-1991
-70,5
-69,5
62,9
-7,2
2,6
9,2
-10,4
-21,3
-15,4
2,7
-10,4
-2,7
-7,9
-22,3
TRADE BALANCE, IMPORTS AND EXPORTS (1)
1992
II
1992
III
1991
01-10
1992
01-10
T R A D E BALANCE (Bio ECU)
-16,3
-18,1
19,3
-1,1
0,9
2,4
-3,1
-6,3
-1,0
1,5
-3,6
-0,9
-2,4
-7,2
-9,2
-25,0
21,7
-1,6
1,1
6,0
-2,3
-5,7
-2,1
1,1
0,5
-0,7
-2,2
-7,9
-65,6
-68,0
50,6
-6,8
2,0
5,1
-7,6
-18,1
-11,9
2,0
-10,1
-2,9
-6,6
-21,0
IMPORTS
-47,5
-64,6
71,0
-5,4
3,5
14,3
-8,4
-19,4
-6,3
4,1
-8,1
-2,2
-7,2
-24,2
1991
10
-4,4
-8,6
5,7
-0,1
0,1
1,0
-0,8
-13
0,1
0,3
-0,9
-0,1
-0,7
-1,8
%
change o n the corresponding period of the previous year
6,8
1,2
3,7
4,0
4,8
16,6
11,8
9,6
4,3
3,3
2,9
3,7
7,9
-3,6
-2,2
2,7
-5,5
-0,9
-0,9
-3,0
15,2
4,8
0,8
0,4
1,7
-2,4
1,6
4,4
-6,6
-6,1
-18,0
-i,3
-2,4
-3,4
6,7
2,0
-2,1
-1,1
-3,5
-3,4
14,0
-1,0
7,6
-0,0
7,0
4,1
5,8
20,1
0,7
9,6
3,7
2,9
3,6
4,3
8,9
-4,1
EXPORTS
-1,8
2,1
-*,9
-0,8
0,2
-0,7
8,3
5,2
0,4
-0,5
0,4
-0,1
8,2
1,4
1,2
9,4
-3,4
-1,9
4,7
8,5
19,9
14,6
-0,9
1,4
4,1
0,2
8,8
-4,4
% change o n the corresponding period of the previous year
0,9
9,9
12,7
2,6
5,2
2,1
10,5
11,2
5,9
4,8
2,2
1,0
2,4
2,2
3,3
-2,1
2,0
0,7
2,6
1,4
-10,8
2,8
5,5
15,8
1,1
-1,0
-3,6
1,2
0,3
-9,8
-«,4
-0,5
3,1
1,6
-5,8
4,5
1,6
7,4
3,2
-1,3
14,9
"4,9
0,1
8,6
13,0
2,9
6,2
1,9
10,8
13,0
5,5
3,6
2,1
1,2
2,7
2,6
EXCHANGE RATE
3,0
0,2
2,9
-0,4
6,2
2,7
3,7
4,5
4,1
12,4
2,3
0,7
7,3
-1,0
3,3
19,8
16,8
0,0
5,4
-2.4
-5,3
24,9
8,2
17,2
4,9
0,2
14,3
-0,8
% change o n the corresponding period of the previous year
2,8
10,3
-6,6
-0,9
-15,1
-7,2
1,9
10,6
-6,1
0,2
11,6
10,8
1992
10
-1,6
-«,8
7,9
0,2
0,5
2,7
-0,7
-1,3
-0,7
0,4
0,1
0,1
-0,7
-1,9
-6,9
-2,2
-13,3
-«,2
-7,0
-0,4
4,0
-7,1
-2,1
-2,6
-12,0
-2,7
1,0
-8,5
-0,6
-3,2
-0,3
-2,8
10,0
5,4
17,7
0,4
-6,6
4,3
-5,0
-0,2
-3,9
-10,1
-«,6
-1,4
(1) External Trade Statistics (Imports CIF, Exports FOB).
(2) EUR-12 includes only extra flows. Figures for Member States include world flows.
* Estimate.
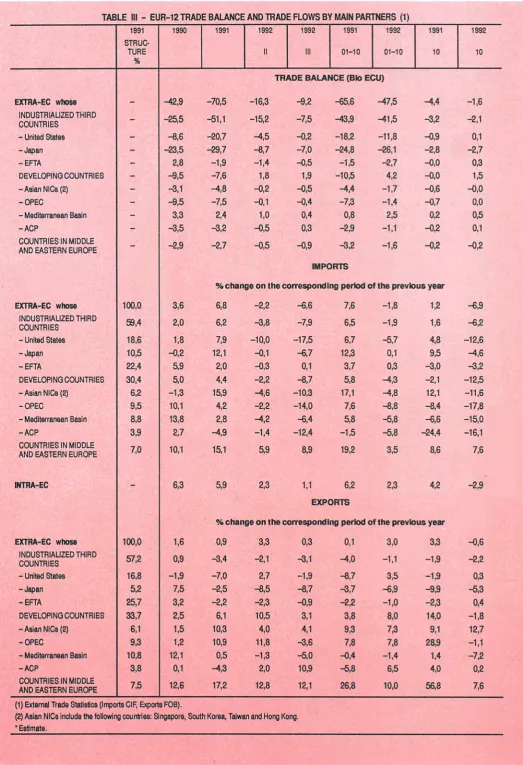
EXTRACOMMUNITY TRADE BY PARTNER COUNTRY: Results for October 1992.
The Community's balance of trade with the United States was ECU 1 billion higher
than in October 1991. Its trade balance with developing countries
improved by ECU 1.5 billion.
Thanks to the improvement in the trade balance with
the United States, which was just in the black in
October 1992 (ECU 0.1 billion compared with ECU
0.9 billion a year earlier), the Community's trade
deficit with
industrialised countries
was ECU 1.2
billion less in October 1992 than in October 1991.
Trade with the EFTA countries showed a surplus of
ECU 0.3 billion, compared with a state of equilibrium
the year before. The Community's trade deficit with
Japan remained close to its October 1991 level at
ECU 2.7 billion.
Imports from industrialised countries were 6.2% be
low their October 1991 figure. Imports from the Uni
ted States showed a drop of 12.6% compared with
the previous year, reflecting the fall of the dollar
against the ecu in the intervening period (8.6%).
Imports from the EFTA countries fell by 3.2% while
imports from Japan shrank by 4.6% from their Octo
ber 1991 level.
Exports to industrialised countries fell by 2.2%, with
those to Japan showing a 5.3% falloff while exports
to the United States and EFTA registered slight
increases (0.3% and 0.4% respectively).
Community trade with
developing countries,
in
equilibrium in October 1991, snowed a surplus of
ECU 1.5 billion in October 1992. Community trade
with the OPEC countries was in balance, compared
with ECU 0.7 billion in October 1991 an improve
ment attri
butable to the fall in the cost in ecu of the Communi
ty's crude oil supplies. The balance with the newly
industrialising countries in Asia improved from ECU
0.6 billion in October 1991 to equilibrium in October
1992. Community trade with the Mediterranean and
ACP countries showed surpluses of ECU 0.5 billion
and 0.1 billion respectively in October 1992, each
ECU 0.3 billion higher than in the year before.
Imports from developing countries were distinctly
lower in October 1992 than in October 1991, showing
adecline of 12.5%. Imports from the OPEC countries
were 17.8% down, in parallel with the cost of the
Community's crude oil supplies. Imports from the
Mediterranean and ACP countries fell by 15% and
16.1% respectively compared with October 1991.
Imports from the newlyindustrialising countries in
Asia fell by 11.6%.
Exports to developing countries dropped slightly
from their October 1991 level (by 1.8%). Exports to
the OPEC and ACP countries remained stable at
1.1% and +0.2% respectively. Exports to the Medi
terranean countries were 7.2% below their October
1991 level. Exports to the newlyindustrialising
countries in Asia increased by 12.7%.
The Community's trade deficit with the
countries of
central and eastern Europe
was ECU 0.2 billion in
October 1992 close to its October 1991 level. Both
imports from and exports to these countries were up
by 7.6%.
GR.III- EXTRA TRADE BALANCE (MAIN PARTNERS)
(BN ECU)
• 1 5
• 2 0
• 2 5 ·
■1 ■
JAPAN
90
91
92
TABLE III - EUR-12 TRADE BALANCE AND TRADE FLOWS BY MAIN PARTNERS (1)
EXTRA-EC whose
INDUSTRIALIZED THIRD
COUNTRIES
- United States
-Japan
-EFTA
DEVELOPING COUNTRIES
-AsianNICs(2)
-OPEC
- Mediterranean Basin
- A C P
COUNTRIES IN MIDDLE
AND EASTERN EUROPE
EXTRA-EC whose
INDUSTRIALIZED THIRD
COUNTRIES
- United States
-Japan
-EFTA
DEVELOPING COUNTRIES
-AsianNICs(2)
-OPEC
- Mediterranean Basin
-ACP
COUNTRIES IN MIDDLE
AND EASTERN EUROPE
INTRA-EC
EXTRA-EC whose
INDUSTRIALIZED THIRD
COUNTRIES
- United States
-Japan
-EFTA
DEVELOPING COUNTRIES
-AsianNICs(2)
-OPEC
- Mediterranean Basin
- A C P
COUNTRIES IN MIDDLE
AND EASTERN EUROPE
1991
STRUC-TURE
%
-100,0
59,4
18,6
10,5
22,4
30,4
6,2
9,5
8,8
3,9
7,0
~
100,0
57,2
16,8
5,2
25,7
33,7
6,1
9,3
10,8
3,8
7,5
(1) External Trade Statistics (Imports CIF, Export
(2) Asian NICa include the following countries: S
* Estimate.
1990
-42,9
-25,5
-6,6
-23,5
2,8
-6,5
-3,1
-9,5
3,3
-3,5
-2,9
3,6
2,0
1,8
-0,2
5,9
5,0
-1,3
10,1
13,8
2,7
10,1
6,3
1,6
0,9
-1,9
7,5
3,2
2,5
1,5
1,2
12,1
0,1
12,6
8 FOB).
ngapore, Sout
1991
1992
II
1992
III
1991
01-10
1992
01-10
1991
10
TRADE BALANCE (Bk) ECU)
-70,5 -16,3
-9,2
-65,6 -47,5
-4,4
-51,1 -15,2
- 7 , 5
-43,9 -41,5
-3,2
-20,7
- 4 , 5 -0,2
-18,2 -11,8
-0,9
-29,7
-8,7 - 7 , 0
-24,8 -26,1
-2,8
-1,9 - 1 , 4 - 0 , 5 - 1 , 5 - 2 , 7 - 0 , 0
-7,6
1,8 1,9 -10,5 4,2
- 0 , 0
-4,8 -0,2 - 0 , 5 -4,4 -1,7 -0,6
- 7 , 5 -0,1 - 0 , 4 -7,3 - 1 , 4 -0,7
2,4 1,0 0,4 0,8
2 ^ 0,2
- 3 , 2 -0,5 0,3 -2,9 -1,1 - 0 , 2
- 2 , 7 - 0 , 5 -0,9 -3,2 -1,6 - 0 , 2
IMPORTS
% change o n the corresponding period of the previous year
6,8 - 2 , 2 -6,6
7,6
- 1 , 8
1,2
6,2 -3,8 -7,9 6,5 -1,9
1,6
7,9 -10,0 -17,5 6,7
- 5 , 7 4,8
12,1 -0,1 - 6 , 7
12,3 0,1
9,5
2,0 -0,3
0,1 3,7 0,3
- 3 , 0
4,4
-2,2 -8,7 5,8 -4,3 -2,1
15,9
- 4 , 6
-10,3 17,1
- 4 , 8
12,1
4,2
-2,2
-14,0 7,6
-8,8 - 8 , 4
2,8 - 4 , 2 -6,4 5,8 -5,8 - 6 , 6
-4,9 -1,4
-12,4
- 1 5 -5,8
-24,4
15,1
5,9 8,9
19,2
3,5 8,6
5,9 2,3
1,1
6,2
2,3 4,2
EXPORTS
% change o n the corresponding period of the previous year
0,9 3,3
0,3 0,1
3,0
3,3
-3,4
-2,1 -3,1
- 4 , 0
-1,1
- 1 3
- 7 , 0
2,7 -1,9
-8,7
3,5 -1,9
- 2 , 5 - 8 , 5 -8,7 -3,7 -6,9 -9,9
-2,2 -2,3 -0,9 -2,2
- 1 , 0
-2,3
6,1 10,5 3,1 3,8
8,0
14,0
10,3
4,0
4,1
9,3
7,3 9,1
10,9 11,8 -3,6 7,8 7,8 28,9
0,5
-1,3 -5,0
- 0 , 4 -1,4
1,4
-4,3 2,0
10,9 -5,8
6,5
4,0
17,2 12,8
12,1
26,8 10,0 56,8
h Korea, Taiwan and Hong Kong.
1992
10
-1,6
-2,1
0,1
- 2 , 7
0,3
1,5
-0,0
0,0
0,5
0,1
- 0 , 2
-6,9
- 6 , 2
-12,6
- 4 , 6
-3,2
-12,5
-11,6
-17,8
-15,0
-16,1
7,6
-2,9
- 0 , 6
- 2 , 2
0,3
-5,3
0,4
- 1 , 8
12,7
-1,1
- 7 , 2
0,2
EXTRACOMMUNITY TRADE BY PRODUCT: Results for October 1992.
Fuel products, machinery and transport equipment and food each accounted
for a quarter of the Improvement in the extraCommunity trade balance.
The Community deficit on fuel products (SITC 3) was
ECU 4.5 billion in October 1992, ECU 0.7 billion less
than in October 1991, thanks to the reduced cost of
the Community's crude oil supplies and the fall of the
dollar against the ecu.
Machinery and transport
equipment (SITC 7) showed a surplus of ECU 3.9
billion, 0.8 billion more than in the previous October.
Trade in chemicals (SITC 5) remained at its October
1991 level with a surplus of roughly ECU 2 billion.
The deficit on "other manufactured goods" (SITC
6+8) improved by ECU 0.2 billion to 0.7 billion. The
trade balance on crude materials other than fuel
products (SITC 2+4) was ECU 1.9 billion, compared
with ECU 2.2 billion in October 1991. Trade in food
(SITC 0+1) showed a slight surplus in October 1992
after its deficit of ECU 0.5 billion in October 1991.
Imports of
crude materials, fuel products
and
food
were down by 12.7%, 11.7% and 11% respectively.
The drop in imports of manufactured goods was far
less marked:1%forchemicals,4.5%for machinery
and transport equipment and 4% for other manufac
tured goods.
Exports of
machinery and transport equipment
were slightly (1%) higher than in October 1991.
Exports of other manufactured products shrank by
2.8%, while exports of chemicals remained at their
October 1991 level. Food exports were up by 3.4%.
GR.IV EXTRA TRADE BALANCE (PRODUCT GROUPS)
(BN ECU)
40■
Manufactures
Prim.goods
Fuels
Manufactures
HT
5 ■■
Primgoods
Manufactures
91
92
0110
91
92
TABLE IV - EUR-12 TRADE BALANCE AND TRADE FLOWS BY BROAD PRODUCT GROUPS (1)
EXTRA-EC
-Food, etc (SITC 0+1)
- Crude materials (SITC 2+4) (2)
-Fuelproduct8(SITC3)
-Chemical8(SITC5)
- Machinery, transport eq. (SITC 7)
- Other manufact. goods (SITC 6+8)
-Articles not classified (SITC 9)
EXTRA-EC
-Food, etc (SITC 0+1)
- Crude materials (SITC 2+4) (2)
-Fuel products (SITC 3)
- Chemicals (SITC 5)
- Machinery, transport eq. (SITC 7)
- Other manufact. goods (SITC 6+8)
- Articles not classified (SITC 9)
EXTRA-EC
-Food, etc (SITC 0+1)
- Crude materials (SITC 2+4) (2)
- Fuel products (SITC 3)
-Chemical8(SITC5)
- Machinery, transport eq. (SITC 7)
- Other manufact. goods (SITC 6+8)
- Articles not classified (SITC 9)
(1) External Trade Statistics (Imports CIF, E
(2) Petroleum not included.
* Estimate.
1991
STRUC-TURE
%
-100,0
7,7
7,0
14,4
6,6
30,0
29,1
5,1
100,0
7,4
2,2
2,5
12,0
40,8
30,3
4,8
¿ports FOB).
1990
-42,9
-5,1
-29,1
-59,3
18,2
37,6
-1,8
-3,4
3,6
-0,1
-10,2
13,6
3,5
5,6
3,1
-0,9
1,6
-1,1
- 7 , 6
17,3
1,1
6,1
- 0 , 6
-13,8
3ITCRev.3is
1991
1992
II
1992
III
1991
01-10
1992
01-10
1991
10
TRADE BAI-ANCE (Bio ECU)
-70,5 -16,3
-9,2
-65,6 -47,5
-4,4
-7,0 -1,5 -0,4 -6,0 -3,3 -0,5
-25,5
-«,6 - 5 , 4
-21,7 -20,2
- 2 , 2
-60,8 -13,5 -13,2 -50,3 -44,9
- 5 , 2
18,4
5,2 5,3
14,6 16,9 1,9
24,4
6,2 9,8
17,7 25,2 3,1
-15,2
-3,9 -3,7
-15,4 -14,5
-0,9
-4,7 -2,2 -1,7 - 4 , 5 -6,8 -0,6
IMPORTS
% change o n the corresponding period of the previous year
6,8 - 2 , 2 -6,6
7,6
- 1 , 8
1,2
7,0
0,3 -7,7 6,0 -1,3 9,6
- 8 , 2 - 2 , 5
- 1 2 , 5
-9,8 - 4 , 0 -1,8
1,2
-2,2
-11,1
6,8 - 6 , 4
-22,4
7,0 1,1 4,4
8,9 2,5 3,3
12,2
- 3 , 4 - 8 , 5
12,3
-1,1 6,6
8,5 0,0 - 2 , 7 9,4
0,7 8,1
6,8
-14,2
-6,1
4,1
-3,3 8,0
EXPORTS
% change o n the corresponding period of the previous year
0,9 3,3 0,3
0,1 3,0
3,3
1,8 11,7
6,5
-0,1
9,0 3,3
5,2
2,4
-4,3 4,6 3,0
8,5
- 5 , 5
6,0
- 6 , 5 -3,6 -1,0
-14,1
4,8
8,7 4,3
3,9
7,3 10,8
1,7 5,5 1,8
0,8 4,5 3,9
- 1 , 7 0,6
0,4 -2,2 1,6 3,4
1,5 -24,3 -27,0 1,1 -17,8 -12,2
in application from 1988.
1992
10
- 1 , 6
0,1
-1,9
- 4 , 5
1,9
3 3
-0,7
- 0 , 4
- 6 3
-12,7
-11,0
-11,7
- 1 , 0
^ , 5
-4,0
-17,5
-0,6
3,4
^ , 1
2,2
0,0
1,0
-2,8
INDIVIDUAL MEMBER STATES' AND INTRACOMMUNITY TRADE:
Results for October 1992. IntraCommunity trade showed a slower decline than
extraCommunity Imports.
In October 1992, Germany's
extraCommunity
sur
plus was ECU 1.5 billion, 0.9 billion more than in the
previous October. France's equivalent was ECU 0.5
billion. Denmark showed a surplus of ECU 0.3 billion
and Italy ECU 0.2 billion, an improvement of 0.5
billion over its October 1991 position. Ireland was just
in the black at ECU 0.1 billion, while the BLEU,
Greece and Portugal showed slight deficits in Octo
ber 1992. Spain registered ECU 0.7 billion. The
Netherlands and the United Kingdom showed the
heaviest deficits of nearly ECU 1.5 billion, but both
had improved by some ECU 0.4 billion over October
1991.
IntraCommunity trade was almost 3% down in
October 1992, while extraCommunity imports were
some 7% below their October 1991 level.
The Netherlands registered the highest intra
Community trade surplus for October f992 at ECU
1.5 billion, followed by Germany at 1.2 billion an
improvement of ECU 0.8 billion over October 1991.
The BLEU, Ireland and Denmark showed surpluses
of ECU 0.4, 0.3 and 0.2 billion respectively. Italy's
intraCommunity deficit was ECU 0.1 billion, compa
red with ECU 0.6 billion in October 1991. The United
Kingdom, in balance in October 1991, registered a
deficit of ECU 0.4 billion and Greece one of ECU 0.5
billion. Spain showed a deficit of ECU 0.6 billion an
improvement of 0.4 billion. France's intraCommuni
ty trade balance deteriorated by ECU 0.9 billion to
ECU 1.2 billion.
GR.V MEMBER STATE'S cXTRA AND INTRA TRADE BALANCE
(BN ECU)
¡Ü—J
¡BHLI
G R
E X T R A
^ 3
1 9 9 1 - 1 0
N L R
I Ι 1 Θ 9 2 1 0
J=L
:■:::
I
G R
E
I N T R A
F=
I R L
Eä3
i o n i
i o
NL·
R
TABLE V
EUR-12
-extra
-intra (2)
BLEU
-extra
-intra
DENMARK
-extra
-intra
GERMANY
-extra
-intra
GREECE
-extra
-intra
SPAM
-extra
-intra
FRANCE
-extra
-intra
IRELAND
-extra
-intra
ITALY
-extra
-intra
NETHERLANDS
-extra
-intra
PORTUGAL
-extra
-intra
UNITED
KINGDOM
-extra
-intra
1990
1991
-42^ -70,5
-63 -14,7
-6,3 -7,2
0,1 -0,6
1,6 1,2
0,8 1,4
23,0 6,2
24,0 2,6
-3,3 -4,4
-53 -6,0
-11,5 -12,5
-9,2 -9,3
-2,0 -33
-14,9 -103
-0,1 -0,2
2,4 2,9
-5,0 -6,2
-4,3 -4,3
-18,5 -20,5
18,0 17,1
-2,8 -2,8
-4,1 -6,3
-18,0 -20,2
-14,0 -2,2
- EXTRA - AND INTRA - EC TRADE BALANCE (1)
1992
II
1992
III
1991
01-10
1992
01-10
TRADE BALANCE (Bio ECU)
-16,3
-5,1
-1,6
0,3
0,2
0,6
1,2
1,1
-1,2
-2,0
-3,4
-2,9
0,4
-1,3
0,3
1,2
-1,1
-2,5
-4,6
3,5
-0,8
-1,6
-5,7
-1,6
-9,2 -65,6 -476
-5,0 -11,0 -12,7
-1,4 -6,3 -5,3
-0,3 -0,0 -0,4
0,6 0,8 1,5
0,5 1,2 1,9
3,0 3,1 6,2
2,9 1,7 7,8
-0,9 -3,1 -3,2
-1,5 -4,5 -6,3
-2,8 -10,9 -10,2
-3,0 -7,7 -9,2
1.5 -4,1 1,2
-3,5 -7,3 -7,1
0,2 -0,2 0,7
0,9 2,2 3,4
0,5 -6,5 -2,5
0,1 -3,7 -6,4
-4,5 -17,7 -16,0
3,6 14,2 13,2
-0,7 -2,4 -2,2
-1,6 -4,3 -5,1
-4,9 -18,2 -17,9
-3,1 -2,8 -6,5
1991
10
-4,4
-0,5
-0,2
0,1
0,2
-0,1
0,6
0,4
-0,3
-0,4
-63
-1,0
0,5
-0,3
0,0
0,2
-0,3
-0,6
-1,8
1,6
-0,2
-0,4
-1,8
-0,0
1992
10
-1,6
0,2
-0,1
0,4
0,3
0,2
1,5
1,2
-0,2
-0,5
-0,7
-0,6
0,5
-1,2
0,1
0,3
0,2
-0,1
-1,4
1,5
-0,2
-0,5
-1,5
-0,4
(1) External Trade Statistics (Imports CIF, Exports FOB).
(2) Intra trade balance not zero due to CIF/FOB recording and asymétrie recording of bilateral flows by individual Member States.
'Estimate.
Imports of the EC from Africa
Mrd ECU
70
60
50
40
30
20 —
10 —
1976 1977 1978 1979 1980 1981 1982 1983 1984 1985 1986 1987 1988 1989 1990 1991
Principal countries
Totals and major products
Morocco
Vegetables and fruit
Fertilizers
Clothing and accessories
Algeria
Petroleum and petroleum products
Gas, natural and manufactured
Tunisia
Petroleum and petroleum products
Clothing and accessories
Lybia
Petroleum and petroleum products
Egypt
Petroleum and petroleum products
Liberia
Iron ore
Diamonds
Ivory Coast
Coffee
Cocoa
Wood
Ghana
Cocoa
Aluminium
Nigeria
Cocoa
Petroleum and petroleum products
Cameroon
Coffee
Cocoa
Wood
Petroleum oils, crude
Kenya
Coffee
Tea and maté
Gabon
Wood
Petroleum oils, crude
Congo
Wood
Petroleum oils, crude
Zaire
Coffee
Diamonds
Copper
Zambia
Copper
Republic of South Africa and Namibia
Vegetables and fruit
Wool and other animal hair
Metalliferous ores and metal scrap
Coal, coke and briquettes
Diamonds
Mio ECU
1990
3 043
473
422
1 052
6 940
4 051
1 779
2 250
405
961
7 888
7 471
2 299
1 460
702
98
311
1 677
152
550
272
730
183
247
4 386
112
3 912
1 379
107
122
211
655
520
118
151
1 095
138
661
602
351
1 142
118
190
638
365
317
7 652
579
217
561
875
688
1991
3 177
565
374
1 174
7 615
4012
2 181
2 332
300
1 068
8 067
7 648
2 195
1 407
249
20
134
1 617
164
593
236
717
148
231
4 563
114
4116
1 159
86
87
189
526
565
122
147
1 227
136
810
547
102
263
963
69
324
330
255
207
8 377
VALUE INDICES
1 9 8 5 = 100
B e l g i u m & Luxembourg
260
200
150-120
100
75
60
ι ι Ι ι ι t ι ι Ι ι ι Ι ι ι Ι ι ι 1 ι ι 1 ι ι Ι ι ι I t ι 1 ι ι Ι ι ι1990
1991
1992
WORLD IMPORTS
Denmar k
260
200
150
120
100
75
60
■ I ι ' I ι ι I ι ι I ι ι I ι ι I ι ι I ι ι I ι ι I i i 1 ι ι I ιGermany
1990
1991
1992
260
200
150
120
100
75
60
' ' ■ ■ ' I ι ι I ι , I I l1990
1991
1992
G r e e c e
1990
1991
1992
260
200
150
120
100
75
60
Spai n
■ ' ' ' ' ■ ■ I ' ■ ' ' ' ι ■ ■ Ι ■ ■ 1 ■ ■ ' ' ' ' ' ■ ' '
1990
1991
1992
260
200
150
120
100
75
60
F r a n c e
ι ι ι ' ι ' ι ' ■ ' Ι ' ' ' ■ ■ ' ' ■ ' ■ ■ Ι ■ ■ ' ■ ■ ' ■ ' ι ■
1990
1991
1992
260
200
150
120
100
75-60
LI r e i and
■ I ■ ■ I ■ ■ I ■ t I ■ ι Ι ι ι I ■ ι I ■ ι Ι ι i l ■
1990
1991
1992
260
200
150
120
100
75
60
I t a l y
ι Ι ι ι Ι ι ι Ι ι ι 1 ι ι Ι ι ι Ι ι t Ι ι ι Ι ι ) Ι ι ι Ι ι ι Ι ι
1990
1991
1992
260
200
150
120
100
75
60
Net her Ι ands
I "
Ι ι , Ι , , Ι , , Ι , ι ι ,
1990
1991
1992
260
200
150
120
100
75
60
Por t u g a l
ΓνΛ Ι
ι ι t ι ι 1 ι ι Ι ι < Ι ι ι Ι ι ι 1 ι t t ι ι 1 ι ι t ι ι f Μ J ι
1990
1991
1992
260
200
150
120
100
75
60
Un i t e d Ki ngdom
. ι . . ι . . ι . . I . . ■ ι
1990
1991
1992
VALUE
INDICES
1 9 8 5 = 100
B e l g i u m & Luxembourg
230
200
150
120
100
8 0L L J ' I i I ι ■ ' ι ι
1990
1991
1992
Greece
WORLD EXPORTS
Denmar k
1990
1991
1992
230
Γ
200
150
120
100
80
230
200
150-120
100
80
■ ι ' Ι ι ■ ι I
1990
1991
1992
Spa i η
ι Ι ι ι Ι , ι I Ι , ι Ι ι
Germany
1990
1991
1992
230 Γ
200
1 5 0
-120
100
80
1990
1991
1992
F r a n c e
Ι ι Ι , ι Ι ι , Ι , ι Ι ι , 1 ι ι
1990
1991
1992
I r e i and
1990
1991
1992
230
200
150
120
100
80
I t a l y
ι I t ι Ι ι ι 1 ι ι Ι ι ι Ι ι ι Ι ι ι Ι ι ι Ι ι ι Ι ι ι Ι ι ι 1 ι
1990
1991
1992
230
200
150
120
100
80
N e t h e r Ι ands
■ ' Ι Ι Ι Ι ι ι Ι , ι Ι ι ι Ι , ι Ι ι ■ Ι ι , Ι ι , Ι ι
1990
1991
1992
Por t u g a I
βο
1-
1-
11990
1991
1992
230
200
150
120
100
80
Un i t e d Ki ngdom
ι ι I ι ι I ι ι t ι ι I ι ι 1 ι ι I t ι I ι ι I ι ι I ι ι 1 ι ι I ι ι
1990
1991
1992
GENERAL SUMMARY
of EC trade by country
Values in Mio ECU
1000 1010 1011 1020 1021 1022 1023 1028 1030 1031 1032 1033 1038 1060 1070 1090 1051 1053 1057 1058 024 028 030 032 036 038 043 046 052 054 055 056 060 062 064 066 068 072 075 090 091 092 204 206 212 216 220 248 268 272 276 2S3 302 314 318 322 330 346 372 373 38B 400 404 412 442 453 458 462 480 484 496 500 504 508 512 524 528 600 604 608 616 624 628 632 636 647 649 662 664 666 669 seo 690 700 701 706 708 720 728 732 736 740 800 804 811 Partner countries WORLD IntraEC (EUR 12) ExtraEC
Class 1 EFTA Other West. Europe USA and Canada Other class 1 Class 2
ACP {69 countries) DOM TOM Other class 2 Class 4 Class 5 Miscellaneous
Meditenanean Basin OPEC ASEAN Latin America
Main countries :
Iceland Norway Sweden Finland Switzerland Austria Andorra Malta Turkey Lahna Lithuania Soviet Union Poland Czechoslovakia Hungary Romania Bulgaria Ukraine Russia Yugoslavia Skweoa Croaba Morocco Algeria Tunisia Libya Egypt Senegal! ubera lluonj ■ Ccarsr. Ghana Njojena Canrereccm Gabion Carnap Zaire Ampoa Kenwa Háncn Mauritius Soiutr Aftnica fifl UkraöBö Slates of Arranca Canada Malica Ρ'3Πήϋ~Γ3 Sanarías QaadatoapB Maflfniiqpe Colombia Venezuela Frenen Guiana Ecuador Peru Brazil! Chile Uruguay Argentina Cyprus Lebanon Syria Iran Israei Jordan Saudi Arabia Kuwait Unfed Arab Emirates Oman Pakistan India Bangladesh Sn Lanka Thailand Vietnam Indonesia Malaysia Singapore Philippines China South Korea Japan Taiwan Hong Kong Australia New Zealand Wallis S Fortuna Islands
1989 1073 552 624 489 446 717 270 893 102 589 13 436 93 472 61 396 137 113 19 597 1 413 878 115 225 54 696 19 430 2 347 37 174 40 843 15 173 26 047 779 15 365 25 406 9 918 32 029 19 092 33 568 5 536 15 166 3 858 2 558 2 587 2 548 531 2 674 5 848 1 980 6 304 2 441 413 1 055 1 622 642 3 472 1 096 1 002 569 1 348 538 588 110 718 8 185 83 660 9 812 2 760 401 151 122 169 1 525 1 559 72 326 1 040 10 446 2 752 659 2 787 524 101 775 5 352 3 197 102 6 666 2 718 1 553 144 1 271 4 181 427 419 3 362 66 2 553 3 507 4 023 1 325 9 149 6 953 46 337 9 259 6 432 5 271 1 602 1990 1129 055 663 797 462 720 276 360 108 597 14 648 94 591 58 545 143 948 20 125 1 588 712 121 523 31 274 11 118 2 538 42 298 44 982 16 748 25 356 936 16 465 25 432 10 438 34 338 20 989 36 649 5 943 16 749 5 278 2 786 3 004 1 617 593 3 043 6 940 2 250 7 888 2 299 411 702 1 677 730 4 386 1 379 1 095 602 1 142 1 092 520 125 756 5 929 85 182 9 409 2 947 490 214 97 194 1 465 1 784 75 354 803 9 203 2 617 567 3 474 581 97 1 239 5 798 3 467 92 8 224 1 851 1 509 153 1 461 4 553 501 440 4 105 84 2 863 3 606 4 694 1 257 10 603 6 557 46 224 9 159 5 916 4 822 1 569 1 1991 1199 583 702 924 493 990 293 445 110 746 14 799 101 810 66 091 150 318 19 134 1 775 689 128 720 34 660 15 566 2 669 43 493 46 849 19 947 25 903 935 17 435 25 228 10 437 34 464 22 246 36 702 6 235 18 477 6 212 4 061 3 625 1 467 752 3 177 7 615 2 332 8 067 2 195 382 249 1 617 717 4 563 1 159 1 227 547 963 632 565 105 780 8 378 91 941 9 869 3 052 468 216 125 179 1 721 1 620 67 587 839 9 378 2 528 359 3 798 616 91 1 351 6 292 3 407 84 11 163 224 1 744 127 1 569 4 758 657 543 5 014 172 3 577 4 383 5 220 1 473 14 973 7 843 51 818 11 052 6 401 4 469 1 427 1 1990 III 263 154 153 425 109 053 63 357 24 742 3 405 21 296 13 914 35 188 4 707 345 203 29 933 7 227 2 912 676 9 487 10 764 4 240 6 407 228 3 641 5 654 2 365 7 902 4 952 8 156 1 351 4 082 1 253 610 737 391 148 696 1 390 473 1 830 533 101 142 373 198 938 286 306 145 267 237 119 19 220 1 311 19 135 2 161 598 161 88 26 40 342 390 33 69 211 2 375 598 171 1 070 92 23 337 1 970 756 23 1 900 511 270 25 328 1 065 118 113 1 078 25 668 889 1 214 306 2 760 1 649 11 222 2 229 1 593 1 004 377 IV 300 452 176 847 122 880 71 692 29 731 3 920 22 968 15 073 39 095 6 230 390 167 32 309 8 166 2 977 726 12 268 13 615 4 232 6 695 218 5 538 6 663 2 687 9 010 5 615 10 189 1 727 5 177 1 626 833 894 382 155 768 2 339 643 2 695 568 90 71 421 189 2 019 446 260 151 244 570 134 42 202 1 536 20 568 2 400 1 020 101 38 18 38 417 677 16 95 199 2 207 587 94 898 180 28 357 1 279 821 15 2 981 110 443 56 342 1 015 129 117 939 27 697 891 1 365 295 2 861 1 814 12 055 2 334 1 529 1 140 342 1
I m p o t s