C O M M I S S I O N O F T H E E U R O P E A N
COMMUNITIES
Enterprises in Europe
Second report
eurosta
3 O O D
This document has been prepared for use within the Commission. It does not necessarily represent the Commission's official position.
Cataloguing data can be found at the end of this publication.
Luxembourg: Office for Official Publications of the European Communities, 1992 ISBN 92-826-4609-2
© ECSC-EEC-EAEC, Brussels · Luxembourg, 1992
PREFACE
The implementation of the Single Act, and particularly the completion of the internal market, make it essential that the Community maintain an effective enterprise policy.
Development of such a policy, preparation of its various components and assessment of their effects must be based on a sound understanding of the economic structure of European enterprises.
This second Enterprises in Europe publication draws on the joint work carried out by DG XXIII and Eurostat and illustrates the progress made in building up a statistical information system to provide for such understanding.
It is one more stage in the work underway to provide an effective statistical tool for the Community and its businesses.
.κ^Ψ^~
Heinrich von MoltkeDirector General DG XXIII
I :rBnchet
FOREWORD
Enterprises in Europe, second report Is the most recent result of a process of gradual improvement in the statistical Information available on small and medium-sized enterprises (SMEs) initiated four years ago in the context of the European Commission's programme in favour of SMEs.
After the work of the first edition in 1990 entitled Enterprises in the European Community which gave a general Impression of the structure of SMEs in the Community, this latest edition describes in greater depth and detail the main structural characteristics of SMEs.
By dedicating chapters not only to the 12 Member States of the European Community but also to five EFTA countries, this edition provides the first details of enterprises in the European Economic Area. These national presentations are complemented by a number of international comparisons between the European Community, Japan and the United States of America.
The publication is made up of an analytical section, commentary on the availability and comparability of the data, and a detailed statistical annex of national and EC data.
Enterprises in Europe, second report Is a new stage in the construction of a European business
statistics information system, the need for which is now even greater due to the increasing recognition of the need for a European enterprise policy.
The work undertaken since four years by Eurostat in conjunction with DG XXIII (the DG for enterprise policy) has made it possible to have information available which is indispensable in order to carry out further analyses with a view to developing proposals to facilitate and promote a European enterprise policy, as well as to assist in monitoring the impact of the single European market. Equally this represents a significant instrument for enterprises and their representative bodies with regara to their requirements for information.
In order to exploit existing data to a maximum, the statistical collection exercise behind this publication will be continued and developed.
Developments under way will hopefully allow the progression from this structural description to the possibility of analysis according to a range or indicators such as labour and capital inputs, profitability, demography, etc.
The availability of harmonized business data obviously conditions the possibility of correctly answering the wide range of questions of this type.
With this aim in mind, the continuation of statistical work in this area represents an important element for policy purposes as well as being an asset for enterprises and their partners.
John Jordan Photis Nanopoulos
Enterprises in Europe Table of contents
TABLE OF CONTENTS
INTRODUCTION xvii
The European Community Commission's enterprises policy xviii
The importance of SMEs xix Definition of SMEs xix The need for targeted data xix
METHODOLOGY xxi
Analytical units xxii Industry classification xxii Employment variables xxiv Turnover and value-added variables xxiv
Size breakdown of enterprises xxiv
Dominance criteria xxiv Structure of the publication xxv
CHAPTER 1 - ANALYSIS AT THE COMMUNITY LEVEL
AND INTERNATIONAL COMPARISONS 1
STRUCTURE OF EUROPEAN ENTERPRISES 2 Breakdown by size of enterprise 2
Overall structure 3 Within the European Community 3
Within different European countries 3
Micro-enterprises 3 Within the European Community 3
Within different European countries 3 Small and medium-sized enterprises (10-499 employees) 6
Within the European Community 6 Within different European countries 6 Size of SMEs in different EC countries 8 Large enterprises (500 or more employees) 9
Within the European Community 9 Importance of large enterprises in different European countries 9
Size of large enterprises in different EC countries 9
Sectoral structure 9 Overall results 10
Within the European Community 10 Within different European countries 10
Industry 11 Within the European Community 11
Within different European countries 11
Construction 12 Services 12
Table of contents Enterprises in Europe
Average sizes by sector 13 Overall structure 13
Within the European Community 13 Within different European countries 13
Industry 14 Within the European Community 14
Within different European countries 14
Construction 15 Within the European Community 15
Within different European countries 15
Services 15 Within the European Community 15
Within different European countries 15
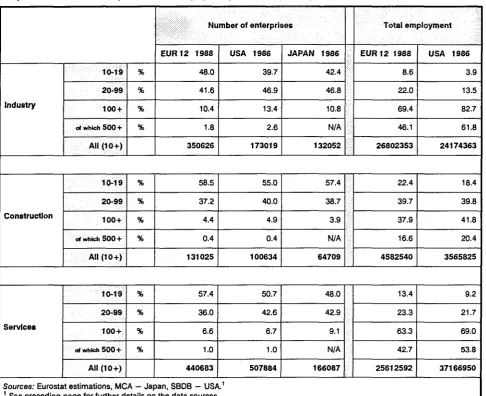
COMPARATIVE ANALYSIS OF THE POPULATION OF SMEs AND
LARGE ENTERPRISES IN THE EC, JAPAN AND THE USA 16
Overall comparison 17 Breakdown by size of enterprise 18
Breakdown by sector 19
Industry 20 Breakdown by size of enterprise 20
Overall comparison 20 Comparison of main sectors 20
Breakdown by sector 20
Construction 21 Services 21
Breakdown by size of enterprises 21 Overall comparison 21 Comparison of main sectors 21
Breakdown by sector 21
ACTIVITIES BY SIZE OF ENTERPRISE 22
Size-class predominance by activity 22 Micro-enterprises at the EUR 12 level 22
SMEsatthe EUR 12 level 22 Large enterprises at the EUR 12 level 23
Overall results in European countries 23
Stages in the production line 23 Overall results 23 Analysis of the different production lines 23
Leather 23 Flour to bread 24 Paper 24 Textiles 24 Construction 24 Wood 25 In high-tech activities 25
Overall results 25 Positioning of micro-enterprises 26
Positioning of small and medium-sized enterprises 26
Enterprises in Europe Table of contents
In the most vulnerable sectors 26 Comparison of SMEs between the EC, Japan and the USA 26
Overall results 26 Sectoral comparison 27 Divergences amongst EC countries 27
ANALYSES OF APPARENT LABOUR PRODUCTIVITY 32
Performances at the EUR 12 level 32 Different profiles by size of enterprise 32
Overall results 32 The larger the enterprises the higher the productivity ratio 32
Productivity ratio higher in SMEs than in large enterprises 33
Performances of micro-enterprises 33 Size dispersion of apparent labour productivity 34 Performance levels on a country-by-country basis 34
Overall results 34 Sectoral analysis 35 Analysis by size-class 36
Micro-enterprises 36
SMEs 36 Large enterprises 37
Analysis of vulnerable sectors 37
CHAPTER 2 - ANALYSIS BY COUNTRY 39
BELGIUM 41
Overall structure and development 42 Sectoral breakdown 42 Breakdown by size of unit 43 Predominant size-classes 44
Industry 44 Sectoral distribution 44
Breakdown by size of unit 44 Economic indicators 45
Construction 45 Sectoral distribution 45
Breakdown by size of unit 45 Economic indicators 46
Services 46 Sectoral distribution 46
Breakdown by size of unit 46 Predominant size-classes 47 Economic indicators 47
DENMARK 49
Overall structure and development 49 Sectoral breakdown 49 Breakdown by size of unit 50 Predominant size-classes 51
Industry 51 Sectoral breakdown 51
Breakdown by size of enterprise 52 Predominant size-classes 52
Table of contents Enterprises in Europe
Construction 52 Sectoral breakdown 52
Breakdown by size of unit 52
Services 53 Sectoral breakdown 53
Breakdown by size of unit 53
GERMANY 55
Overall structure and development 55 Sectoral breakdown 56 Breakdown by size of enterprise 56
Industry 57 Sectoral breakdown 57
Breakdown by size of enterprise 57 Predominant size-classes 58
Economic indicators 58
Construction 59 Sectoral breakdown 59
Breakdown by size of enterprise 59
Economic indicators 59
Services 59 Sectoral breakdown 59
Breakdown by size of enterprise 59 Predominant size-classes 60 Economic indicators 60
GREECE 61
Industry and repair services 61 Overall structure and development 61
Breakdown by size of establishment 62 Average employment 62 Predominant size-classes 62 Sectoral breakdown of industry 63
Economic indicators 63
SPAIN 65
Overall structure and development 65 Sectoral breakdown 65 Breakdown by size of enterprise 66
Predominant size-classes 67
Industry 67 Sectoral breakdown 67
Breakdown by size of enterprise 68
Construction 68 Sectoral breakdown 68
Breakdown by size of enterprise 68
Services 69 Sectoral breakdown 69
Enterprises in Europe Table of contents
FRANCE 71
Overall structure and development 71 Sectoral breakdown 72 Breakdown by size of enterprise 72
Industry 74 Sectoral breakdown 74
Breakdown by size of enterprise 74
Economic indicators 75
Construction 75 Sectoral breakdown 75
Breakdown by size of enterprise 75
Economic indicators 76
Services 76 Sectoral breakdown 76
Breakdown by size of enterprise 76 Average number of persons employed 76
Predominant size-classes 77
Economic indicators 77
IRELAND 79
Industry 79 Sectoral breakdown 79
Breakdown by size of establishment 80
Economic indicators 80
Construction 81 Services 81
Sectoral breakdown 81 Breakdown by size of establishment 82
Economic indicators 82
ITALY 83
Overall structure and development 83 Sectoral breakdown 84 Breakdown by size of enterprise 84
Industry 85 Sectoral breakdown 85
Breakdown by size of enterprise 85 Average employment 85 Predominant size-classes 86
Economic indicators 86
Construction 87 Services 87
Sectoral breakdown 87 Breakdown by size of enterprise 87
Average employment 87 Predominant size-classes 87
Economic indicators 88
LUXEMBOURG 89
Overall structure and development 89 Sectoral breakdown 90 Breakdown by size of enterprise 90
Table of contents Enterprises in Europe
Industry 91 Sectoral breakdown 91
Breakdown by size of enterprise 91
Economic indicators 91
Construction 92 Services 92
Sectoral breakdown 92 Breakdown by size of enterprise 93
Economic indicators 93
THE NETHERLANDS 95
Overall structure 95 Sectoral breakdown 95
Breakdown by size of enterprise 96
Industry 97 Sectoral breakdown 97
Breakdown by size of enterprise 97
Economic Indicators 98
Construction 98 Sectoral breakdown 98
Breakdown by size of enterprise 99
Economic indicators 99
Services 99 Sectoral breakdown 99
Breakdown by size of enterprise 99
Economic indicators 100
PORTUGAL 101
Overall structure and development 101 Sectoral breakdown 102 Breakdown by size of enterprise 103
Industry 103 Sectoral breakdown 103
Breakdown by size of enterprise 104 Predominant size-classes 104 Economic indicators 104
Construction 105 Sectoral breakdown 105
Breakdown by size of enterprise 105
Economic indicators 105
Services 105 Sectoral breakdown 105
Breakdown by size of enterprise 106
Average employment 106 Predominant size-classes 106
Economic indicators 106
THE UNITED KINGDOM 107
Overall structure and development 107 Sectoral breakdown 108 Breakdown by size of enterprise 109
Enterprises in Europe Table of contents
Industry 110 Sectoral breakdown 110
Breakdown by size of enterprise 110 Predominant size-classes 110 Economic indicators 111
Construction 111 Breakdown by size of enterprise 111
Economic indicators 111
Sen/ices 112 Sectoral breakdown 112
Breakdown by size of enterprise 112
Economic indicators 112
ICELAND 113
Overall structure and development 113 Sectoral breakdown 114 Breakdown by size of enterprise 114
Predominant size-classes 115
Industry 115 Sectoral breakdown 115
Breakdown by size of enterprise 116
Services 116 Sectoral breakdown 116
Breakdown by size of enterprise 117
NORWAY 119
Overall structure and development 119 Sectoral breakdown 119 Breakdown by size of establishment 119
Industry 120 Sectoral breakdown 120
Breakdown by size of establishment 120
Construction 121 Services 121
Sectoral breakdown 121 Breakdown by size of establishment 121
Economic indicators , 122
AUSTRIA 123
Overall structure 123 Sectoral breakdown 124
Breakdown by size of enterprise 124
Industry 125 Sectoral breakdown 125
Breakdown by size of enterprise 125 Predominant size-classes 126 Economic indicators 126
Construction 127 Sectoral breakdown 127
Breakdown by size of enterprise 127
Table of contents Enterprises in Europe
Services 127 Sectoral breakdown 127
Breakdown by size of enterprise 127 Predominant size-classes 128 Economic indicators 128
FINLAND 129
Overall structure and development 129 Sectoral breakdown 130 Breakdown by size of enterprise 130
Average employment 131 Predominant size-classes 131
Industry 131 Breakdown by size of enterprise 132
Economic indicators 132
Construction 132 Services 133
Breakdown by size of enterprise 133
Economic indicators 133
SWEDEN 135
Overall structure and development 135 Sectoral breakdown 135 Breakdown by size of enterprise 137
Industry 138 Breakdown by size of enterprise 138
Economic indicators 138
Construction 138 Breakdown by size of enterprise 138
Economic indicators 138
Services 138 Breakdown by size of enterprise 138
Enterprises in Europe Table of contents
ANNEX A - Notes on the methodology A 1
Description of the tables requested by Eurostat A 3
Definitions A 3
Note 1 A 3 Units A 3
Enterprise A 3 Establishment A 3
Variables A 4 Employment A 4
Persons employed (total employment) A 4
Employees A 4
Turnover A 4 Value added at factor costs A 4
Exchange rates A 5 Confidentiality A 5
COUNTRIES
Belgium A 6 Denmark A 7 Germany A 8 Greece A 9 Spain A 10
France A 1 1 Ireland A 12
Italy A 14 Luxembourg A 15 The Netherlands A 16 Portugal A 17 The United Kingdom A 18 Iceland A 21 Norway A 22 Austria A 23 Finland A 24 Sweden A 25
Table of contents Enterprises in Europe
ANNEX Β - Tables Β 1
EUR 12 Β 1
Enterprises 1988 Β 2 Persons employed 1988 Β 4 Turnover 1988 Β 6
BELGIUM Β 9
Employers 1988 Β 10 Employees 1988 Β 12 Turnover 1988 Β 14 Employers 1989 Β 16 Employees 1989 Β 18 Turnover 1989 Β 20
DENMARK Β 23
Legal units 1988 Β 24 Employees 1988 Β 26 Legal units 1989 Β 28 Employees 1989 Β 30
GERMANY Β 33
Enterprises 1988 Β 34 Persons employed 1988 Β 36 Turnover 1988 Β 38 Value added 1988 Β 40
GREECE Β 43
Establishments 1988 Β 44 Persons employed 1988 Β 45 Turnover 1988 Β 46 Value added 1988 Β 47 Establishments 1989 Β 48 Persons employed 1989 Β 49 Turnover 1989 Β 50 Value added 1989 Β 51
SPAIN Β 53
Enterprises 1988 Β 54 Employees 1988 Β 56 Enterprises 1989 Β 58
Employees 1989 Β 60
FRANCE Β 63
Enterprises in Europe Table of contents
IRELAND Β 73
Establishments (Nace 1-4), Enterprises (Nace 5) 1987 Β 74 Persons employed (Nace 1-4), Employees (Nace 5) 1987 Β 75 Gross output (Nace 1-5) 1987 Β 76 Net output (Nace 1-4), Gross value added (Nace 5) 1987 Β 77 Establishments (Nace 1-4 and 6)1988 Β 78 Persons employed (Nace 1-4 and 6) 1988 Β 79 Gross output (Nace 1-4) 1988, Turnover (Nace 6) 1987 Β 80 Net output (Nace 1-4) 1988, Gross margin (Nace 6) 1987 Β 81
ITALY Β 83
Enterprises 1988 Β 84 Persons employed 1988 Β 86 Turnover 1988 Β 88 Value added 1988 Β 90
LUXEMBOURG Β 93
Enterprises 1987 Β 94 Persons employed 1987 Β 96 Turnover 1987 Β 98
THE NETHERLANDS Β 101
Economic units 1988 Β 102 Persons employed 1988 Β 104 Turnover 1988 Β 106 Value added 1988 Β 108
PORTUGAL Β 111
Enterprises 1988 Β 112 Employees 1988 Β 114 Turnover 1988 Β 116 Enterprises 1989 Β 118 Employees 1989 Β 120
Turnover 1989 Β 122
THE UNITED KINGDOM Β 125
Enterprises 1988 Β 126 Persons employed 1988 Β 128 Turnover 1988 Β 130 Enterprises 1989 Β 132 Persons employed 1989 Β 134 Turnover 1989 Β 136
ICELAND Β 139
Enterprises 1988 Β 140 Persons employed 1988 Β 142 Enterprises 1989 Β 144 Persons employed 1989 Β 146
NORWAY Β 149
Table of contents Enterprises in Europe
NORWAY (cont.)
Establishments (Nace 1-4) 1989 Β 153 Employed (Nace 1-4) 1989 Β 154 Establishments (Nace 5, 8, 9) 1989 Β 155 Persons employed (Nace 5, 8, 9) 1989 Β 155 Gross value added (Nace 5, 8, 9) 1989 Β 155 Establishments (Nace 6) 1989 Β 156 Persons employed (Nace 6) 1989 Β 156 Gross production value (Nace 6) 1989 Β 156
AUSTRIA Β 157
Enterprises 1988 Β 158 Persons employed 1988 Β 160 Gross production value 1988 Β 162 Net production value 1988 Β 164
FINLAND Β 167
Enterprises 1988 Β 168 Persons employed 1988 Β 170 Turnover 1988 Β 172 Enterprises 1989 Β 174 Persons employed 1989 Β 176 Turnover 1989 Β 178
SWEDEN Β 181
Enterprises 1988 Β 182 Employees 1988 Β 184 Turnover 1988 Β 186 Value added 1988 Β 188 Enterprises 1989 Β 190 Employees 1989 Β 192 Turnover 1989 Β 194 Value added 1989 Β 196
ANNEX C
Introduction Enterprises in Europe
This statistical project is an integral part of the Com munity's enterprise policy. Based upon the principle of effective competition, a reasonable regulatory en vironment and the provision of services to SMEs, the development of European enterprise policy is of great importance in increasing the competitiveness of the European economy, for employment growth and for economic and social cohesion in Europe.
The Community is attaching increasing importance to enterprises and to SMEs, in particular, in the develop ment of the single market.
These objectives were confirmed by Council decision of 17 June 1991 which awarded further resources to the Commission towards their achievement. That de cision followed the Commission's communication of 18 December 1990, Enterprise Policy: a new dimen sion, which detailed progress achieved and outlined future plans.
To achieve these objectives the Commission has closely to examine the potential effects on SMEs of its legislative programme and to consider the services which SMEs require.
1 . The EC Commission's
enterprises policy
The 1980s saw a growing recognition of the need to pay more attention to the conditions under which enterprises operate and to the importance of small businesses foran economy. In recognition of this, the Community in November 1987, adopted a resolution on an Action Programme for SMEs which had the clear objective of stimulating enterprises in the Com munity.
In the light of the internal market programme, this policy was strengthened by the Council decision of 28 July 1989 on the improvement of the business environment and the promotion of the development of enterprises, and in particular small and medium sized enterprises, in the Community.
The Commission's enterprises policy, as reflected in that decision, can be considered to have three main objectives:
• the removal of undue administrative, financial and legal constraints which check the develop ment and creation of enterprises, and in particu lar SMEs;
• to provide information and assistance to enter prises, and in particular SMEs, on Community policies, regulations and activities and those of each Member State which concern or are likely to concern them;
• the encouragement of cooperation and partner ship between enterprises, and in particular SMEs, from different regions of the Community.
Some basic questions arise, such as:
• how to define SMEs so as to be aware when size becomes an important discriminating variable?
• what is the relative importance of SMEs in differ ent areas of activity and countries?
• can criteria and data be developed for evaluating the impact of measures and programmes on SMEs?
These and similar questions cannot be answered without a framework of suitable statistical information on the size distribution of enterprises according to criteria such as employment and output, by sector of activity and country.
Consequently, a significant part of the Commission's action is concerned with the improvement of regular statistical information and the creation of a SME da tabase.
The statistical project of the Commission aims at:
• creating a framework of comparable basic infor mation to be used in the design of legislative proposals and programmes affecting businesses and in their followup;
Enterprises in Europe Introduction
2 . The importance of SMEs
The singular importance attached to SMEs by the Community is based upon sound economic and so-cial reasons. SMEs generally appear to be an import-ant provider of new jobs not only in the ever-growing services sectors but also in the manufacturing indus-tries, which were traditionally large-scale, and in other areas subject to major structural changes.
A general framework providing sound information about the size structure of enterprises according to employment and output variables at a detailed secto-ral level, as the one presented here, should therefore provide precious help for the definition of SMEs. It can also be useful in the context of the impact assessment system, whereby the main Community legislative pro-posals have to be accompanied by an evaluation of their impact on enterprises, notably on SMEs.
They also seem to be more responsive to market needs, more adaptable to change and more innova-tive in their ability to meet customer demands. Par-ticularly significant is the part played by SMEs in providing indigenous sub-contracting facilities to the larger high-technology firms competing in world mar-kets. As such, SMEs play a critical role in the compe-titive structure of the Community in relation to oth¿r
major trading areas of the world.
Comparisons of enterprise distribution in USA, Japan and the EFTA countries show similar patterns of SME importance as in the Community. Although differen-ces are observed in some areas, for example, in the average size of SMEs, their contribution to total and sectoral employment is globally confirmed.
Job-generation, organizational and productive flexi-bility, adaptability to a changing environment, are all key-elements attached to small business activity. The presence of a dynamic small business sector becomes an important factor for economic and social cohesion in Europe, integration of European and world markets, and Indeed for social stability in the Central and Eastern Europe countries facing trau-matic upheavals as they move from one established economic pattern to another.
Definition of SMEs
The present statistics should be of assistance to de-cision-makers when they need to target measures on certain groups of businesses, and especially SMEs.
In its recent report to the Council on the Definitions of SMEs used in the context of Community activities,
the Commission stressed the need for a flexible ap-proach on the issue of SME definition. Different defini-tions are justified depending on the aim of the measure considered. It is therefore essential to target effectively the group of businesses deserving special support. One must be able to discover where size becomes an important discriminating factor and choose the most adequate SME measure. The Com-mission's approach also favours SME definitions based on a combination of several criteria, namely: turnover, total balancesheet, number of employees and indépendance.
4. The need for targeted data
The development of a comprehensive and easily ac-cessible database on SMEs has a very important role to play in enterprise policy through the provision of high quality information to both the public and private sectors of Europe.
Policy makers need targeted data to be able to moni-tor the effects on enterprises of the single market and of the creation of the European Economic Area. En-terprise policy needs also to follow and assist Euro-pean enterprises in an international competitive environment.
Business people also need to be well informed on the size, structure and dynamics of SMEs since they represent a large and potential market for larger firms and an Increasingly vital source of supply often through sub-contracting. SMEs need to be able to position themselves in relation to other enterprises in their own sectors and in relation to other SMEs in other countries if they are to develop well-grounded European strategies.
The presence of a sufficient volume of efficient SMEs is a pre-requisite for the development of competitive business activities and economic welfare in all sec-tors.
A harmonized analytical framework descending to both sectoral and national level is necessary for the identification of those endogenous and exogenous factors which determine structural differences and changes through time in business activities. Diversity as opposed to uniform evolution, heterogeneity as opposed to homogeneous structure, are due to the inherent nature of economic reality, not just differen-ces in data collection methods.
The information provided here and that which will be developed in the future should therefore be of real interest to SMEs, policy-makers and all those with a part to play in Europearn construction in this last part of the century.
Methodology Enterprises in Europe
The data presented in this report come from both public and private sources. As a rule, official data from national statistical institutes (NSIs) have been used whenever possible and missing information has been supplemented with data from other sources when available. These data originated in most cases from official databases or inquiries. Annex A describes in detail, country by country, the sources of data used as well as the nature of the estimations made in constructing the EUR 12 tables presented.
As can be seen in Annex A, there still exists a wide diversity in the statistical services of the Member States and their abilities to produce information on SMEs. As a result, a standard data-processing proce dure was possible for only certain countries while for the remainder special procedures had to be de veloped.
The extension of the SME database to the European Free Trade Association (EFTA) countries has not led to significant additional difficulties. Although the na tional methodologies differ from the EC recommen dations, the difference is not sufficient to hamper all comparison with EC data.
The following principles were established from the outset:
• the analytical unit is the enterprise;
• the industrial classification is NACE;
• the three economic variables for which data are collected are total employment (paid and un paid), turnover (total sales) and value added.
No attempts have been made at the national level to produce a set of tables fully compatible with the original standard specifications. The only treatment to which the data presented in Annex Β have been submitted was a thorough data quality control. In some cases the transcoding of national nomencla tures to NACE codes and/or some additional pro cessing was necessary to prevent confidential data from being disclosed accidentally in this publication. The transcoding of national nomenclatures was necessary mainly for the data on EFTA countries.
1 . Analytical units
The enterprise is the basic unit for structural statistics such as those shown in this publication. In a number of cases national data refer to a different unit such as the establishment (Ireland, Norway), the legal unit (Denmark) or the employer (Belgium).
Data referring to different units are (in a strict sense) incompatible which makes direct comparisons be tween certain countries extremely difficult. This factor has been taken into consideration in the analyses by country.
2 . Industry classification
The transformation of existing national classifications of economic activity into the Community's NACE nomenclature posed difficulties which, in all cases, were overcome — though with varying degrees of success as national classifications do not always allow a one to one conversion into NACE codes.
NACE is the official general industrial classification of economic activities within the European Com munities, first established by Eurostat in 1970.lt divides economic activity sectors into 10 very broad divisions (one-digit level), sub-divided into more de tailed industry classes (two-digit level) and further divided into groups and sub-groups (three and four-digit levels). Enterprises in the NACE 0 division 'agri culture, hunting, forestry and fishing', the so-called primary sectors, are excluded from this publication. All other NACE divisions (1 to 9) are included. How ever, units active in non-market services and public administration have also been excluded.
The analysis in this publication is presented at the one and two-digit levels, depending upon the level of detail available. The full list of the one and two-digit level NACE is attached to Annex C.
For presentational purposes and to avoid unnecess arily detailed sectoral descriptions, some of the NACE classes have been regrouped into broader sectoral categories. The larger part of the graphs and tables shown in the country analyses refer to this ad hoc
Enterprises in Europe Methodology
NACE
1
21 to 24, 31 25, 26, 48 32,37 33,34 35,36 41/42 43 to 45 47 46,49
500 501 502 503 504
61,63 64/65 66 67 7
81,82,831,832
833, 834, 85 84
835 to 839 62,92 to 97, 99 98
Label
Energy
Metal processing Chemical industry Machinery
Electrical engineering Transport equipment Food industry
Textile and leather industries Printing
Wood and miscellaneous industries
Building Construction Civil engineering Installation Completion work
Wholesale (together with retailing: distributive trades) Retail sale
Horeca (hotels and catering) Repair
Transport services Banking and finance
(together with real estate and renting : finance and renting) Real estate
Renting
Business services Other services Personal services
Graphs
Energy
Metal Chem Machin Elee (eng) Trans (equip) Food Text
Print Wood
Wsale Retail Horeca Repair Trans (serv) Finan
Busin (serv) Other Person (serv)
Methodology Enterprises in Europe
3. Employment variables
The 'total employment' variable has been replaced for certain countries by 'paid employment' (number of employees), excluding therefore both the self-em-ployed and unpaid family workers. This means that, for instance in Belgium or Portugal, no measure of employment in the self-employed category (size-class 0) was available. In other countries the data used did not allow the separation of the zero class from the 1-9 class and in those cases they are grouped together.
According to this classification, small and medium-sized enterprises are those in the range of 10 to 499 employees. This can be regarded as an SME class in the restricted sense, although it is clear that micro-enterprises are also SMEs. Throughout the publica-tion the term SME will as such refer to the restricted definition, i.e. to the category of enterprises with at least 10 employees. The smallest enterprises (0-9 size-class) will always be referred to as micro-enter-prises.
It must be emphasized that this classification is mere-ly intended to facilitate the anamere-lysis of the data at a general level. It indeed does not represent a formal definition of an SME.
Turnover and
value-added variables
6. Dominance criteria
Most countries have provided data on turnover. The value-added variable is more complex to obtain and in several cases no information is available. Value added is an output measure used by economists to assess the wealth generated by an enterprise through its transformation of bought-in goods and services into marketable goods and services. It is measured by deducting from sales revenues the cost of all raw materials, components and brought-in services used by the firm. Value added, which is the contribution to the gross domestic product, is a more accurate measure of wealth creation than the more readily available turnover measure.
5 . Size breakdown of enterprises
The size of an enterprise was determined with respect to the variable 'number of employees'. Once again, not all countries have been able to use this criterion and data refer to total employment as the size-indica-tor of an enterprise.
To assign enterprises to employment size-classes the following breakdown was used:
0, 1-9, 10-19, 20-99, 100-199, 200-499, 500 or more employees.
The above classification, although important for spe-cific industry analysis, is too detailed for presen-tational and general purposes and a much broader set of categories is necessary, such as that of micro, small, medium and large enterprises. These ca-tegories correspond to the following regrouping by size:
Micro: 0-9 employees
Small: 10-99 employees
Medium: 100-499 employees
Large: 500 and more employees.
It is useful to know whether a sector of an economy may be classified as a micro, small, medium or large business sector in the sense that a large percentage of enterprises in that sector fall into one of these four classes.
For this purpose one must define, in addition to the definitions of micro, small, medium and large enter-prises, the percentage of enterprises of each size-class in a sector in order that the sector be considered as being in a particular class. These sectoral class boundaries were drawn by looking at the empirical findings. The data collected on the breakdown by size of enterprise clearly shows, in many sectors and countries, a high concentration of enterprises in the micro-class. Therefore, most sectors could be classed as micro or small if the rules adopted that, say 60%, of the enterprises had to be ofthat size. To avoid classifications lacking analytical significance, two working rules have been adopted which enable more interesting conclusions to be developed from the data available in this study.
The rules are:
• Dominance in terms of employment: for coun-tries for which employment in size-class 0 is shown separately, the following criteria is ap-plied: the sector is said to be dominated by a size-category when this category represents the highest share of employment in that sector.
• Dominance in terms of number of enterprises: for countries where employment was limited to paid personnel, i.e. no employment data for size-class 0, the following applies:
'large business' sectors are those where enterprises employing 500 people and over account for 5% or more of enterprises in the sector;
Enterprises in Europe Methodology
'micro-business' sectors: those where enter prises employing from 0 to 9 people account for 80% or more of the total number of enterprises in the sector;
SME sectors in the restricted sense comprise the rest.
This rule has been defined in accordance with the empirical findings on the size distribution of the num ber of enterprises, but considers only the percentage of enterprises of a given size within a sector: it does not look at the contribution that enterprises of a given size make to important variables such as employment and turnover.
As the reader will later discover, there are relatively few medium and large enterprises in the EC, but they have a large share of output and employment.
It is also possible to have a micro-sector where, nevertheless, a majority of employment is provided by SMEs In the restricted sense, in which case the micro-sector could then be said to be dominated by SMEs.
Structure of the publication
This report is divided into two chapters and three annexes.
Chapter 1 presents the results of the analysis at the EC level and other international comparisons both within the framework of the European Economic Area
(EEA) and between the EC, Japan and the United States of America.
Chapter 2 contains the descriptions for the 17 coun tries for which data were available. These country sections are structured, as far as possible, following a common format. However, as the amount of infor mation available varied with the country, the level of detail of the different analyses varied accordingly. Annex A shows the main methodological charac teristics by country as well as some notes concerning data limitations.
Annex Β includes, in addition to the EUR 12 estimates, all data available per country for the different variables and/or years, at the NACE two-digit level. The same data will become available from Eurostat for public use, broken down further to the NACE three-digit level.
CHAPTER 1
Structure of European enterprises Enterprises in Europe
STRUCTURE OF EUROPEAN ENTERPRISES
Introductory note
1 . Breakdown by size of enterprise
Note relating to methodology
Data for the whole of the EC (EUR 12) had to be estimated because of major methodological discrep-ancies with the original specifications and the non-availability of parts of the data for some countries (see Annexes A and B).
Coverage extends to NACE divisions 1 to 8. Personal and other services (NACE division 9) are therefore excluded.
The total number of enterprises (in the eight NACE divisions combined) stood at 11.6 million in 1988. They employed about 80.7 million persons.
Data for Ireland and Greece have been excluded from the country-by-country analysis because of specific methodological problems: different statistical unit, in-complete sectoral coverage and non-availability of the class of micro-enterprises. Data on medium and large enterprises are not shown for the Netherlands for reasons of confidentiality.
With regard to data for the micro-enterprises, the situation differs by country. For only five EC countries and Austria, the zero size-class (self-employed) was presented separately from size-class 1-9. The data for Italy and the United Kingdom regroups the two size-classes, with, in addition, a potential underestimate of the combined size-class in Italy. Finally, industry data in the Netherlands as well as Danish data (all sectors) only comprise enterprises with salaried personnel, thereby excluding the self-employed.
Table 1
Micro-enterprises by country (NACE divisions 1 to 9,1988)
1988
Belgium 2
Denmark1
Germany Spain 2
France Italy *
Luxembourg (1987) The Netherlands 3
Portugal2
The United Kingdom
Enterprises
Total
525789 126239 2125786 2018595 2009872 1698503 14684 156702 642612 2629913
Micro (0-9)
%
94.9 77.4 87.3 94.4 93.2 92s
88.1 80.9 95 93.2
Employment
Total
2570217 1640331 18731643 6996416 13506424 11683815 139091 2588859 2204166 20425250
Micro (0-9)
%
17.2 19.5 17.1 24.1 28.2 47.5* 22.1 24.7 24.4 26.2 1 (1-9) for the number of enterprises; (1-9) for employment.
2 (0-9) for the number of enterprises; (1-9) for employment. 3 (1-9) for industry; (0-9) for services.
4 Without NACE division 9.
Enterprises in Europe Structure of European enterprises
Figure 1 a Figure 1b Figúrele
EUR 12 1988
Distribution of enterprises by employment size-class
Class 10Θ9 7.4 0. Class 100
% Enterprises
EUR 12 1888 Distribution of employment
by employment size-class
Class 09 ^58 S B a an.| | 29. * Class ioyy ^ J H ß >
15.4 ^ ^ Í 4 _ ^ _ _ ^ Class 100499
% Persons em
Hg\
Qass 600» ployed
EUR 12 1986 Distribution of turnover
by employment size-class
Class 1099 26.9 ^£
M^mxa f\
22.6 ^ - < Class 100499
α ass 09
i f l ¡¡Stilig21'8
* k
£§¡1 "V^***9·7
^βα—^—' Class 500*
% Turnover
1 . 1 . Overall structure 1 . 2 . Micro-enterprises
1 . 1 . 1 . Within the European Community 1.2.1 . Within the European Community
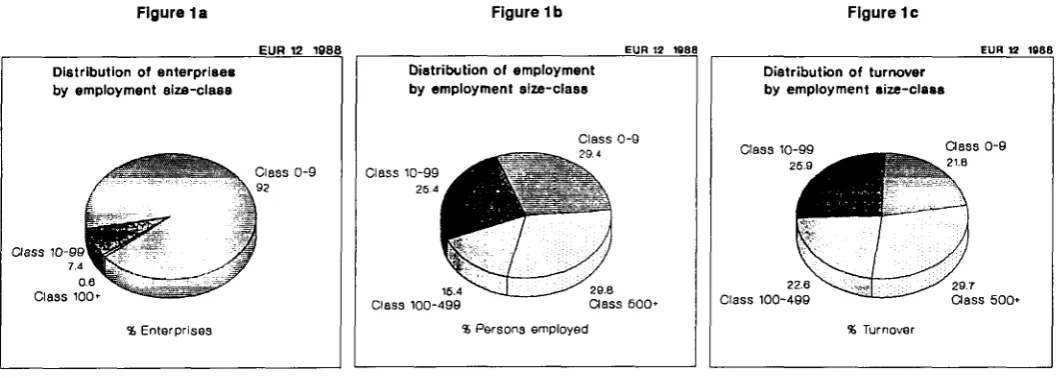
Ninetytwo per cent of all enterprises belonged to the microclass and 7.9% were small or mediumsized (Figure 1a).
Large enterprises accounted for 11 350 units only, or 1 per 1 000 enterprises. When presented in terms of employment and even more so in terms of turnover, the situation was clearly different (Figures 1 b and 1 c).
Microenterprises accounted for a smaller share of total employment than large ones (29 and 30% re spectively) as well as a smaller turnover (22 as op posed to 30%). SMEs represented 4 1 % of total employment and 48.5% of total turnover.
The average size of an EC enterprise for all sectors combined was seven persons. This low average size was also found at the national level except in Den mark, with 80% of the enterprises recording fewer than 10 employees in all of the other countries.
1 .1 .2 . Within different European countries
The geographical ranking of enterprises by size was very clear, the northern countries being characterized by the relatively highnumber of medium and large enterprises while, on the contrary, the southern coun tries recorded a very large number of microenter prises (see Charts 1 and 2).
Iceland represented a particular case in that the pro portion of both micro and mediumsized enterprises was high.
There were an estimated 10.7 million microenter prises in NACE divisions 1 to 8 in the EC, equivalent to 92% of the total number. These enterprises were the main employers in the construction industry (43% of the total workforce) and in the distributive trades and Horeca sectors (50%).
1 .2 .2 . Within different European countries
Microenterprises accounted for a much larger share of the total number of enterprises in the southern European countries, Belgium and Iceland than in northern Europe. Their share of the total number of enterprises exceeded 90% in Belgium, Spain, France, Portugal, Italy and the United Kingdom (Table 1).
The highest density of microenterprises was ob served in Belgium, Spain, Portugal and Iceland with 51, 49, 59 and 70 enterprises per 1 000 inhabitants respectively. These countries preceded the United Kingdom, France (which had a large number of microenterprises in its southern regions), Germany, Italy and Finland with 42, 32, 30, 27 and 20 micro enterprises per 1 000 inhabitants respectively.
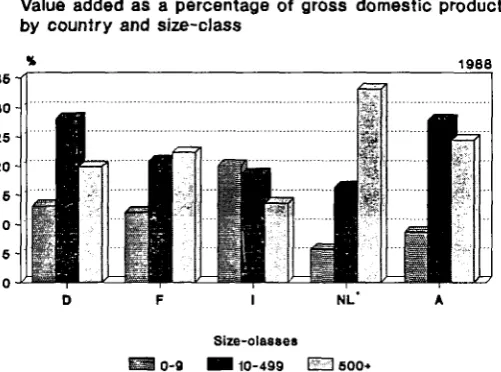
The importance of the microenterprises in Italy is particularly noted with regard to production. They generated more than 20% of the Italian GDP, against 13% in Germany, 12% in France and less than 10% in the other countries (Figure 2). The role played by these enterprises and their specific organization have been well described in several studies, in particular in the EmiliaRomagna and Tuscany regions.
Within class 09, the weight of the selfemployed in numerical terms was particularly high in France and Spain (more than 50% of all enterprises) and low in Austria, Germany and Luxembourg.
[image:33.595.35.565.91.280.2]Chart 1: Density of micro-enterprises (0-9 employees), 1988
Source: Eurostat.
Number of micro-enterprises per 1 000 inhabitants
not available
25 and < 45
Chart 2: Density of medium and large enterprises (100 employees or more), 1988
■
xxxxxxxi xxxxxxxi xxxxxxxi
xxxxxxxi
Source: Eurostat.
Number of medium and large enterprises per 10 000 inhabitants
not available
< 2
> 2 and < 3
> 3
Structure of European enterprises Enterprises in Europe
Value added as a percentage of gross domestic product by country and sizeclass
[image:36.595.170.421.90.276.2]1988
Figure 2
Size-olasses
L~3 0-9 Β 10-499 E H
500-Class 0 available for services, but not for ¡ndustrv and constructioa
1.3 . Small and medium-sized enterprises (10-499 employees)
1.3 .1 . Within the European Community 1 .3 .2 . Within different European countries
The number of SMEs in the whole of the EC was estimated at around 911 000 (excluding NACE divi sion 9) and they accounted for 33 million persons employed. Small enterprises (1099 employees) rep resented 94% of the SME sizecategory (55% in size class 1019 and 39% in sizeclass 2099). About 41.5% of employment was found in the 2099 sizeclass. SMEs having between 200 and 499 employees (2% in terms of the number of enterprises), accounted for 21% of total SME employment which was higher than the share of the small enterprises in class 1019, notwithstanding the dominance of the latter in numeri cal terms.
At the sectoral level, SMEs dominated the consumer goods industry (NACE division 4): they employed 62% of all workers in that sector, all sizes combined.
Denmark, Luxembourg, Germany and Spain were countries where SMEs played the most important role: 56% of all employees in Denmark were em ployed by an SME, 51.5% in Luxembourg and 47% in the remaining two countries (Chart3). German SMEs employed as many persons as those in France and Italy combined (8.7 million persons). The highest ratios of total employment in SMEs as a proportion of the active population were found in the same four countries as well as in Austria (Figure 3).
Italian, Swedish and French SMEs were situated at the other end of the ranking with 17, 21 and 22% respectively.
The employment share of SMEs was the lowest In France, the United Kingdom (39% of total employ ment) and Italy (34%). Contribution of SMEs to GDP reached 28% in Germany and Austria and about 20% in both France and Italy.
Employment as a percentage of active population by country and sizeclass
Figure 3
Size-classes
ESÜ Micro I B SME L, I Large
No micro sizeclass as class 0 is not available. Figures for Luxembourg refer to 1987.
[image:36.595.63.418.570.770.2]Chart 3: Weight of SMEs in terms of employment, 1988
Source: Eurostat.
Percentage of total employment
not available
<40%
> 40% and < 45%
> 45%
Structure of European enterprises Enterprises in Europe
1 .3 .3 Size of SMEs in different EC countries Figure 4
The proportion of small enterprises within the group of SMEs was higher than 90% in all countries, all sectors combined. Their share of employment sur passed that of the mediumsized enterprises in all countries except the United Kingdom (Table 2).
The largest SMEs, in terms of the average employ ment, were situated in Luxembourg and the United Kingdom with 56 and 45 persons employed per en terprise respectively. Small enterprises accounted for only 90% of enterprises with at least 10 employees and about 20% of total employment in that same class. However, they represented 91% of all SMEs in terms of number of enterprises and 43% in terms of total employment.
Conversely, Italian SMEs were on average the smal lest, with 29 persons employed (Figure 4). Indeed, small enterprises represented 95% of all enterprises with 10 or more employees and 45% of total employ ment in that group (and 96% of all SMEs, 71 % of SME employment).
Average number of p e r s o n s e m p l o y e d in SMEs (10499), by c o u n t r y , all s e c t o r s included
[image:38.595.312.574.195.382.2]L 1-UK - |
F i
Ρ ï
Ε i
D Τ
DK \
ι -ri
45
" ~ 1 4 0
m
3s
372
35M"
U f i 32.529
1988
0 _ 10 20 30
' s'SS 'or Luxembourg reler to 1987. " :a .. cove.rs NACE divisions 1 to 8.
40 50
56
60
Table 2
SMEs and large enterprises by country (NACE divisions 1 to 9), 1988
1988 Belgium Denmark Germany Spain France
Italy 1
Luxembourg (1987)
The Netherlands
Portugal
The United Kingdom
I
Enterprises Employment
1099 100499 500 +
%of 10 +
90.5 93.8 92.5 92.9 91.4 94.9 90.0 94.4 91.9 89.9 7.8 5.2 6.3 6.2 7.1 4.4 8.6 1.7 1.0 1.2 0.9 1.5 0.7 1.4
[ 5 . 6 ]
7.0 8.4 1.1 1.7 Total 26974 28534 269284 112713 136030 135265 1747 28206 31661 179034
1019 100499 500 +
% o f 10 +
33.7 47.8 34.7 47.8 34.3 45.4 37.0 51.4 42.9 20.0 23.2 21.9 21.8 26.2 19.9 18.9 29.3 19.4 26.2 26.8 43.1 30.3 43.5 26.0 45.8 35.7 33.7 29.2 30.9 53.2 Total 1840794 1312323 15490383 5235399 9694415 6135489 109029 194835 1665771 13516077
Enterprises in Europe Structure of European enterprises
1.4. Large enterprises
(500 or more employees) Figure 5
1.4.1 . Within the European Community
The number of large enterprises stood at 11 350 at the EUR 12 level in 1988 (excluding NACE division 9) and they employed about 24 million persons. Large enterprises were the main employers in the energy sector (83% of sectoral employment), NACE division 2, mainly intermediate goods (51 %), NACE division 3, mainly investment goods (49%), the transports sector (59%) and finally the financial and real-estate busi-nesses (35%).
1 .4.2 . Importance of large enterprises in different European countries
The highest densities of medium and large enter-prises (100 or more employees) were found for north-ern Europe. Luxembourg, Denmark, Germany, Austria and the United Kingdom had more than 30 of these enterprises per 100 000 inhabitants (respective-ly 45, 35, 33 and 32 for both Austria and the United Kingdom).
The density of large enterprises separately, was over five enterprises per 100 000 inhabitants in the same five countries as well as in Belgium. In Sweden the ratio was 4.8 and in France 3.6. The lowest values were observed for Spain and Italy (2.8 and 1.5 large enterprises per 100 000 inhabitants respectively). Large enterprises employed more than a quarter of the active population in the United Kingdom and 23% in Germany. Less numerous than in Germany (3 100 as opposed to 3 300) but employing some 445 000 persons more (7.1 million), large enterprises in the United Kingdom were on average larger than their German counterparts (2 299 and 2 007 persons per enterprise respectively). In France large enterprises accounted for 4.1 million persons employed and in Italy 2.1 million (three-times less than in the United Kingdom). In the Netherlands, large enterprises generated one-third of GDP, 27% in Germany and only 13% in Italy.
1.4 .3 . Size of large enterprises in different EC countries
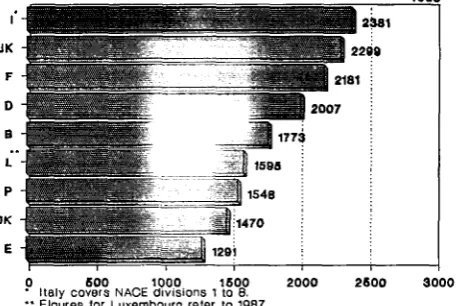
The largest enterprises were found in the United King-dom and Italy (2 381 persons employed per enter-prise in Italy) (Figure 5). The Italian enterenter-prise population was as such characterized by the consid-erable number of micro-enterprises and small SMEs and, at the other end of the scale by very large enterprises.
The average size of large French and German enter-prises was more than 2 000 persons employed (2181 and 2 007 respectively). The largest enterprises (on average) were therefore situated in the four largest economies of the EC. In Denmark and Spain their average size was below 1 500 persons employed (1 470 and 1 291 respectively).
Averaoe number of persons employed in large enterprises (500 or more), by country and all sectors
1988
B - f l
V:.:-1:":.- l:r-r.—
BHHHHHHHH
L i^HflHlBiiii .. 1586
1548
OK - irø 1470
¡ ¡ ¡ I 1291 0 600 1000 1600
" Italy covers NACE divisions 1 to 8.
· · Figures lor Luxembourg reter to 1987,
2000 2600 3000
Sectoral structure
Note relating to methodology
The data covers all the sectors in most of the coun-tries, except for Greece and Ireland. In Italy, there were no statistics for miscellaneous services enter-prises (NACE division 9), which are relatively numer-ous in the other countries (317 000 in Germany, 342 000 in Spain, 362 000 in France and 549 000 in the United Kingdom). The proportion of Italian ser-vices enterprises has thus been underestimated. Employment is used as a criterion for assessing the relative importance of the various sectors. The results given by this variable are in fact the most moderate, situated between those given by the number of firms which minimize the importance of manufacturing in-dustry and accentuate the importance of services (where firms tend to be smaller) and those given by turnover or value added, which accentuate the
im-portance of manufacturing industry and distributive trades to the detriment of other services sectors. The absence of persons employed by enterprises with no salaried employees, i.e. self-employed people and possibly also, family workers, introduces a bias in most countries (except for the United Kingdom and France). Enterprises with no salaried personnel are in fact represented differently according to the sector. They tend to be more numerous In the construction industry, distributive trades and services sector than in manufacturing industry. The importance of these first three sectors in terms of the number of people employed is thus partly underestimated in favour of industry.
[image:39.595.312.541.164.317.2]Structure of European enterprises Enterprises in Europe
Figure 6a Figure 6b Figure 6c
Distribution of enterprises by main s e c t o r ·
Construction 10.8
48.2 X / ^ í L ^ " v § ¿ j j ¿ < ^ Distribution · \ / ^ * - τ ^ Τ Γ /
% Enterprises
EUR 12 1988
Manufacturing 16
23 Rest of services"
EUR 12 1988 Distribution of employment
by main sectors
Manufacturing 37.8 Construction
10
29 Distribution·
* Persona employed
NACE 6: distributive tredøs, Horeca and repairs. ' Rest ol services covers NAGE divisions 8 to 8.
NACE 8: distributive trades, Horeca end repairs. ' Rest ol services covers NACE divisions 8 to 8.
Distribution of turnover by main sectors
Construction
P\ v ^
43-4 xjp*^-·": ; ~\^
% Turnover
EUR 12 1988
Manufacturing ». 40.Γ
10 Rest of services"
NACE â: distributivo tredos, Horeca and repairs. ' Rest of services covers NACE divisions β to 8.
2 . 1 . Overall results
2 . 1 . 1 . Within the European Community
Industrial enterprises represented 15% of all enter prises but accounted for 38% of employment and 41% of total turnover (Figures 6a, 6b and 6c).
The differences In the evaluation of the importance of industry, depending on the indicator used, were also found at the country level (see Chapter 2).
Industrial enterprises were on average clearly larger than those in the construction or services sectors. Services (NACE divisions 6 to 8) accounted for 69% of all enterprises and 52% of total employment.
2.1 .2 . Within different European countries
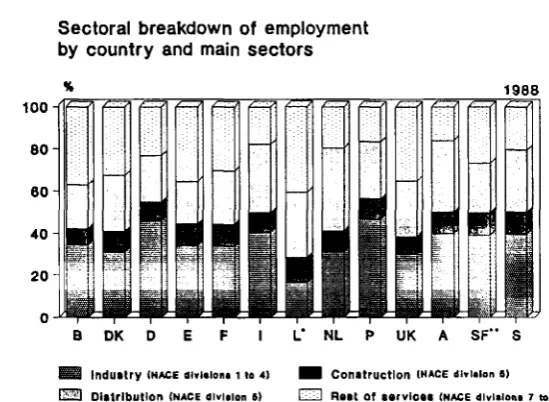
The weights, in terms of the number of persons em ployed, of the industrial and construction sectors were quite similar in all countries considered, except Luxembourg (Figure 7). In Industry, the ratio between the highest and lowest figures was 1.6 (47% in Portu gal and 46% in Germany as opposed to 30% in the United Kingdom). The same spread was found in the construction sector (11.7% in Luxembourg and 7.4% in Belgium).
The variations were larger for the services sector. The proportion of total employment accounted for by distributive trades and Horeca was 40% in the Nether lands but only 20% in Spain. The same was true for 'other services' which represented 37% of all employ ment in Belgium but only 15% in Austria.
Sectoral breakdown of employment by country and main sectors
[image:40.595.149.424.571.772.2]19Θ8 100
Figure 7
H 3 Industry (NACE aivuion· ι to 4) EZ3 Distribution (NACE division s)
M B Construction (NACE division s) EÏÏZ3 Rest Of services (NACE divisions 7 to 9) * Figures for Luxembourg refer to 1987.
Enterprises in Europe Structure of European enterprises
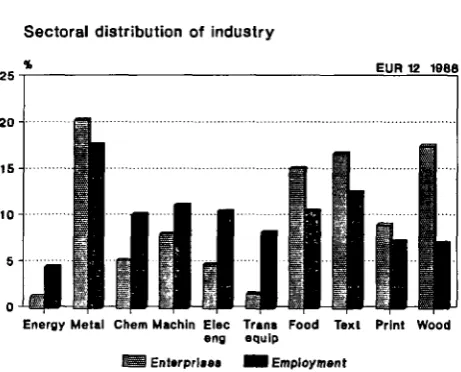
2 . 2. Industry
2 .2 .1 . Within the European Community
There were an estimated 1 743 000 industrial enter prises in 1988 in the EC. They employed about 30.5 million persons.
The most important industrial sector In the EC, in terms of employment, was metalprocessing. It en compassed 20.5% of all industrial enterprises and 18% of industrial employment (Figure 8). This was followed by the textile, leather and clothing industries encompassing 17% of industrial enterprises and 13% of employment, mechanical engineering, electrical engineering and the food industry with each encom passing 11 % of industrial employment and 8, 5 and 15% of industrial enterprises respectively. The 1.3% of enterprises engaged in the manufacture of trans port equipment employed more persons (8% of in dustry) than the 18% of enterprises in the wood and miscellaneous industries or the 9% involved in the printing and paper industries.
2.2 .2 . Within different European countries
Germany and Portugal were the most Industry orien tated ¡n relative terms. Here industry employed 44 and 46% respectively of the total workforce, outstripping Italian (40%), Austrian and Swedish industry (39%). By contrast, industry in the United Kingdom em ployed just 30% of the total national workforces and 17% only in Luxembourg.
Every economy tends to privilege certain industrial sectors to the detriment of others. This phenomenon is particularly noticeable for those smaller countries being the furthest away from the average EC struc ture. The origin of this phenomena is partly statistical
Figure 8
Sectoral distribution of industry
EUR 12 1988
Energy Metal Chem Machin Elee Trans Food Text Print Wood eng equip
i Enterprises I Employment
(as their structure has less influence at the EUR 12 level) and partly economical : their degree of sectoral specialization is higher (Table 3).
In Luxembourg for instance, more than half of the industrial workforce was engaged In metal process ing, which was threetimes more than at the EC level (18%). By contrast, the textile, wood and miscella neous Industries and the manufacture of transport equipment sectors together accounted for only 4% of employment (28% at the EUR 12 level). Other exam ples of a high degree of specialization were the textile, clothing and footwear sectors in Portugal (their weight being 2.5 times higher in terms of employment than the corresponding EUR 12 average) and the printing and food industries in Denmark and the Netherlands (double the EUR 12 proportion).
[image:41.595.313.544.95.281.2]Also interesting to note was the importance of the food, textile, wood and miscellaneous industries in Spain, Portugal and Italy which were characterized by the high number of micro and small enterprises.
Table 3
Sectoral weights in
%1 Energy Metal Chemicals Machinery Electrical eng. Transport Food Textile, leather Printing, paper Wood and misc.
Industry in terms of
EUR 12
4.5 17.7 10.3 11.2 10.6 8.3 10.6 12.7 7.1 7.0 Β
'™ :+';:\i;
+ + +
employment, EUR 12 and by country
DK "::■:■ .-+'·' + + + D + :+:' + + + E + + + + + F + + + ■:■':. + + + I + + + + L + +
11 1+fll
NL ! ! ; i l l !
.: ..+ ' + + + Ρ ■::+.::";
+ + + + UK ;::;:;::.+ +'..'
+ f f l + 11
1 Sectoral employment as a percentage of total employment in industry.
+: > EUR 12 average. : < EUR 12 average.
+ + : > two times EUR 12 average. : < half EUR 12 average.
Structure of European enterprises Enterprises in Europe
2 . 3 . Construction
This sector comprised an estimated 1 832 000 enter-prises and 8.1 million persons employed.
Luxembourg, France and Sweden came first with respect to the share accounted for by this sector in terms of total employment, all sectors combined (11.7,10.5 and 10.4% respectively). In Denmark and Austria, these percentages also exceeded 10. Con-versely, in Germany and the United Kingdom, the construction sector represented only 8.5 and 8% respectively of total employment.
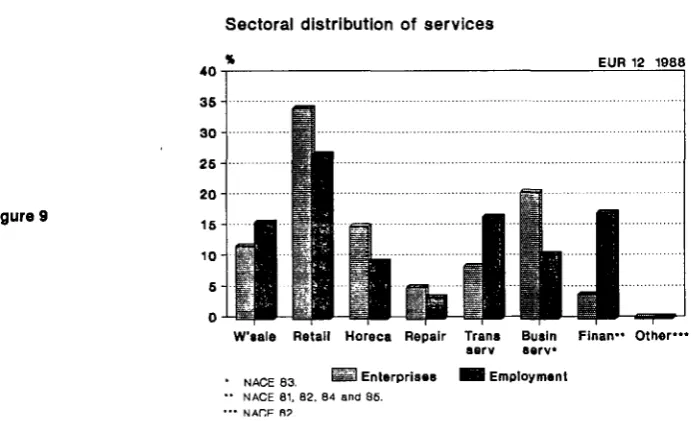
2 .4. Services
Note relating to methodology
The services sector has been broken down into eight sectors (see paragraph 2.2., p. xvili). Personal ser-vices (NACE division 9) were excluded from the EUR 12 estimations and auxiliary financial services have been integrated into the business services sector (NACE 83) as the sectoral breakdown was limited to the NACE two-digit level. At the national level, per-sonal services are included for certain countries.
2 .4.1 . Within the European Community
About 8 million enterprises were engaged in the ser-vices sector in the EC (without NACE division 9), or 61% of all enterprises. They employed 42 million persons.
Retail trade accounted for 34% of all services enter-prises in the EC and 27% of their employment. This sector was followed by three others of more or less the same importance in terms of number of persons employed : business services and auxiliary financial services (17%), transport and supporting activities (16.5%) and wholesale trade (16%). The financial and real-estate sectors came last with 10% of services employment in the EC (Figure 9).
2 .4.2 . Within different European countries
Distributive trades and Horeca together encom-passed one-third of total employment, all sectors combined in Austria (34%), 32.5% in Italy, Luxem-bourg (31%) and more than one-quarter in Sweden (29%), Portugal (27%), the United Kingdom (26.5%), Luxembourg (26%) and France (25%). In Germany, and even more so in Spain, its share was more limited (22 and 20% respectively).
Diversity between countries was more marked for the other services sectors (NACE divisions 7 to 9). Nontrade services (personal services, business ser-vices, financial institutions) were important in Luxem-bourg (40% of total employment, all sectors combined) and in the United Kingdom and Spain (35% of total employment, all sectors combined). The weight of these sectors combined, in both countries, was more than double that which was observed for Portugal and Austria (16% of employment, all sectors combined).
Sectoral distribution of services
[image:42.595.72.422.542.760.2]EUR 12 1988
Figure 9
W'sale Retali Horeca Repair Trans Busin Finan" Other*** serv serv*
NACE 83.
NACE 81. 82. 84 and 86 NACF fi?
Enterprises I Employment