This is a repository copy of Bond of Reinforcing Bars to Steel Fiber Reinforced Concrete.
White Rose Research Online URL for this paper: http://eprints.whiterose.ac.uk/92883/
Version: Accepted Version
Article:
Garcia-Taengua, E, Marti-Vargas, JR and Serna, P (2016) Bond of Reinforcing Bars to Steel Fiber Reinforced Concrete. Construction and Building Materials, 105. 275 - 284. ISSN 0950-0618
https://doi.org/10.1016/j.conbuildmat.2015.12.044
© 2015, Elsevier. Licensed under the Creative Commons Attribution-NonCommercial-NoDerivatives 4.0 International http://creativecommons.org/licenses/by-nc-nd/4.0/
eprints@whiterose.ac.uk Reuse
Unless indicated otherwise, fulltext items are protected by copyright with all rights reserved. The copyright exception in section 29 of the Copyright, Designs and Patents Act 1988 allows the making of a single copy solely for the purpose of non-commercial research or private study within the limits of fair dealing. The publisher or other rights-holder may allow further reproduction and re-use of this version - refer to the White Rose Research Online record for this item. Where records identify the publisher as the copyright holder, users can verify any specific terms of use on the publisher’s website.
Takedown
If you consider content in White Rose Research Online to be in breach of UK law, please notify us by
Bond of Reinforcing Bars to Steel Fiber Reinforced Concrete
1
2
E. Garcia-Taengua1*, J.R. Martí-Vargas2, P. Serna2
3
1 Institute for Resilient Infrastructure, School of Civil Engineering, University of Leeds,
4
England, United Kingdom. 5
2 ICITECH-Institute of Concrete Science and Technology, Universitat Politècnica de
6
València, Valencia, Spain 7
e-mail addresses: e.garcia-taengua@leeds.ac.uk, jrmarti@cst.upv.es,
8
pserna@cst.upv.es 9
*Corresponding author: e.garcia-taengua@leeds.ac.uk
10
11
ABSTRACT
12
Steel fiber reinforced concrete (SFRC) has been increasingly used during recent years. 13
Regarding bond of rebars to concrete, fibers provide passive confinement and improve 14
bond capacity in terms of bond strength and, more importantly, toughness. An extensive 15
experimental programme has been carried out, and SFRC specimens with embedded 16
rebars have been subjected to the Pull Out Test to obtain the bond stress–slip curves, 17
retaining the bond strength and the area under the curve as measures of the bond 18
capacity of concrete. The following parameters were considered: concrete compressive 19
strength (30-50 MPa), rebar diameter (8-20 mm), concrete cover (between 30 mm and 5 20
times rebar diameter), fiber content (up to 70 kg/m3), and the slenderness and length of 21
the steel fibers used. Predictive equations have been obtained to relate the experimental 22
results to the factors considered, and the trends observed have been analyzed and 23
discussed. 24
25
26
KEYWORDS:
27
Bond; Concrete; Fiber; Strength; Toughness. 28
29
30
1. INTRODUCTION
1
2
Bond of reinforcement to concrete has been studied for different types of concrete and 3
different experimental setups and structural situations. On the other hand, steel fiber 4
reinforced concrete (SFRC) has been increasingly used. This introduction aims at 5
contextualizing this study and justifying its objectives, which are detailed after that. 6
7
1.1 Bond between Reinforcement and Concrete
8
9
Bond between reinforcement and concrete is measured as a shear stress, or bond stress, 10
at the interface between the two materials, distributed over the surface of the rebar along 11
the embedded length. Following this definition, bond stress is the ratio between the rate 12
of change in axial force along the rebar and the area of rebar surface over which this 13
change takes place [1]. In addition to this shear stress there are other aspects involved, 14
especially in the case of deformed, ribbed rebars [1-3]. This is illustrated in Figure 1: 15
the tensile load pulling the rebar out of concrete causes reaction forces applied onto the 16
surrounding concrete. As a result of the ribbed geometry, these reactions are oblique 17
and therefore consist of two components: a) a shear component, parallel to the rebar 18
axis, and b) a radial component which affects the surrounding concrete. Therefore, bond 19
implies not only bond stresses but radial stresses as well. 20
21
Concrete between ribs is subjected to a multiaxial stress state caused by the shear 22
component of bond stresses. This wedging action increases with the axial load pulling 23
the rebar out, which eventually results in concrete crushing between ribs. Radial stresses 24
increase as well, until concrete tensile strength is reached in the concrete surrounding 25
the rebar. As a result, transverse microcracking occurs, with the consequent loss of 26
strain compatibility between rebar and concrete: the rebar progressively slips out of 27
concrete with the development of these microcracks. The initiation and progress of the 28
slippage results in the activation of bond. As long as confinement is sufficient and the 29
cracks do not imply the total failure of concrete surrounding the rebar, bond stresses 30
keep increasing until the ultimate value, known as bond strength, is reached. After this 31
peak, bond stress–slip curves exhibit a softening behavior. 32
Depending on the confinement conditions, bond failure can occur in two different major 1
modes: pullout failure (when the rebar is pulled out after the shear failure of the rebar-2
concrete interface), or splitting failure (when the concrete surrounding the rebar 3
undergoes total splitting as a result of the radial stresses). The confining effect of 4
concrete cover is most usually typified by rebar diameter: concrete cover/diameter ratio 5
is the reference parameter. According to the Model Code [4], concrete is considered 6
well confined when this ratio is not less than five, and it must be higher than 2.5 to 7
prevent splitting failures [5,6], although this threshold varies depending on different 8
factors. A detailed analysis of these factors determining the mode of bond failure and 9
the effect that fibers have on the risk of concrete splitting has already been published [7]. 10
11
Confinement affects bond performance in terms of bond strength and bond failure 12
ductility [4] in addition to the mode of bond failure [8,9]. In terms of ductility, 13
increasing the concrete cover has been shown to improve the ductility of bond failure, 14
as bond stress–slip curves become steeper when concrete cover increases [10]. 15
16
1.2 Effect of Steel Fibers on Bond between Reinforcement and Concrete
17
18
Steel fibers have been increasingly introduced in concrete production in recent years 19
[11,12]. They improve bond between reinforcement and concrete even when they are 20
dosed at low contents [13] as a result of their confining effect and their broadening the 21
range of crack width values within which passive confinement remains active [13-15]. 22
23
The positive effect of fibers on bond capacity is acknowledged in codes and 24
recommendations for structural concrete but is not always considered in expressions to 25
determine development lengths. Their effect on bond performance is especially 26
noticeable in terms of toughness of bond failure and the ductility of the material [10,16]. 27
However, accounting for the enhanced bond capacity of SFRC in order to reduce 28
required anchorage length values is not a straightforward issue. In this sense, several 29
studies have been performed attempting to model the bond phenomenon and anchorage 30
behavior in general [17-24]. 31
32
2. OBJECTIVES
1
2
As it has been highlighted in the introduction, a number of variables are involved in 3
terms of bond of reinforcing bars to SFRC, and there was a need to study all of them 4
together in order to quantify their importance, detect potential synergies between them 5
and non-linear trends. This research aimed at studying bond capacity of SFRC from a 6
multivariate perspective. The main objectives were: 7
To study different parameters characterizing the toughness of bond failure under 8
the conditions of the Pull Out Test (POT), and their relation with bond strength. 9
To study the effect that steel fiber content, fiber length and slenderness, concrete 10
compressive strength, rebar diameter and concrete cover have on bond capacity 11
of SFRC and on the toughness of bond failure. 12
To obtain analytical expressions that can be used to estimate bond strength and 13
bond toughness in relation to the factors considered. 14
15
16
3. EXPERIMENTAL INVESTIGATION
17
18
3.1 Definition of variables and experimental programme
19
20
The following factors were considered: concrete compressive strength (fc), rebar
21
diameter (D), concrete cover (C), steel fiber content (Cf), fiber slenderness (f) and fiber
22
length (lf). The values considered for each of these factors are summarized in Table 1.
23
24
Three different groups of concrete mixes were considered, providing compressive 25
strength values between 30 and 50 MPa. They are referred to throughout this paper as 26
Type I, II, and III, and they are based on the reference mix designs given in Table 2. 27
The mixes within each group vary in fiber content. The dosages of superplasticizer and 28
limestone filler were slightly adjusted in all cases to maintain a similar workability 29
throughout all mixes (slump values between 10 and 15 cm). 30
31
A highly fractioned factorial plan [25] was followed to define the experimental program. 32
resulting in the combinations shown in Table 3. With this design of the experiment, it 1
was possible to draw reliable, statistically sound conclusions from the experimental 2
results after a reasonable number of tests. For each case, 3 POT specimens and 2 3
cylindrical specimens were produced with concrete from the same batch. The number of 4
POT specimens produced and tested was 9 x 3 = 27 for each of the three series, and 5
therefore the total number of POT specimens was 27 x 3 = 81. 6
7
Rebars of four different diameters were used: 8, 12, 16, and 20 mm. The different 8
values considered for concrete cover, C1 < C2 < C3, were defined as a function of the 9
rebar diameter. The minimum concrete cover, C1, was either 30 mm (type I mixes) or 10
2.5 times the rebar diameter (types II and III mixes). The maximum concrete cover 11
considered, C3, was set at 5 times the rebar diameter, in agreement with the definition 12
of good confinement by the Model Code [4]. An intermediate level, C2 being the 13
average of C1 and C3, was also considered. 14
15
Four types of hooked-end steel fibers were considered, different in slenderness and 16
length only: 45/50, 65/60, 80/35, and 80/50. They were dosed below 1% in volume, 17
considering the following fiber contents: 0 kg/m3, 40 kg/m3, and 60-70 kg/m3.
18
19
3.2 Pull Out Test
20
21
A modified version of the Pull Out Test (POT) was selected as the most appropriate test 22
for the purposes of this research (Figure 2). All POT specimens were designed to the 23
RILEM recommendations [32–34] prescribing the following requirements: a) the total 24
length of the specimen (L) had to be 10 times the rebar diameter but never less than 200 25
mm, and b) the embedded length (L') had to be 5 times the rebar diameter. Preliminary 26
calculations following Eurocode 2 part 1-1 (art. 8.4.2) [26] were made in order to avoid 27
rebar yielding so that specimens failure could be related only to bond failure in all cases. 28
29
The dimensions of the cross-section were different for each POT specimen. This is 30
sketched in Figure 3, where D is the rebar diameter, S is the side, and C is the concrete 31
cover, variable. As shown in Figure 3, the rebar was positioned eccentrically so that the 32
With respect to the other two semi-axes, concrete cover was never less than 125 mm in 1
order to have good confinement. 2
3
3.3 Materials and methods
4
5
Cement type CEM II/B-M 42.5 R was used in all cases. River sand and crushed 6
limestone coarse aggregate were used, in addition to limestone filler and a 7
polycarboxylate ether-based superplasticizer. The reinforcing bars were ribbed bars 8
made with steel type B 500 S. With respect to the steel fibers used, all of them were 9
cold-drawn, hooked-end fibers made with low carbon steel (yield strength 1100 MPa 10
minimum) and without any coating. 11
12
To produce the concrete mixes and cast the specimens, the same sequence of operations 13
and mixing regime was followed in all cases. Each one of the concrete batches was 14
characterized by testing 2 cylindrical specimens under uniaxial compression. These 15
control specimens were cast at the same time as their corresponding POT specimens, 16
kept in storage conditions to the standard EN 12390-2:2009 [27] and tested at the same 17
age as their corresponding POT specimens, 28 days, following the standard EN 12390-18
3:2009 [28]. 19
20
Pull out tests were carried out as shown in Figure 4. The specimen was placed on a rigid 21
steel plate with the rebar passing through a hole and anchored by clamps. The 22
supporting plate was pulled up by actuating an hydraulic system and, as a result, the 23
rebar was pulled out of the specimen. The specimen was instrumented with a LVDT 24
sensor on the top surface to monitor the slip of the rebar. It was located on this surface 25
in order to detect the load corresponding to the onset of bond stress along the entire 26
embedded length. 27
28
3.4 Bond capacity parameters
29
30
A bond stress–slip curve was obtained from each Pull Out Test, from which the 31
following parameters were defined as the experimental quantitative outputs to be 32
, bond strength, corresponding to the peak bond stress, measured in MPa. 1
, area under the bond stress–slip curve up to its peak, measured in mmMPa. 2
, area under the bond stress–slip curve up to the bond stress value that equals 3
80% of the bond strength in the postpeak region of the curve, measured in 4
mmMPa. 5
, area under the bond stress–slip curve up to the bond stress value that equals 6
50% of the bond strength in the postpeak region of the curve, measured in 7
mmMPa. 8
9
10
4. RESULTS
11
12
4.1 Concrete compressive strength
13
14
The average compressive strength values obtained for type I, type II, and type III mixes 15
were 32 MPa, 48 MPa, and 44 MPa respectively, at the age of 28 days. The standard 16
deviation observed in the results was 2.7 MPa, 5.1 MPa, and 4.8 MPa respectively. 17
These values were considered in the analysis of the results presented in following 18
sections. 19
20
4.2 Bond strength and toughness parameters
21
22
Tables 4, 5 and 6 present the experimental results: bond strength values, , and the 23
toughness parameters Apeak, A80, and A50. These parameters can only be obtained in a
24
consistent manner when the mode of bond failure is pullout, as they are not defined if 25
there is a splitting failure. Therefore the analysis and discussion of results presented in 26
the following section refers to pullout failures only. A detailed analysis of the splitting 27
failures has been already published by the authors [7]. 28
29
30
31
32
5. ANALYSIS AND DISCUSSION
1
2
5.1 Overview of the methodology
3
4
The effects of the variables considered (fc, D, C, Cf, f, lf) on the bond capacity
5
parameters analyzed were evaluated and modelled by means of multiple linear 6
regression [29]. In addition to the equations obtained, statistical significance tests were 7
used to assess the relative importance of each variable. The modelling process followed 8
an iterative construction based on backwards stepwise regression [30] taking as 9
reference this general expression: 10
11
D D (1)
12
Where z is the parameter analyzed ( , Apeak, A80, or A50), and , , , , ,
13
, , and are coefficients to be estimated by least squares fitting to the 14
experimental results. 15
16
The structure of this general equation was decided taking into account previous 17
knowledge on bond phenomena. It takes into account the contributions of concrete 18
quality (compressive strength), the rebar diameter, and confinement (cover/diameter 19
ratio and fibers). The effects of concrete compressive strength and rebar diameter were 20
modelled as the addition of two components (linear and quadratic) to be able to model 21
non-linear trends if they were found to be statistically significant. The two sources of 22
passive confinement considered in this research are the cover/diameter ratio (C/D) and 23
the fiber content. The contribution of fibers is assumed to be directly dependent on fiber 24
content ( ) and modified by a fiber geometry factor which
25
takes into account the interactions between and fiber slenderness ( ) and length ( ). 26
27
28
29
30
5.2 Bond strength
1
2
After fitting equation (1) to the experimental results obtained for bond strength ( , 3
in MPa) and removing the terms that were not statistically significant, the following 4
model was obtained (R-squared=0.78): 5
D (2)
6
Where is the fiber geometry factor, as follows: 7
(3)
8
The goodness-of-fit of the model given by equations (2) and (3) was relatively good, 9
with an R-squared of 0.78. This is illustrated in Figure 6, which shows the relationship 10
between experimental bond strength values and the predictions following these 11
equations, together with the exact equivalence line and the limits of the 95%-confidence 12
band. 13
14
Figure 7 presents the effects plots for bond strength with respect to the different 15
variables. Solid lines show the average trends and the 95%-confidence limits for these 16
estimates are represented by grey bands. The relative importance of the different 17
variables on bond strength was assessed through these plots. 18
19
Concrete compressive strength was identified as the most determining factor on bond 20
strength, which is consistent with previous literature on the subject [16,31-33]. In bond 21
failures without splitting, the critical process is the crushing of concrete wedges 22
between ribs due to multiaxial compression. This explains why concrete compressive 23
strength was the determining factor in terms of bond strength. On the other hand, the 24
slightly positive effect of fiber reinforcement and concrete cover on bond strength was 25
attributed to their effect at the material level (enhancement of the concrete strength 26
under compression) rather than at a structural level. 27
28
Higher rebar diameters yielded higher bond strength values. This cannot be interpreted 29
bigger ribs and therefore cause higher bond stresses in the rebar-concrete interface to 1
balance the axial load pulling the rebar out of the concrete. 2
3
The improvement of passive confinement, by either increasing the cover/diameter ratio 4
or fiber content, tended to increase the bond strength but only slightly. This was 5
attributed to the fact that, when the bond strength is reached, the microcracking is not 6
yet so advanced as to activate the sewing effect of fibers or the confinement given by 7
the concrete cover. 8
9
Variations in fiber slenderness and length were detected to modify the effect that 10
increasing the fiber content has on bond strength. This is represented by the fiber 11
geometry factor given by equation (3). Figure 8 represents the variation of this factor 12
with fiber slenderness and length, and Figure 9 shows the relationship between bond 13
strength and fiber content for different values of fiber length and slenderness. It was 14
observed that, for the same fiber content, shorter fibers were preferable in terms of their 15
impact on bond strength. This was attributed to the fact that the contribution of longer 16
fibers is not fully activated until the microcracking surrounding the rebar is more 17
developed than it is when bond strength is reached. With respect to the slenderness, its 18
effect is related to the section of the fibers. 19
20
5.3 Toughness until the peak, Apeak
21
22
For the toughness parameter Apeak, representing bond toughness in the prepeak region,
23
the following model was obtained (R-squared = 0.45): 24
25
D (4)
26
The values of areas under the bond stress–slip curve showed a considerable scatter. This 27
is observed in Figure 10, which shows that higher Apeak values are more scattered: the
28
solid line is the exact equivalence line, while the dashed lines represent the limits of the 29
95%-confidence band. Due to the highly scattered profile of Apeak values, predictions
30
calculate average estimates and therefore for the detection of trends with respect to the 1
different variables considered. 2
3
Concrete compressive strength, rebar diameter, cover/diameter ratio and fiber content 4
were detected to significantly affect Apeak values, and the effects plots showing the
5
average trends in these relationships are presented in Figure 11. 6
7
Increasing concrete compressive strength or considering higher rebar diameters lead to 8
higher toughness, and for the same reasons that have been discussed in relation to their 9
effects on bond strength. Equation (4) can be used to quantify an average value of these 10
relative increments: Apeak is increased by 73% if concrete compressive strength
11
increases from 32 MPa to 48 MPa, and it is increased by 117% if the rebar diameter is 12
20 mm instead of 8 mm. 13
14
The effects of fiber length and slenderness on Apeak values were not statistically
15
significant and that is the reason why they do not appear in equation (4). Therefore the 16
effect of fibers on Apeak depends only on the fiber content and is not affected by fiber
17
slenderness or length as long as they fall within the ranges considered in this research. 18
In average, Apeak is increased by 71% when 70 kg/m3 of fibers are used, with respect to
19
the situation with no fibers. 20
21
5.4 Post-peak toughness, A80 and A50
22
23
The following equations were obtained for the postpeak toughness parameters A80
(R-24
squared = 0.57) and A50 (R-squared = 0.59):
25
D (5)
26
D (6)
27
Both equations are discussed together as they have the same structure and yield very 28
similar information. Figure 12 shows the effects plots for A80, and the trends observed in
29
1
Consistently with the findings in relation to Apeak, geometrical differences between the
2
fibers considered in this research did not have a statistically significant effect on post-3
peak bond toughness, and the effect of fibers on either A80 or A50 was related to fiber
4
content only. It is quite interesting to note that the addition of 70 kg/m3 of fibers had the 5
same relative impact on both parameters (A80 is increased by 82% while A50 is increased
6
by 81%, in average, with respect to concrete without fibers), which was quite similar to 7
that observed for Apeak (relative increase of 71%).
8
9
In fact, the same applies to the other variables considered. If the rebar diameter is 10
increased from 8 mm to 20 mm, A80 is increased by 142% while A50 is increased by
11
148%, in average. For a concrete compressive strength value of 48 MPa, A80 is
12
increased by 123% and A50 is increased by 151% with respect to a compressive strength
13
value of 32 MPa. And when C/D ratio is set at 5.0 instead of 2.5, A80 is increased by
14
60% and A50 is increased by 52%.
15
16
From all the aforementioned similarities, it can be concluded that the trends observed 17
with respect to the different variables analyzed are very similar for A80 and A50. This
18
suggests that the definition of a bond toughness parameter extended to the post-peak 19
region as an area under the bond stress–slip curve allows some flexibility regarding its 20
explicit definition. 21
22
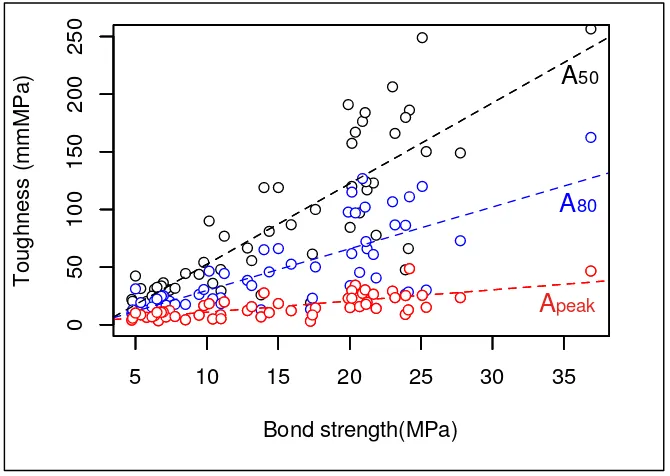
Important similarities are also found in relation to the scatter of these parameters, and 23
the same considerations made with respect to Apeak are applicable to both A80 and A50.
24
The scatter pattern observed in all these parameters is quite consistent: the higher their 25
average value is, the more scattered they are. Furthermore, as can be observed in Figure 26
13, it is also remarkable that there is a strong linear correlation between any of these 27
areas and bond strength (R-squared between 0.52 and 0.68). 28
29
30
6. CONCLUSIONS
31
32
concrete cover, fibers content, and fibers length and slenderness) on bond strength and 1
toughness. The semi-empirical expressions obtained for these parameters provide 2
estimates of the relative importance of the different factors considered. 3
4
The following conclusions are obtained, based on the results of these investigations: 5
Concrete compressive strength was identified as the most determining factor on 6
bond strength, which is consistent with previous literature on the subject. 7
Higher rebar diameters yielded higher bond strength values as larger rebar 8
diameters have bigger ribs which increase wedging action. 9
The effect of fiber content on bond strength is of limited importance. The 10
passive confinement exerted by either increasing the concrete cover or fiber 11
content, tended to increase the bond strength but only slightly, as the 12
microcracking was not yet so advanced at the peak bond stress. 13
Variations in fiber slenderness and length were detected to modify the effect that 14
increasing the fiber content has on bond strength. The most remarkable effect 15
observed was than, for a same fiber content, shorter fibers resulted more 16
effective than longer fibers to improve bond strength. 17
Concrete compressive strength, rebar diameter, cover/diameter ratio and fiber 18
content were detected to significantly affect toughness until the peak (Apeak).
19
The effects of the studied factors on the post-peak toughness were the same 20
regardeless the level the bond stress level (A80 or A50).
21
The effect of fibers on bond toughness parameters (Apeak, A80 and A50) is much
22
more noticeable than on bond strength. Their contribution to bond toughness 23
depends only on the fiber content and is not affected by fiber slenderness or 24
length as long as they fall within the ranges considered in this research. 25
Finally, with regard to the relationship between bond strength and toughness 26
parameters, it has been detected that there is a strong linear correlation between 27
bond strength and all the areas considered (Apeak, A80 and A50) as well as with the
28
scatter of their values. 29
30
ACKNOWLEDGEMENTS
The authors of this work wish to thank both the Research Bureau of the Spanish 1
Ministry of Science and Innovation for the funding of the projects ‘BIA 2009-12722’ 2
and ‘BIA 2012-35776-AR’, this research being a part thereof.
3
FIGURES
1
2
[image:16.595.76.492.86.280.2]3
Figure 1. Bond stresses and radial stresses generated at the rebar-concrete interface. 4
5
6
Figure 2. Longitudinal view of POT specimen according to RILEM recommendations. 7
8
[image:16.595.57.490.95.481.2]9
[image:16.595.158.434.324.511.2][image:17.595.137.455.71.292.2]
1
Figure 4. Force diagram (left) and picture of the Pull Out Test (right). 2
3
[image:17.595.106.488.325.477.2]4
Figure 5. Definition of toughness parameters. 5
6
7
Figure 6. Predicted vs experimental values of bond strength. 8
0 10 20 30
0
1
0
2
0
3
0
Experimental bond strength (MPa)
P
re
d
ic
te
d
b
o
n
d
s
tr
e
n
g
th
(
M
P
a
[image:17.595.154.441.510.738.2]1
[image:18.595.87.505.90.403.2]2
Figure 7. Bond strength: average trends with respect to the factors considered. 3
4
[image:18.595.125.465.458.728.2]5
Figure 8. Bond strength: relative value of the fiber geometry function ( ). 6
0.2 0.4 0.6 0.8 1.0
45 50 55 60 65 70 75 80
35 40 45 50 55 60
Fiber geometry factor (relative)
Fiber slenderness
F
ib
e
r
le
n
g
th
(
m
m
1
Figure 9. Effect of fiber length (a) and slenderness (b) on bond strength. 2
3
4
Figure 10. Predicted vs experimental values of toughness parameter A . 5
10 20 30 40 50
0
1
0
2
0
3
0
4
0
Experimental A_peak values (mmMPa)
P
re
d
ic
te
d
A
_
p
e
a
k
(
m
m
M
P
a
[image:19.595.140.455.509.742.2]1
[image:20.595.60.511.83.749.2]2
Figure 11. Toughness, Apeak: average trends with respect to the factors considered.
3
4
[image:20.595.87.509.89.401.2]1
Figure 13. Relationship between the toughness parameters and bond strength. 2
3
5 10 15 20 25 30 35
0
5
0
1
0
0
1
5
0
2
0
0
2
5
0
Bond strength(MPa)
T
o
u
g
h
n
e
s
s
(
m
m
M
P
a
)
Apeak
A80
TABLES
1
[image:22.595.62.476.78.558.2]2
Table 1. Factors and levels considered. 3
Factor Type I mixes Type II
mixes Type III mixes
Rebar diameter, mm 168
20
8 12 16
8 12 16
Concrete cover C2= (C1+C3)/2C1=30mm
C3=5.0 D
C1=2.5 D C2=3.5 D C3=5.0 D
C1=2.5 D C2=3.5 D C3=5.0 D Fiber geometry
(slenderness/length, mm/mm)
65/60
80/50 45/5080/50
80/35
45/50 80/50 80/35
Fiber content, kg/m3 400
70
0 40 60
0 40 60
4
Table 2. Reference mix designs (kg/m3). 5
Type I Type II Type III
Water/Cement 0.60 0.45 0.55
Cement 325 440 325
Sand 0/4 1006 957 1050
Coarse aggr. 7/12 544 723 835
Coarse aggr. 12/20 362 - -
Filler - 72 37
Superplasticizer 1.40 10 1.40
6
[image:22.595.94.475.123.384.2]1
Table 3. Combinations tested. 2
Mix id. geometryFibers
( f lf
Fiber content
(kg/m3)
Rebar diameter
(mm)
Concrete Cover
I-1 65/60 40 16 C1
I-2 - 0 8 C2
I-3 65/60 70 20 C3
I-4 65/60 40 8 C3
I-5 - 0 20 C1
I-6 65/60 70 16 C2
I-7 80/50 40 20 C2
I-8 - 0 16 C3
I-9 80/50 70 8 C1
II-1 - 0 8 C1
II-2 80/35 60 8 C2
II-3 45/50 40 8 C3
II-4 45/50 60 12 C1
II-5 80/50 40 12 C2
II-6 - 0 12 C3
II-7 80/35 40 16 C1
II-8 - 0 16 C2
II-9 80/50 60 16 C3
III-1 - 0 8 C1
III-2 80/50 40 12 C2
III-3 80/50 60 16 C3
III-4 - 0 12 C3
III-5 45/50 40 16 C1
III-6 45/50 60 8 C2
III-7 - 0 16 C2
III-8 80/35 40 8 C3
III-9 80/35 60 12 C1
3
1
Table 4. Experimental results, POT specimens made with Type I mixes. 2
Mix id. Bond strength
(MPa) Apeak Toughness (mmMPa)A80 A50
I-1
4.74 3.97 9.58 21.90
6.60 3.45 9.64 24.40
7.38 12.30 20.50 29.80
I-2
9.45 8.27 26.30 43.70
7.14 6.75 16.90 31.20
8.50 4.24 17.60 44.40
I-3
19.90 22.90 97.70 191.00
15.01 18.40 66.10 119.00
20.40 34.30 97.00 167.00
I-4
7.77 7.12 17.80 31.60
5.78 6.38 12.50 20.20
9.78 16.60 30.50 54.10
I-5
splitting splitting splitting
I-6
6.95 11.10 25.20 36.40
6.73 11.00 23.60 33.10
6.81 10.71 24.70 33.70
I-7
14.00 27.60 65.10 119.00
11.22 19.80 44.40 76.80
10.16 18.20 46.50 90.00
I-8
6.33 7.75 20.50 30.85
4.80 5.72 12.90 20.30
6.16 6.88 15.40 24.80
I-9
5.37 8.51 19.20 31.35
6.50 10.73 22.30 32.50
5.00 10.10 31.10 42.30
3
1
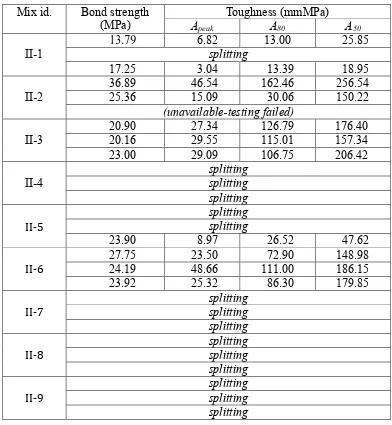
Table 5. Experimental results, POT specimens made with Type II mixes. 2
Mix id. Bond strength
(MPa) Apeak Toughness (mmMPa)A80 A50
II-1
13.79 6.82 13.00 25.85
splitting
17.25 3.04 13.39 18.95
II-2
36.89 46.54 162.46 256.54
25.36 15.09 30.06 150.22
(unavailable-testing failed)
II-3
20.90 27.34 126.79 176.40
20.16 29.55 115.01 157.34
23.00 29.09 106.75 206.42
II-4
splitting splitting splitting
II- splittingsplitting
23.90 8.97 26.52 47.62
II- 27.7524.19 23.5048.66 72.90111.00 148.98186.15
23.92 25.32 86.30 179.85
II- splittingsplitting splitting
II- splittingsplitting splitting
II- splittingsplitting splitting
3
1
Table 6. Experimental results, POT specimens made with Type III mixes. 2
Mix id. Bond strength
(MPa) Apeak Toughness (mmMPa)A80 A50
III-1
splitting splitting splitting
III-2
15.90 12.19 52.60 86.70
12.84 12.23 38.50 66.50
14.36 10.47 45.80 81.00
III-3
23.17 23.54 86.60 166.00
25.08 25.58 120.00 249.00
17.60 14.55 50.10 100.00
III-4
10.97 8.51 23.40 47.90
13.14 15.58 34.00 55.60
17.39 8.45 23.00 61.30
III-5
splitting splitting splitting
III-6
21.85 14.15 40.60 77.70
20.03 14.94 33.90 84.50
24.11 12.84 28.40 66.10
III-7
21.22 19.49 65.90 117.00
splitting
21.08 30.18 102.00 184.00
III-8
10.41 4.97 22.50 35.90
10.99 5.27 18.40 29.40
20.70 15.70 45.40 97.00
III-9
20.15 23.05 61.70 120.00
21.66 26.46 60.90 123.00
21.14 17.81 72.20 124.00
3
4
1
REFERENCES
2
[1] Cairns J, Plizzari GA. Towards a harmonised European bond test. Materials and 3
Structures 2003;36:498–506. doi:10.1007/BF02480826. 4
[2] Bamonte PF, Gambarova PG. High-Bond Bars in NSC and HPC: Study on Size 5
Effect and on the Local Bond Stress-Slip Law. Journal of Structural 6
Engineering 2007;133:225. doi:10.1061/(ASCE)0733-9445(2007)133:2(225). 7
[3] Gambarova PG. Bond in reinforced concrete: where do we stand today?, 8
Brescia, Italy: 2012, pp. 1–13. 9
[4] fib. fib Model Code for Concrete Structures 2010. Weinheim, Germany: Wiley-10
VCH Verlag GmbH & Co. KGaA; 2013. doi:10.1002/9783433604090. 11
[5] Cairns J, Jones K. The splitting forces generated by bond. Magazine of 12
Concrete Research 1995;47:153–65. doi:10.1680/macr.1995.47.171.153. 13
[6] ACI American Concrete Institute. Building Code Requirements for Structural 14
Concrete (ACI 318-14) and Commentary. Farmington Hills, Michigan: ACI 15
American Concrete Institute; 2014. 16
[7] García-Taengua E, Martí-Vargas JR, Serna P. Splitting of concrete cover in 17
steel fiber reinforced concrete: Semi-empirical modeling and minimum 18
confinement requirements. Construction and Building Materials 2014;66:743– 19
51. doi:10.1016/j.conbuildmat.2014.06.020. 20
[8] Yalciner H, Eren O, Sensoy S. An experimental study on the bond strength 21
between reinforcement bars and concrete as a function of concrete cover, 22
strength and corrosion level. Cement and Concrete Research 2012;42:643–55. 23
doi:10.1016/j.cemconres.2012.01.003. 24
[9] Arel HS, Yazici S. Concrete-reinforcement bond in different concrete classes. 25
Construction and Building Materials 2012;36:78–83. 26
doi:10.1016/j.conbuildmat.2012.04.074. 27
[10] García-Taengua E, Martí-Vargas JR, Serna-Ros P. Statistical Approach to 28
Effect of Factors Involved in Bond Performance of Steel Fiber-Reinforced 29
Concrete. ACI Structural Journal 2011;108:461–8. 30
[11] Serna P, Arango S, Ribeiro T, Núñez A, García-Taengua E. Structural cast-in-31
place SFRC: technology, control criteria and recent applications in spain. 32
Materials and Structures 2009;42:1233–46. doi:10.1617/s11527-009-9540-9. 33
[12] Shah AA, Ribakov Y. Recent trends in steel fibered high-strength concrete. 34
Materials & Design 2011;32:4122–51. doi:10.1016/j.matdes.2011.03.030. 35
[13] Cairns J, Plizzari GA. Bond behaviour of conventional reinforcement in fibre 36
reinforced concrete, Varenna, Italy: 2004. 37
[14] Holschemacher K, Weisse D. Bond of reinforcement in fibre reinforced 38
concrete, Varenna, Italy: 2004. 39
[15] García-Taengua E, Arango S, Martí-Vargas JR, Serna P. Flexural creep of steel 40
fiber reinforced concrete in the cracked state. Construction and Building 41
Materials 2014;65:321–9. doi:10.1016/j.conbuildmat.2014.04.139. 42
normal and high-strength concrete with and without fibers. Materials and 1
Structures 2010;43:839–56. doi:10.1617/s11527-009-9551-6. 2
[17] Darwin D, Zuo J. Development Length Criteria for Conventional and High 3
Relative Rib Area Reinforcing Bars. ACI Structural Journal 1996;93:347–59. 4
[18] Lundgren K, Gylltoft K. A Model for the Bond between Concrete and 5
Reinforcement. Magazine of Concrete Research 2000;52:53–63. 6
[19] Harajli MH, Mabsout ME. Evaluation of Bond Strength of Steel Reinforcing 7
Bars in Plain and Fiber-Reinforced Concrete. ACI Structural Journal 8
2002;99:509–17. 9
[20] Russo G, Pauletta M. A simple method for evaluating the maximum slip of 10
anchorages. Materials and Structures 2006;39:533–46. doi:10.1617/s11527-11
006-9092-1. 12
[21] Russo G, Pauletta M, Mitri D. Solution for bond distribution in asymmetric R.C. 13
structural members. Engineering Structures 2009;31:633–41. 14
doi:10.1016/j.engstruct.2008.11.003. 15
[22] Tastani SP, Pantazopoulou SJ. Direct Tension Pullout Bond Test: Experimental 16
Results. Journal of Structural Engineering 2010;136:731–43. 17
doi:10.1061/(ASCE)ST.1943-541X.0000159. 18
[23] Harajli MH. Bond Stress–Slip Model for Steel Bars in Unconfined or Steel, 19
FRC, or FRP Confined Concrete under Cyclic Loading. Journal of Structural 20
Engineering 2009;135:509–18. doi:10.1061/(ASCE)0733-21
9445(2009)135:5(509). 22
[24] Cattaneo S, Rosati G. Bond between Steel and Self-Consolidating Concrete: 23
Experiments and Modeling. ACI Structural Journal 2009;106:540–50. 24
[25] Montgomery D. Design and Analysis of Experiments. 6 ed. New York: John 25
Wiley & Sons Inc; 2005. 26
[26] European Committee for Standardization. EN 1992-1-1:2004 Eurocode 2 27
Design of concrete structures, Part 1-1: General rules and rules for buildings. 28
2004. 29
[27] European Committee for Standardization. EN 12390-2: 2009 Testing hardened 30
concrete - Part 2: Making and curing specimens for strength tests. 2009. 31
doi:10.3403/30164912. 32
[28] European Committee for Standardization. EN 12390-3:2009 Testing hardened 33
concrete - Part 3: Compressive strength of test specimens. 2009. 34
[29] Hair J, Black W, Babin B, Anderson R. Multivariate Data Analysis. 7 ed. 35
Upper Saddle River, NJ: Prentice Hall; 2009. 36
[30] Taengua EG. Bond of Reinforcing Bars to Steel Fiber Reinforced Concrete 37
(SFRC). 2013. 38
[31] Chapman RA, Shah SP. Early-age Bond Strength in Reinforced Concrete. ACI 39
Materials Journal 1987;84:501–10. 40
[32] Hughes BP, Videla C. Design criteria for early-age bond strength in reinforced 41
concrete. Materials and Structures 1992;25:445–63. doi:10.1007/BF02472635. 42
[33] Harajli MH. Comparison of Bond Strength of Steel Bars in Normal- and High-43
doi:10.1061/(ASCE)0899-1561(2004)16:4(365). 1