This is a repository copy of High-Dose Inactivated Influenza Vaccine is Associated with Cost Savings and Better Outcomes Compared to Standard-Dose Inactivated Influenza Vaccine in Canadian Seniors.
White Rose Research Online URL for this paper: http://eprints.whiterose.ac.uk/102626/
Version: Other
Article:
Becker, D., Chit, A., DiazGranados, C. et al. (3 more authors) (2016) High-Dose Inactivated Influenza Vaccine is Associated with Cost Savings and Better Outcomes Compared to Standard-Dose Inactivated Influenza Vaccine in Canadian Seniors. Human Vaccines & Immunotherapeutics. pp. 3036-3042.
https://doi.org/10.1080/21645515.2016.1215395
eprints@whiterose.ac.uk https://eprints.whiterose.ac.uk/
Reuse
Items deposited in White Rose Research Online are protected by copyright, with all rights reserved unless indicated otherwise. They may be downloaded and/or printed for private study, or other acts as permitted by national copyright laws. The publisher or other rights holders may allow further reproduction and re-use of the full text version. This is indicated by the licence information on the White Rose Research Online record for the item.
Takedown
If you consider content in White Rose Research Online to be in breach of UK law, please notify us by
1
High-Dose Inactivated Influenza Vaccine is Associated with Cost Savings and Better Outcomes
Compared to Standard-Dose Inactivated Influenza Vaccine in Canadian Seniors
Debbie L. Beckeri,*,Ayman Chitii,iii,*,Carlos A. DiazGranadosii,Michael Maschioi,Eddy Yauiv,Michael
Drummondv
i
Optum, 5500 North Service Road, Suite 501, Burlington, Ontario, Canada L7L 6W6
ii
Sanofi Pasteur, 1 Discovery Drive, Swiftwater, Pennsylvania, United States of America 18370
iii
Leslie Dan School of Pharmacy, University of Toronto, 144 College Street, Ontario, Canada M5S 3M2
iv
inVentiv Health Clinical, 5515 North Service Road, Suite 200, Burlington, Ontario, Canada L7L 6G4
v
Centre for Health Economics, University of York, Heslington, York, YO10 5DD, United Kingdom
*these authors contributed equally
Corresponding Author: Debbie L Becker
E-mail: Debbie.becker@optum.com
Word count
Abstract: 249/250
References: 27/125
Abstract
Seasonal influenza infects approximately 10-20% of Canadians each year, causing an estimated 12,200
hospitalizations and 3,500 deaths annually, mostly occurring in adults ≥65 years old (seniors). A 32,000
high-2
dose inactivated influenza vaccine (IIV-HD) is superior to standard-dose vaccine (SD) in preventing
laboratory-confirmed influenza illness in seniors. In this study, we performed a cost-utility analysis (CUA) of IIV-HD
versus SD in FIM12 participants from a Canadian perspective. Healthcare resource utilization data collected in
FIM12 included: medications, non-routine/urgent care and emergency room visits, and hospitalizations. Unit
costs were applied using standard Canadian cost sources to estimate the mean direct medical and societal costs
associated with each vaccine (2014 CAD). Clinical illness data from the trial were mapped to quality-of-life
data from the literature to estimate differences in effectiveness between vaccines. Time horizon was one
influenza season, however, quality-adjusted life-years (QALYs) lost due to death during the study were
captured over a lifetime. A probabilistic sensitivity analysis (PSA) was also performed. Average per-participant
medical costs were $47 lower and societal costs $60 lower in the IIV-HD arm. Hospitalizations contributed
91% of the total cost and were less frequent in the IIV-HD arm. IIV-HD provided a gain in QALYs and, due to
cost savings, dominated SD in the CUA. The PSA indicated that IIV-HD is 89% likely to be cost saving. In
Canada, IIV-HD is expected to be a less costly and more effective alternative to SD, driven by a reduction in
hospitalizations.
3
Introduction
Seasonal influenza infects approximately 10-20% of the Canadian population each year. While most people
recover within 7 to 10 days, severe illness can occur which causes an estimated 12,200 hospitalizations and
3,500 deaths annually.1 These deaths primarily occur in adults aged 65 and older (herein referred to as seniors)
who are more susceptible to downstream complications associated with influenza infection.2, 3 Because seniors
are at greater risk, the National Advisory Committee on Immunization (NACI) encourages all Canadian seniors
to receive a vaccination each autumn.1
In the Canadian provinces, publicly-funded immunization programs provide free vaccine to all eligible
members of the public. Trivalent inactivated influenza vaccine (IIV3) is the current vaccine funded for seniors
in most provinces. A new high dose IIV3 vaccine (Fluzone High-Dose; IIV-HD) was approved September 2015
by Health Canada based on evidence from a randomized controlled trial (RCT) demonstrating improvements in
efficacy over standard dose IIV3 vaccine (SD) in seniors.4 The FIM12 study (Clinicaltrials.gov NCT01427309)
showed IIV-HD to be superior to SD in preventing laboratory-confirmed influenza caused by any type or
sub-type associated with clinically relevant illness in approximately 32,000 seniors (relative efficacy, 24.2%, 95%
CI 9.7–36.5%).5 Importantly, the study captured the seasonal variation typical of influenza activity as it was
conducted over two sequential influenza seasons.6-9 The 2011/12 season featured low levels of influenza
circulation and a close match between the vaccine and circulating strains,6 while the 2012/13 season was more
severe with a poor match between vaccine and circulating strains.7-9
Although the acquisition cost of the IIV-HD is higher than that of SD, healthcare funding decision-makers need
to consider all relevant costs of alternative interventions in relation to the resulting health outcomes. Formal
techniques of economic evaluation, such as cost-effectiveness analysis (CEA), can be used to provide valuable
4
on healthcare utilization (HCU) and clinical outcomes collected from participants in the FIM12 trial, we have
previously demonstrated IIV-HD to be a less costly and more effective alternative to SD in a United States
(US)-focused cost-utility analysis (CUA) conducted from both a Medicare and societal perspective. Mean
per-participant medical costs (in 2014 USD) were lower in the IIV-HD group ($1376.72 USD) than in the SD group
($1492.64; difference –$115.92). Further, the IIV-HD vaccine provided a gain in quality-adjusted life-years
(QALYs; mean 8.1502 QALYs/participant) compared with the SD vaccine (8.1499 QALYs/participant) and,
due to cost savings driven primarily by fewer hospitalizations among subjects vaccinated with IIV-HD,
dominated SD in the CUA.10 The objective of the current analysis was to determine if vaccination with the
newly approved IIV-HD versus SD would lead to similar economic benefits in Canada when Canadian unit
costs and survival data were considered in place of those used in our US analysis.
Results
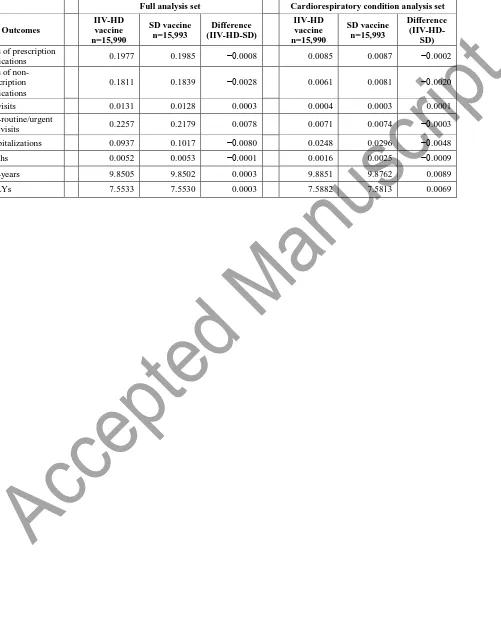
Based on our analysis of HCU, per-participant visits to the emergency room (ER) and non-routine/urgent care
visits were slightly higher in the IIV-HD group than in the SD group, and slightly lower for prescription and
non-prescription medication use (Table 1, full analysis set). The mean per-participant number of
hospitalizations was 0.0937 (1,498 hospitalizations in 15,990 participants) in the IIV-HD group and 0.1017
(1,629 hospitalizations in 15,993 participants) in the SD group, with averages of 0.4869 days and 0.5626 days
for hospital length of stay (LOS) per-participant, respectively.
Table 1. Outcomes per participant
Ninety-one percent of the total healthcare payer costs and 76% of the total societal costs were due to hospital
5
Further, utilizing IIV-HD instead of SD, representing an additional expenditure of $25.97/participant, yielded a
181% financial return ($47.15/participant) to the healthcare system mainly through reductions in hospital
admissions (Table 2).
Table 2. Costs by resource item (in 2014 Canadian dollars/participant)
The QALY analysis predicted that IIV-HD recipients would experience 7.5533 QALYs over the remainder of
their lifetime, whereas SD recipients would have 7.5530 QALYs, a difference of 0.0003 QALYs in favor of
IIV-HD (Table 2 and Table 4). For a cohort the size of the IIV-HD recipients in the clinical trial (N=15,990),
this equates to an additional 4.8 QALYs for the cohort. Since total costs were lower in the IIV-HD group and
the health outcomes were more favorable for IIV-HD, the cost-effectiveness analysis found that IIV-HD
dominated (i.e., IIV-HD provided more health at lower costs) SD vaccine from both the public payer and
societal perspectives. A threshold analysis determined that vaccination with IIV-HD continued to be cost-saving
to the public payer up to a IIV-HD price of approximately $79 per injection. IIV-HD remained dominant in the
two sub-group analyses in study participants with one or more comorbid conditions and in participants ≥75
years (societal perspective only). In the public payer perspective analysis involving the subgroup of participants
≥75 years, a small incremental cost-effectiveness ratio (ICER) of $82/QALY gained was obtained due to
slightly higher costs (<$1) and QALYs (0.0049) among participants in the IIV HD group compared to the SD
group (Table 3).
Table 3. Cost utility analysis
In the cardiorespiratory condition analysis IIV-HD recipients gained more QALYs over their lifetime than SD
recipients and their healthcare system and societal costs were also less (Tables 2-4). The total costs per
6
administer IIV-HD instead of SD ($25.97/participant) yielded an 80% financial return ($20.65/participant) to
the healthcare system (Table 3), and vaccination with IIV-SD remained cost-saving up to a cost per injection of
approximately $53. Further, IIV-HD remained dominant in the cost-effectiveness analysis including all
sub-group analysis (Table 4).
ICERs computed in the PSA revealed that 89% of the points in the full-analysis set and 83% of the points in the
cardiorespiratory analysis set clustered in the lower quadrants of the plot (Figure 1). Further, in the
cardiorespiratory set 80% of the samples clustered in the lower right quadrant. These results illustrate that
IIV-HD is less costly than SD with high certainty. The cardiorespiratory analysis also illustrates that reduction in
cardio-respiratory complications provide much of the health benefits offered by IIV-HD.
Figure 1. Scatterplots representing the statistical uncertainty through a 1,000 bootstrapped samples
Discussion
In this Canadian economic evaluation based on a RCT of approximately 32,000 seniors, we found that IIV-HD
was a cost-saving alternative to SD, the current standard of care for ambulatory seniors in most provinces, and
this conclusion was robust in the face of statistical uncertainty. From the societal perspective, savings were
estimated to be $60 per IIV-HD participant when considering the full analysis set and $29 per IIV-HD
participant when considering the cardiorespiratory condition analysis set. Savings to the healthcare payer were
slightly less, at approximately $47 and $21 per IIV-HD participant, respectively. Since the price of IIV-HD has
not been established in Canada yet, we used the US price assuming a 1:1 exchange rate (based on exchange
rates current at the time the study was conducted; $31.81 per injection); however, the actual Canadian launch
price will depend on a number of factors such as, for example, global supply and demand constraints and
7
the price could increase to just under $79 (full analysis set) and $53 (cardiorespiratory condition analysis set)
per injection and still be cost saving to healthcare payers. As noted, the majority of the savings generated by
IIV-HD were driven by reductions in cardiorespiratory hospitalizations plausibly related to influenza.
Our previous analysis based on the same RCT, but conducted from the Medicare and societal perspectives in the
US, found similar results, though the magnitude of the cost savings was higher in the US (e.g., $128 and $80
USD (2014) per IIV-HD participant based on the full and cardiorespiratory condition analysis sets,
respectively). This difference was driven by the fact that hospital per diems were, on average, approximately
51% (or ~$1,400/day without adjustment for exchange rate) lower in Canada than in the US.10 The only other
IIV-HD cost-effectiveness study identified in the literature was a mathematical modeling study (discussed in
depth in our previous publication 10) which predicted that the IIV-HD would be a cost-effective alternative to
SD (incremental cost-effectiveness ratio $5,399 USD/QALY gained).11
A key feature of this study is that it uses a randomized head-to-head design (FIM12), to define causality
between the vaccines and healthcare resource consumption. The FIM12 RCT was sufficiently large to observe
the cost-saving signal generated by IIV-HD from background noise (heterogeneous healthcare expenditures
amongst seniors). Further, the healthcare cost data we used are directly applicable to Canadian public payers as
they were obtained from Ontario sources, which is the largest province by population in Canada.
The study also had a number of limitations beyond those previously discussed.10 As noted, FIM12 was a
multinational study, however, only 5% of participants were enrolled in Canada while the remaining 95% of
participants were from the US. For our analysis, all HCU data were pooled across all patients even though it is
conceivable that HCU may potentially have been affected by differences in the structure of healthcare delivery
8
Statistical testing was conducted prior to data pooling, which did not detect heterogeneity among HCU between
countries. Therefore, it was justified to pool the trial data for all analyses.
Another limitation is that the collection of per diems for assignment to each hospitalization required some
simplifying techniques to manage the data collection burden. As has been explained, hospitalizations were
categorized into a manageable number of groups using the Medical Dictionary for Regulatory Activities
(MedDRA) coding system, which were first mapped to an International Classification of Diseases, Ninth
Edition, Clinical Revision (ICD-9-CM) code(s) and then, specifically for the Canadian analysis, to an ICD
Tenth Edition (ICD-10) code(s) for per diem cost collection and assignment from the Ontario Case Costing
Initiative (OCCI) database. Although this approach was used consistently across all hospitalizations regardless
of vaccine group, it is possible that some specificity was lost during the grouping and two-step mapping
process. To limit the potential for error and/or inaccurate assignment of codes, the same analyst with medical
training completed both steps of the mapping exercise, and all mappings were reviewed by a physician at Sanofi
Pasteur.
Finally, it is worth noting that our study was a comparison of vaccination with IIV-HD against SD, which is the
current standard of care for seniors in most Canadian provinces. However, other vaccines such as standard dose
quadrivalent inactivated influenza vaccine and adjuvanted trivalent inactivated influenza vaccine are used for
seniors in some provinces and long-term care facilities. Since our analysis was based on data collected in a
head-to-head trial comparing only IIV-HD versus SD, we did not consider the cost-effectiveness of IIV-HD
compared to other vaccines.
In conclusion, after accounting for the price difference between IIV-HD and SD, vaccination with IIV-HD
9
number of hospitalizations. As the clinical benefits are higher for IIV-HD and associated total costs are lower, it
dominated SD in the CUA.
Patients and Methods
Analytic approach
The methods developed for this analysis of the economic impact of IIV-HD versus SD in Canada as measured
in the FIM12 trial5 have been described in detail in a previous publication of a CUA conducted for the US.10
Here we provide a general overview of these analytic methods along with a detailed description of the
adaptations made to the analysis specifically for the Canadian setting.
Briefly, FIM12 was a head-to-head RCT of IIV-HD versus SD (randomized 1:1) that enrolled approximately
32,000 seniors over two influenza seasons (2011/2012 and 2012/2013). A surveillance program captured HCU
data for all study participants, including use of prescription and non-prescription medications (limited to
antipyretics/analgesics/non-steroidal anti-inflammatory drugs, antivirals, and antibiotics), emergency room ER
visits, non-routine/urgent care visits, and hospitalizations, if they occurred within 30 days after any study
respiratory illness (the frequency and types of respiratory illnesses have been described in the original trial
publication5). In addition, hospitalizations resulting from serious events (serious events were defined as events:
leading to death or hospitalization (or its prolongation); considered as life-threatening or medically important;
or resulting in disability) were captured for all participants and for the duration of the study, regardless of their
occurrence in relation to a study respiratory illness.5
Our primary analysis estimated Canadian public healthcare system expenditures based directly on the HCU data
10
covered by the public payer, including out-of-pocket costs for non-prescription medications and work force
productivity losses. Further, we estimated the incremental cost-utility of IIV-HD versus SD. To perform the
CUA, we modeled the expected impacts of the medical events captured in FIM12 on quality of life (QoL)
during the clinical trial period and throughout the life expectancy of the study cohort. Modeled health outcomes
that extended beyond the study duration were discounted at five percent annually; costs were not discounted
since they were based only on HCU reported during the trial period and did not extend beyond one year.12 All
costs were reported in 2014 Canadian dollars.
Costing analysis
Although FIM12 was a multinational study, only 5% of participants were enrolled in Canada while the
remaining 95% of participants were from the US. Prior to pooling HCU data across all participants, tests of
significance were performed to detect potential differences in utilization patterns between the US versus
Canada. Specifically, we assessed the impact of vaccine strategy on the total intensity of HCU across countries
using the total medical cost, in a single currency (2014 USD), for each subject as a proxy measure for overall
HCU intensity. A regression analysis, using a gamma regression model, was conducted with HCU intensity
(cost) as the dependent measure and the independent measures were vaccine group, country, and an interaction
term between vaccine group and country. It is the interaction term, or whether there is a similar effect of study
treatment on the incremental cost difference across countries, that determines whether it is appropriate to pool
all participants in a straightforward way.13 Because there was not a significant interaction between vaccine
group and country with outcome considered to be the total medical cost (p=0.96; i.e., heterogeneity among
HCU was not detected between countries), it was justified to pool the trial data for all analyses.
The pooled healthcare resources for all subjects in the trial were valued using unit prices relevant to Canada
11
healthcare component of the consumer price index (CPI).14 Total costs were calculated from the quantity of
resources consumed (for example, number of days hospitalized) and the unit cost per resource. The analysis
from the public payer perspective considered the following costs: vaccine, prescription medication, medical
visits, and hospitalizations. The analysis from the societal perspective additionally included the costs of
non-prescription medication and lost work force productivity.
Since IIV-HD was not marketed in Canada at the time of the study, it was assumed the list price would be the
same as in the US (since the USD and Canadian dollar were approximately at par when the study was
conducted (2013/2014)) obtained from the Centers for Medicare & Medicaid Services (CMS) Seasonal
Influenza Vaccines Pricing List.15 The cost of SD was provided by Sanofi Pasteur.16 The cost per unit for each
prescription medication was obtained from the Ontario Drug Benefit Formulary (used as a proxy for Canada).17
The cost per prescription included an 8% upcharge and $8.83 dispensing fee per length of treatment.18 The unit
cost for non-prescription medications (societal perspective only) was obtained from a large Canadian pharmacy
chain.19
The unit costs for respiratory illness-related ER and non-routine/urgent care visits were obtained from Canadian
Institute for Health Information (CIHI) reports.20, 21 The costs of hospitalizations were calculated by multiplying
the hospital LOS by the unit cost per day (per diem). To estimate the per diem cost, diagnosis codes related to
hospitalizations were grouped into preferred terms under the MedDRA coding system and mapped to the
ICD-9-CM codes (for the purpose of assigning costs in the original US analysis). The ICD-ICD-9-CM codes were then
mapped to ICD-10 codes for the purpose of extracting and assigning per diem costs from the OCCI’s on-line
database.22
Productivity costs were imputed using methods described by Molinari et al. in which the number of medical
12
productivity).23 The number of days of lost productivity was valued at the average daily wage for Canadian
employees in 2014.24 All unit costs used in the analysis are provided in Table 4.
Table 4. Unit Costs of Resource Items (2014 Canadian dollars)
Cost-effectiveness
An ICER was calculated for IIV-HD versus SD. The ICER was defined as (CostIIV-HD - CostSD)/(OutcomesIIV-HD
- OutcomesSD). The costs and outcomes were the total costs and outcomes from each arm of the FIM12 trial.
We also calculated ICERs for the following two subgroups: participants with one or more co-morbid condition
(N=21,502) and participants ≥75 years of age (N=10,839).
The outcome of the CUA was the QALY. To estimate the number of QALYs in each vaccine arm we first
estimated the total number of life-years (LYs) per arm. We used age- and gender-specific Canadian life
expectancy data from Statistics Canada to estimate the LYs for study participants.25 When weighted according
to the FIM12 gender distribution (43% male, 57% female), the mean life expectancy for subjects in FIM12,
prior to adjustments for discounting and deaths experienced during the trial was 9.9 years. After applying an
annual discount rate of 5%, mean life expectancy for subjects in FIM12 was 7.6 years. For each subject who
died during the study, their remaining length of life was calculated based only on the amount of time for which
they survived following vaccination (date of death - date of vaccination + 1).
Since QoL data were not collected in the FIM12 trial, we adjusted the LYs to estimate QALYs using QoL data
specific to the participant’s age, gender, and the medical events they experienced during the study. Additional
details regarding the methodology including the utility and disutility values applied in our analysis have been
13
Subgroup and uncertainty analysis
As FIM12 was not powered for the purpose of this economic evaluation, it was possible that the economic
benefit of IIV-HD would be difficult to detect due to the multiple non-influenza related events collected in the
FIM12 study. To overcome this and to increase the specificity of our analysis we planned a cardiorespiratory
condition analysis that accounted for a subset of clinical outcomes selected by study clinicians before
unblinding the study based on the plausibility of their relation to influenza. Outcomes groupings included
pneumonia events, asthma/chronic obstructive pulmonary disease/bronchial events, influenza events (serious
laboratory-confirmed influenza diagnosed outside study procedures by a participant’s healthcare provider),
other respiratory events, coronary artery events, congestive heart failure events, and cerebrovascular events. A
more granular listing of the conditions included in this subgroup and the methods used to identify these events
has previously been published by DiazGranados et al., 2015.26
To explore the impact of statistical uncertainty on the results we conducted a bootstrapping analysis of the trial
data with replacement as described in our previous work.10 Results are presented as a scatterplot on a
14
Conflicts of Interest
Funding for this study was provided by Sanofi Pasteur.
AC and CD conceived the study. AC, DB, CD, MM, EY and MD designed the study. DB and MM conducted
the analysis. AC, DB, CD, MM, EY and MD interpreted the results. DB wrote the initial draft of the
manuscript. AC, DB, CD, MM, EY and MD critically revised the manuscript and approved the final version.
AC had full access to all the data in the study and had final responsibility for the decision to submit the
publication.
AC and CD are employees of Sanofi Pasteur (SP). DB and MM are employees of Optum. MD was a Consultant
at Optum at the time this study was conducted. Optum was contracted by SP to conduct this study. EY was an
employee of inventive Health Clinical during the study. Inventive Health Clinical was contracted by SP to work
15
References
1. Government of Canada. For health professionals: Flu (influenza).
2. Schanzer DL, Tam TW, Langley JM, Winchester BT. Influenza-attributable deaths, Canada 1990-1999.
Epidemiology and infection 2007; 135:1109-16.
3. Centers for Disease C, Prevention. Estimates of deaths associated with seasonal influenza --- United
States, 1976-2007. MMWR Morbidity and mortality weekly report 2010; 59:1057-62.
4. Sanofi Pasteur. FLUZONE® High-Dose Product Monograph. September 2015.
5. DiazGranados CA, Dunning AJ, Kimmel M, Kirby D, Treanor J, Collins A, et al. Efficacy of high-dose
versus standard-dose influenza vaccine in older adults. The New England journal of medicine 2014;
371:635-45.
6. Centers for Disease C, Prevention. Update: influenza activity - United States, 2011-12 season and
composition of the 2012-13 influenza vaccine. MMWR Morbidity and mortality weekly report 2012;
61:414-20.
7. Centers for Disease C, Prevention. Estimated influenza illnesses and hospitalizations averted by
influenza vaccination - United States, 2012-13 influenza season. MMWR Morbidity and mortality weekly
report 2013; 62:997-1000.
8. Centers for Disease C, Prevention. Influenza activity--United States, 2012-13 season and composition of
the 2013-14 influenza vaccine. MMWR Morbidity and mortality weekly report 2013; 62:473-9.
9. Recommended composition of influenza virus vaccines for use in the 2013-2014 northern hemisphere
influenza season. Releve epidemiologique hebdomadaire / Section d'hygiene du Secretariat de la Societe des
Nations = Weekly epidemiological record / Health Section of the Secretariat of the League of Nations 2013;
88:101-14.
10. Chit A, Becker DL, DiazGranados CA, Maschio M, Yau E, Drummond M. Cost-effectiveness of
high-dose versus standard-high-dose inactivated influenza vaccine in adults aged 65 years and older: an economic
16
11. Chit A, Roiz J, Briquet B, Greenberg DP. Expected cost effectiveness of high-dose trivalent influenza
vaccine in US seniors. Vaccine 2015; 33:734-41.
12. Guidelines for the economic evaluation of health technologies: Canada [3rd Edition]. Ottawa: Canadian
Agency for Drugs and Technologies in Health. 2006.
13. Cook JR, Drummond M, Glick H, Heyse JF. Assessing the appropriateness of combining economic data
from multinational clinical trials. Statistics in medicine 2003; 22:1955-76.
14. Statistics Canada. Table 326-0020 - Consumer Price Index (CPI), 2011 basket, monthly. .
15. Centers for Medicare & Medicaid Services. Seasonal Influenza Vaccines Pricing.
16. Data from Sanofi Pasteur.
17. Ontario Drug Benefits Formulary. Effective January 3, 2014.
18. Ontario Drug Benefit Program: Dispensing fees.
19. Shoppers Drug Mart, Burlington Ontario, October 2014.
20. Seniors’ Use of Emergency Departments in Ontario, 2004–2005 to 2008–2009, Page 17.
21. Canadian Institute for Health Information. Physician Services Benefit Rates Report, Canada, 2012–
2013.
22. Ontario Case Costing Initiative CAT tool.
23. Molinari NA, Ortega-Sanchez IR, Messonnier ML, Thompson WW, Wortley PM, Weintraub E, et al.
The annual impact of seasonal influenza in the US: measuring disease burden and costs. Vaccine 2007;
25:5086-96.
24. Statistics Canada. Table 281-0063 - Employment and average weekly earnings including overtime
(SEPH), seasonally adjusted, for all employees by industries classified using the North American Industry
Classification System (NAICS), monthly (persons unless otherwise noted).
25. Statistics Canada, Demography Division. Statistics Canada. Life Tables, Canada, Provinces and
17
26. DiazGranados CA, Robertson CA, Talbot HK, Landolfi V, Dunning AJ, Greenberg DP. Prevention of
serious events in adults 65 years of age or older: A comparison between high-dose and standard-dose
inactivated influenza vaccines. Vaccine 2015; 33:4988-93.
27. Fenwick E, Claxton K, Sculpher M. Representing uncertainty: the role of cost-effectiveness
acceptability curves. Health economics 2001; 10:779-87.
18 Table 1. Outcomes per vaccinee
Full analysis set Cardiorespiratory condition analysis set
Outcomes
IIV-HD vaccine n=15,990
SD vaccine n=15,993
Difference (IIV-HD-SD)
IIV-HD vaccine n=15,990
SD vaccine n=15,993
Difference
(IIV-HD-SD) Uses of prescription
medications 0.1977 0.1985 −0.0008 0.0085 0.0087 −0.0002
Uses of non-prescription medications
0.1811 0.1839 −0.0028 0.0061 0.0081 −0.0020
ER visits 0.0131 0.0128 0.0003 0.0004 0.0003 0.0001
Non-routine/urgent
care visits 0.2257 0.2179 0.0078 0.0071 0.0074 −0.0003
Hospitalizations 0.0937 0.1017 −0.0080 0.0248 0.0296 −0.0048
Deaths 0.0052 0.0053 −0.0001 0.0016 0.0025 −0.0009
Life-years 9.8505 9.8502 0.0003 9.8851 9.8762 0.0089
19 Table 2 Costs by resource item (in Canadian dollars/participant)
Full analysis set Cardiorespiratory condition analysis set
Outcomes
IIV-HD vaccine n=15,990
SD vaccine n=15,993
Difference
(IIV-HD-SD)
IIV-HD vaccine n=15,990
SD vaccine n=15,993
Difference
(IIV-HD-SD)
Study vaccine $31.81 $5.84 $25.97 $31.81 $5.84 $25.97
Prescription
medications $3.45 $3.45 $0.00 $0.18 $0.19 -$0.01
ER visits $6.63 $6.47 $0.16 $0.19 $0.13 $0.06
Non-routine/
urgent care visits $19.21 $18.55 $0.66 $0.60 $0.63 -$0.03 Hospitalizations $616.47 $690.42 -$73.95 $170.61 $217.26 -$46.65 Total healthcare
payer costs $677.57 $724.72 -$47.15 $203.40 $224.05 -$20.65
Non-prescription
medications $0.32 $0.34 -$0.02 $0.01 $0.01 $0.00
Productivity losses $136.72 $149.45 -$12.73 $27.28 $35.94 -$8.66
20 Table 3. Cost utility analysis
Full analysis set Cardiorespiratory condition analysis set
Population Treatment group Cost /Subject ($CDN) Difference in cost ($CDN) QALYs /Subject Difference in QALYs ICER (cost/QALY) Cost /Subject ($CDN) Difference in cost ($CDN) QALYs /Subject Difference in QALYs ICER (cost/QALY)
Public Payer perspective
All subjects
IIV-HD
(n=15,990) $678 7.5533 $203 7.5882
SD (n=15,993) $725 $47 7.5530 -0.0003 Dominated $224 $21 7.5813 -0.0069 Dominated
Subjects with 1+ comorbid conditions
IIV-HD
(n=10,750) $831 7.5411 $257 7.5853
SD (n=10,752) $876 $45 7.5399 -0.0012 Dominated $293 $36 7.5750 -0.0103 Dominated
Subjects 75 + years of age
IIV-HD
(n=5,409) $892 7.5242 $265 7.5807
SD (n=5,430) $892 <$1 7.5194 0.0049 $82 $292 $27 7.5659 -0.0148 Dominated
Societal perspective
All subjects
IIV-HD
(n=15,990) $815 7.5533 $231 7.5882
SD (n=15,993) $875 $60 7.5530 -0.0003 Dominated $260 $29 7.5813 -0.0069 Dominated
Subjects with 1+ comorbid conditions
IIV-HD
(n=10,750) $996 7.5411 $292 7.5853
SD (n=10,752) $1,055 $59 7.5399 -0.0012 Dominated $340 $47 7.5750 -0.0103 Dominated
Subjects 75 + years of age
IIV-HD
(n=5,409) $1,062 7.5242 $303 7.5807
21 Table 4. Unit Costs of Resource Items (2014 Canadian dollars)
Resource Item Cost/Unit Reference
IIV-HD (Fluzone® High-Dose) vaccine $31.823/injection [1]
SD vaccine $5.82/injection [2]
Ibuprofen, 200 mg, three and a half times daily for 4 days (non-prescription) $1.54/course [3]
Ibuprofen, 600 mg, three times daily for 4 days (prescription) $10.53/prescription [4]
Oseltamivir, 75 mg, twice daily for 5 days (prescription) $52.45/prescription [4]
Azithromycin, 500 mg day 1, 250 mg days 2-5 (prescription) $17.30/prescription [4]
Emergency department visit $506.53/visit [5, 6]
Non-routine medical office / urgent care visit $85.13/visit [6]
Hospitalization per diems dependent on ICD-10 code (n=146) [7]
Daily wage $188.40/day [8]
[1] Centers for Medicare & Medicaid Services. Seasonal Influenza Vaccines Pricing. [cited 2014 13 February]; Available from:
http://www.cms.gov/Medicare/Medicare-Fee-for-Service-Part-B-Drugs/McrPartBDrugAvgSalesPrice/VaccinesPricing.html
[2] Data from Sanofi Pasteur.
[3] Shoppers Drug Mart, Burlington Ontario, October 2014.
[4] Ontario Drug Benefits Formulary. Effective January 3, 2014. [cited 2014 1 October]; Available from: https://www.healthinfo.moh.gov.on.ca/formulary/index.jsp
[5] Seniors’ Use of Emergency Departments in Ontario, 2004–2005 to 2008–2009, Page 17. [cited 2014 15 December]; Available from: https://secure.cihi.ca/free_products/seniors_ed_e.pdf
[6] Canadian Institute for Health Information. Physician Services Benefit Rates Report, Canada, 2012–2013. [cited 2014 1 October]; Available from: https://secure.cihi.ca/free_products/PSBR_2012-2013_en.pdf
[7] Ontario Case Costing Initiative CAT tool. [cited 2015 16 January]; Available from: http://www.occp.com/mainPage.htm
22
Figure 1: Scatter plots representing the statistical uncertainty through a 1,000 bootstrapped samples. Panel A) represents the
full analysis set. 89% of bootstrapped data showed that IIV-HD was cost-saving. Panel B) represents data from the cardio-respiratory condition analysis set. 80% of the bootstrapped data showed that IIV-HD was cost-saving and more effective.
89.1% of points fall in the lower quadrants