AIM-ASEM (IJCIEOM 2019). Novi Sad, Serbia, July 15-17th
Reverse logistics optimisation model for end-of-life wind
turbine blades waste composites
Rentizelas A1, Trivyza NL2, Lichtenegger G3
Abstract: Wind power is a promising renewable source of energy that has been experiencing significant growth over the last decades. The estimated life of the wind turbine blades is approximately 20 years and the first wind farm generations are approaching their end of life, leading to a considerable amount of waste materials from blades in the next years. Most of this material is currently landfilled or incinerated, thus not following a circular economy approach. In order to support more circular economy-oriented solutions, this work proposes a mixed integer linear programming model to optimise the reverse supply network design, from the wind turbine blades location to the end consumer of the recycled product. The developed model is applied on a case study in Europe, by employing data for wind farms from European databases. The output of the case study application is the most cost-efficient network design of the reverse logistics supply chain in Europe. Finally, the benefits of the proposed optimisation model for decision making of the logistics network configuration in a circular economy perspective are discussed.
Keywords: glass fiber composites; reverse logistics; optimisation model; wind turbine blades waste; recycling
1 Introduction
Access to sustainable energy is one of the European Union’s targets for the next decade, therefore great share of the global mix is provided by renewable energy. Wind power is a promising source of energy that has been rapidly rising in recent years. In 2017 it was the second largest form of power generation in Europe with total installed capacity almost 170 GW (Fraile and Mbistrova, 2018). Wind turbine blades have an estimated lifetime of 20 years and currently the first generation of turbines is reaching their end of life. Furthermore, a non-negligible percentage of blades, estimated around 1-3% need replacement yearly (Sheng, 2013). It is estimated that the amount of end of life material is going to reach 50,000 tonnes per year in 2022 and it will be doubled by 2034 (Larsen, 2009). Other studies estimate that by 2050, 43 million tonnes of blade waste material will be available in the world and in specific 11 million of tonnes in Europe (Liu and Barlow, 2017). Wind turbine blades mainly consist of composites containing glass and carbon fibres, as a result, in the next years a great amount of composites waste will be disposed.
A common approach for the wind blades end of life is landfilling, however in some countries either the cost is high, or it is banned. Another approach is to incinerate the blades for energy recovery, however this process has many disadvantages (Beauson and Brøndsted, 2016). Therefore, the recycling of end of life wind blades is a topic that has attracted great attention both in industry and academia (Larsen, 2009; Liu et al., 2019).
AIM-ASEM (IJCIEOM 2019). Novi Sad, Serbia, July 15-17th
2 Objectives
This study addresses the problem of recycling the composites from the wind turbine blades and reusing them in value-added products. The objective of this work is to determine an optimal reverse logistics network configuration to improve the sustainability and feasibility of the innovative value-chains. The model developed is presented in Section 3, including the input data used. Then the results are discussed in Section 4 and the concluding remarks are presented in Section 5.
3 Methods
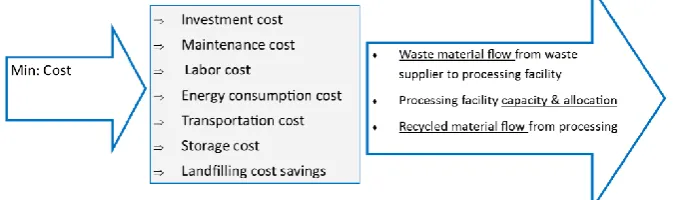
[image:2.595.99.438.281.381.2]A Mixed integer linear programming model is developed to optimise the reverse supply network design, linking the wind blades waste generation stage to the end consumer of the recycled product. The developed model is presented in Figure 1.
Fig. 1 Reverse supply chain optimisation model
The annualised cost of the reverse supply network is optimised, considering all the processing stages of the waste material. The most promising scenario identified for the wind blades mechanical recycling is presented in Figure 2, including cutting in-situ, transporting to the facility, further shredding in the facility until reaching the optimal size and finally transporting to the end customer.
Fig. 2 Reverse-logistics supply chain
1Athanasios Rentizelas (e-mail: [email protected])
Department of Design, Manufacture and Engineering Management . University of Strathclyde. 75 Montrose Street, G1 1XJ, Glasgow, UK.
2Nikoletta L. Trivyza (e-mail: [email protected])
Department of Design, Manufacture and Engineering Management . University of Strathclyde. 75 Montrose Street, G1 1XJ, Glasgow, UK.
3Georg Lichtenegger (e-mail : [email protected])
[image:2.595.93.455.472.646.2]AIM-ASEM (IJCIEOM 2019). Novi Sad, Serbia, July 15-17th
Each processing stage is modelled, considering the operational and investment costs included, as well as the conversion factor of the material derived from experimental results for the technologies performance. In addition, the model considers the savings from avoiding landfilling.
The objective function is presented in Equation 1.1 and the decision variables are the recycled material flow from the facility to each customer, the waste material flow from fiber waste suppliers to the processing facility and finally the processing facility location as well as size.
𝑚𝑖𝑛𝑖𝑚𝑖𝑠𝑒 𝐹 = 𝐶𝑖/𝑌 + 𝐶𝑡𝑖𝑛+ 𝐶𝑠𝑡+ 𝐶𝑓𝑠+ 𝐶𝑚+ 𝐶𝑜𝑣+ 𝐶𝑜𝑓+ 𝐶𝑡𝑜𝑢𝑡− 𝑅𝑑𝑖𝑠𝑝 (1.1)
Where F is the total cost, Ci is the total investment cost, Y is the useful life of the technology, Ctin is the cost of transportation of the waste to the processing facility, Cfs is the facility setting up and permit cost, Cm is the facility maintenance cost, Cov is the variable operating costs including the electricity and tool wear, Cof is the fixed cost including the labor cost, Ctout is the outbound transportation cost and finally Rdisp are the revenues from avoiding the waste disposal.
It is assumed that more than one waste supplier can supply the same processing facility, whereas, one processing facility can supply more than one customers. The potential processing facilities location is identified for a granularity of NUTS 2 Europe regions. Each facility can have only one potential capacity. Explicit geographical location of the wind farms and the customers is assumed and the distances are estimated according to GIS network analyst, considering the driving distance between two points. In the cases that sea transportation is considered then the artificial routes were created to the nearest port.
2.1 Model inputs
For the model application the available glass fibers waste material in wind blades in Europe was estimated in addition with the demand of recycled mechanically treated glass fibers.
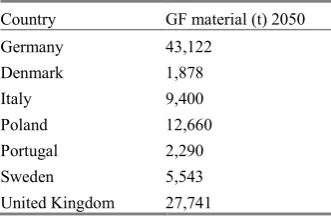
First, forecasts were developed to estimate the amount of composite materials derived from wind farms in Europe until 2050 in order to model the material input. Data from a database with the current wind farms in Europe and their characteristics were used to locate the current capacity of wind farms and blade material. Scenarios for the wind power capacity in Europe until 2050 were used according to the EU reference scenario (EuropeanComission, 2016). A stochastic distribution developed from historic data for wind turbines decommissioning was employed to estimate the end of life material of wind blades. In addition, a 2% replacement rate of wind blades material was assumed during the wind turbines lifetime (Sheng, 2013). As a result, the amount of waste blade material in 2050 was estimated. According to technical reports on existing wind blades, 65% of the blade consists of glass fibers. Therefore, the amount of glass fibers from wind blades per country in 2050 is estimated in Table 1. Only the countries that are forecasted to have the majority of wind power capacity in Europe are considered in this application.
[image:3.595.85.251.655.763.2]It is estimated that approximately 100,000 t of glass fibers waste material will be available in 2050, with Germany and United Kingdom having the greatest contribution. From Table 1 it is estimated that Germany provides almost 42% of the material, whereas, United Kingdom 30%. However, for United Kingdom the majority of the blade waste derives from offshore wind turbines.
Table 1Amount of glass fibers from wind blades
Country GF material (t) 2050
Germany 43,122
Denmark 1,878
Italy 9,400
Poland 12,660
Portugal 2,290
Sweden 5,543
AIM-ASEM (IJCIEOM 2019). Novi Sad, Serbia, July 15-17th
[image:4.595.109.410.228.369.2]Then, the potential customers’ location and demand for mechanically recycled glass fibers were identified. Mechanically treated short glass fibers can be used as fillers in thermoset bulk molding compound and sheet molding compound (BMC/SMC) products with a percentage of 40-50% (Witten et al., 2018). BMC/SMC is used in several sectors, including the automotive, transportation, electronics and building applications. Therefore, a cross sectoral approach is followed for the proposed circular economy model, where the waste from the wind blades is recycled and used in different sectors. The majority of the manufacturers in Europe were identified along with the demand, as it is presented in Figure 3.
Fig. 3 Demand of SMC/BMC manufacturers in Europe
[image:4.595.85.253.544.653.2]Other model input parameters are the landfilling cost for each country presented in Table 2. The landfilling costs were derived from CEWEP, (2017), however the proposed values are the current prices and in the future there is an indication that the prices will be higher or in some cases the landfilling will be banned. In the cases were the landfilling is banned already like in Germany, then the gate fee for energy recovery options through incineration is considered. The potential capacity in Table 3 of the facilities is considered according to existing plants and the cost is derived according to the economy of scale with a scale factor for grinding technology. Finally, other model input parameters are presented in Table 4. The energy consumption and tool wear is derived from experimental data. The personnel and storage cost is assumed proportional to the facility according to existing plants. Finally, the inbound and outbound transportation is derived from real costs of waste transportation with trucks.
Table 2Cost of landfilling per country considered
Country Landfilling cost (€/t)
Germany 156
Denmark 79
Italy 15
Poland 64
Portugal 11
Sweden 50
United Kingdom 100
Table 3Facility potential capacities and investment cost
Capacity (t) Cost (€)
1,000 251,479
4,000 619,213
16,000 1,524,683
76,000 4,197,885
[image:4.595.85.251.680.762.2]AIM-ASEM (IJCIEOM 2019). Novi Sad, Serbia, July 15-17th Table 4Model input parameters
Parameter Value
Cost of electricity 0.09 (€/kWh)
Energy consumption 1,000 (kWh/t)
Inbound transportation cost 0.01 (€/tkm)
Labor cost 8.64 (€/t of facility)
Maintenance cost 3% of the investment
Outbound transportation cost 0.015 (€/tkm)
Storage cost 0.11 (€/m2 required )
Tool wear 62 (€/t processed)
4 Results
The proposed model is applied on a case study considering the wind farms in Europe, in order to showcase the applicability of the model and discuss the feasibility of circular economy approaches through mechanical treatment of glass fibers from wind turbine blades. The output of the model is the most cost-efficient network design, including the processing facilities location and capacities, the waste stream flows as well as the recycled product stream flows. The results emphasise the trade-off between transporting the waste material and economies of scale, i.e. centralised versus decentralised processing. The model was solved with CPLEX and implemented in GAMS.
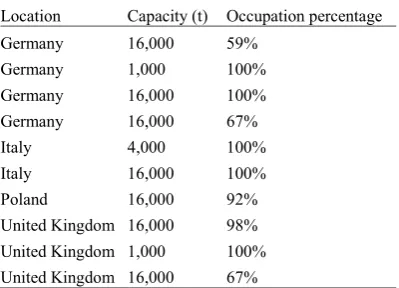
The results of the optimisation suggest that ten facilities with relatively low capacity are built in several locations as presented in Table 5. The greatest facilities capacity is located first in Germany with 49,000 t in total and then in the United Kingdom with 33,000 t in total. It can be inferred that the facilities are built only in locations were wind farms are available, therefore reducing the inbound transportation.
However, in Table 5 it is identified that in many cases instead of building one high capacity facility in one country, more facilities with low capacity are preferred. This is highlighted with Germany, where four facilities are proposed from the optimisation, one of which has a very low capacity (1,000 t). Another observation that arises from the results is that the facility occupation is either almost complete ranging from 92% to 100% or medium occupation, 60% to 70%; therefore, indicating the need for more intermediate capacities in Table 3. In addition, it is possible that in reality the facility capacity would be built with some margin in order to cope with the uncertainty of future material increase. Further investigation is required with different scenarios in order to identify the optimal facility capacity.
Table 5Facilities identified by the optimisation
Location Capacity (t) Occupation percentage
Germany 16,000 59%
Germany 1,000 100%
Germany 16,000 100%
Germany 16,000 67%
Italy 4,000 100%
Italy 16,000 100%
Poland 16,000 92%
United Kingdom 16,000 98%
United Kingdom 1,000 100%
United Kingdom 16,000 67%
[image:5.595.85.285.551.695.2]AIM-ASEM (IJCIEOM 2019). Novi Sad, Serbia, July 15-17th
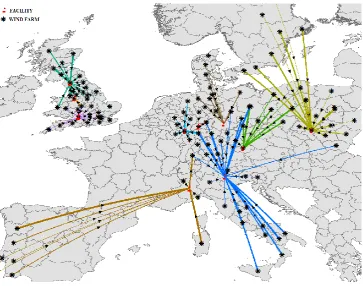
[image:6.595.85.449.199.485.2]From the map it is identified that the facilities in Italy collect the material from Italy, Portugal and from few wind farm in Poland and Germany. It is observed in the figure that in some cases a wind farm can supply material in more than one facilities. In addition, it can be inferred from the optimal networks that the supply of the wind turbines material depends on the inbound distance between the facility and the wind farms.
Fig. 4 Supply flow of waste material
The flow of the material from the facilities to the customers identified in Figure 3 are depicted in Figure 5.
[image:6.595.87.407.553.727.2]AIM-ASEM (IJCIEOM 2019). Novi Sad, Serbia, July 15-17th
The figure shows both the amount of material transported to each customer and the connections that exist between facilities and customers. It is evident that in some cases the material required from one customer is provided by more than one facilities. In the specific application the demand is not fully satisfied since the supply is lower than the demand. In addition, it is observed that the facilities are built near the customers that have the highest demand as it was identified from Figure 3, which are in Italy, Germany, United Kingdom and Poland. On the other hand, customers in Spain and France are satisfied by facilities from neighbour countries. Therefore, according to the previous argument it is inferred that the facilities are built in the countries that have both wind farms to supply material as well as, near the areas where a customer is located. As a result, the inbound and outbound distance drive the optimisation problem of the facility allocation.
In addition, it is worth highlighting that the facilities are not centralised, where a very large scale process is built having as a results a very high cost for transporting the material, whereas on the other hand having a lower investment cost due to the economy scale. However, the facilities cannot be considered completely decentralised, which means having numerous smaller facilities that have high cost due to the lack of economy of scale. Therefore, there is a trade-off between the proximity of the facility to the customer and suppliers and the economy of scale.
[image:7.595.90.365.409.561.2]The economic assessment of the reverse supply chain of wind blades plastic is presented in Figure 6. It is identified that the recycling process is energy intensive, since it constitutes more than 80% of the processing costs. The operational cost constitutes the largest processing cost due the high amount of material that is shredded. In addition, the wind blades length is approximately 60m and during the mechanical process the output size is short fibers that range from 2 to 10 mm, therefore the tool wear and electricity required is quite high. The next high cost is allocated to the inbound and outbound transportation of the material, as well as the annualised investment cost. In this work the facility’s useful life was assumed 15 years, which is common for similar technologies.
Fig. 6 Economic assessment of reverse supply chain
The results indicate that the wind power industry in 2050 will generate almost 100,000 tonnes of waste, which in order to be disposed in landfill will cost approximately 11 million €. This value it is possible that it is underestimated, considering that the landfilling values were according to 2020 regulations and it is possible that in 2050 they will be higher or even there is a possibility that landfilling will be banned. On the other hand, recycling the waste will cost almost 20 million €, including storage, maintenance, operational, inbound and outbound transportation, facility investment and administrative costs. In the case of recycling the disposal costs are considered as savings and as a result the total cost of recycling the wind blades is 8.5 million €. This leads to 0.085 €/kg of mechanically treated glass fibers. The results prove that the proposing technological option can be economically viable for the wind blades recycling.
AIM-ASEM (IJCIEOM 2019). Novi Sad, Serbia, July 15-17th
5 Conclusion
In this work, a reverse logistics optimisation model for end of life wind turbine blades composites in order to improve the economic and environmental sustainability of innovative value-chains, adopting a cross-sector approach was proposed. The optimisation model was applied on a case study in Europe and the optimal network configuration for 2050 was presented. The benefits of the model for decision making of the logistics network configuration in a circular economy perspective were demonstrated.
The optimal reverse logistics network optimisation was identified for 2050. The results of this study could be an indication for future investment of recycling facilities, to support the decision maker identify the location that it would be more economically sustainable to build the facility, in addition with the optimal capacities.
This work could also be beneficial to policy makers, since it was identified that the amount of blade waste material will increase dramatically in the next years, therefore alternative paths to treat it need to be identified. In addition, currently there are restrictions of transferring the composites waste from one country to the other. Herein this limitation was not acknowledged and the results indicated that transboundary transportation would be required, therefore the results of this work could benefit the policy makers into amending the regulations. The developed model is generic and can be used in different geographical contexts without adaptations if the required data are available. Therefore, it could be used for applications with greater granularity, in a country level considering specific regions or even in the whole of Europe with lower granularity.
For future research the model could be applied to the whole Europe, including other potential demand for mechanically recycled glass fibers in order to propose optimal networks that can be used for the total wind blades waste material in Europe for 2050.
Acknowledgment
This project has received funding from the European Union’s Horizon 2020 research and innovation programme under grant agreement No 730323.
References
Beauson, J. and Brøndsted, P. (2016), “Wind Turbine Blades: An End of Life Perspective”, MARE-WINT: New Materials and Reliability in Offshore Wind Turbine Technology, Springer, Cham, available at:https://doi.org/https://doi.org/10.1007/978-3-319-39095-6_23.
CEWEP. (2017), Landfilling Tax in Europe, available at: www.cewep.eu.
EuropeanComission. (2016), Energy, Transport and GHG Emissions Trends to 2050, European Comission, available at:https://doi.org/10.2833/9127.
Fraile, D. and Mbistrova, A. (2018), Wind in Power 2017: Annual Combined Onshore and Ofshore Wind Energy Statistics, available at: windeurope.org.
Larsen, K. (2009), “Recycling wind turbine blades”, Renewable Energy Focus, Elsevier Ltd, Vol. 9 No. 7, pp. 70–73.
Liu, P. and Barlow, C.Y. (2017), “Wind turbine blade waste in 2050”, Waste Management, Vol. 62, pp. 229–240.
Liu, P., Meng, F. and Barlow, C.Y. (2019), “Wind turbine blade end-of-life options: An eco-audit comparison”, Journal of Cleaner Production, Elsevier Ltd, Vol. 212, pp. 1268–1281.
Sheng, S. (2013), Report on Wind Turbine Subsystem Reliability - A Survey of Various Databases, National Renewable Energy Laboratory, available at: https://www.nrel.gov/docs/fy13osti/59111.pdf. Witten, E., Mathes, V., Sauer, M. and Kühnel, M. (2018), Composites Market Report 2018: Market