City, University of London Institutional Repository
Citation: Njoum, H. and Kyriacou, P. A. (2018). In vitro validation of measurement of
volume elastic modulus using photoplethysmography. Medical Engineering & Physics, 52,
pp. 10-21. doi: 10.1016/j.medengphy.2017.11.011
This is the accepted version of the paper.
This version of the publication may differ from the final published
version.
Permanent repository link: http://openaccess.city.ac.uk/18765/
Link to published version: http://dx.doi.org/10.1016/j.medengphy.2017.11.011
Copyright and reuse: City Research Online aims to make research
outputs of City, University of London available to a wider audience.
Copyright and Moral Rights remain with the author(s) and/or copyright
holders. URLs from City Research Online may be freely distributed and
linked to.
In
vitro
validation
of
measurement
of
volume
elastic
modulus
using
photoplethysmography
Haneen
Njoum
∗,
Panayiotis
A
Kyriacou
ResearchCentreforBiomedicalEngineering,SchoolofMathematicsComputerScienceandEngineering,City,UniversityofLondon,London,UK
a
b
s
t
r
a
c
t
Arterialstiffness(AS)isoneoftheearliestdetectablesymptomsofcardiovasculardiseasesandtheir pro-gression.CurrentASmeasurementmethodsprovideanindirectandqualitativeestimationofAS.The pur-poseofthisstudyistoexploretheutilisationofPhotoplethysmography(PPG)asameasureofvolumetric straininprovidingadirectquantificationoftheVolumeElasticmodulus(Ev).Aninvitroexperimental
setupwasdesignedusinganarterialmodeltosimulatethehumancirculationinhealth (Model2)and disease(Model1). Flow,pressure,and PPGsignalswererecordedcontinuouslyundervariedconditions offlowdynamics.TheobtainedEvvalueswerevalidatedwiththegoldstandardmechanicaltesting
tech-niques.Valuesobtainedfrombothmethodshadnosignificantdifferenceforbothmodelswithapercent errorof0.26%and1.9%forModel1andModel2,respectively.ThisstudyshowsthatPPGandpressure signalscanprovideadirectmeasureofASinaninvitrosetup.Withemergingnoninvasivepressure mea-surementmethods,thisresearchpavesthewayforthedirectquantificationofASinvivo.
1. Introduction
Cardiovasculardiseases (CVD)are theforemost causeofdeath globally,withnumerousriskfactorssuchasdiabetes,hypertension, hypercholesteremia,smokingandobesityassociatedwiththeir de-velopmentandprogression[1–3].Manystudieshavereportedthat thepresenceofthesefactorsisrelatedtoachangeinthe mechan-icalpropertiesofthearterialwallandanincreaseinArterial Stiff-ness (AS) [4–8]. AS describesthe reduced capabilityof an artery toexpandandcontractinresponsetopressurechanges.Itsclinical relevanceisduetoitsfundamentalroleinpulsatilehaemodynamic forces,asoneoftheearliestdetectablesymptomsofstructuraland functional changes within the vessel wall. AS is emerging asthe mostimportantdeterminantofincreasedsystolicandpulse pres-sureinourageingcommunity.Therefore,ASisarootcauseof car-diovascularcomplicationsatanearly stageandisassociatedwith acceleratingAtherosclerosis(ATH)[9,10].AnincreaseinAScanbe relatedtotwomajorfactors:(1)anincreaseinIntimaMedia Thick-ness(IMT)duetocalcification,plaqueformation,inflammationand ruptureofelastinandcollagenfibers[11,12];(2)hypertensionand hence an increase inthe CircumferentialStress (CS) affectingthe
∗ Correspondingauthor.
E-mailaddresses: haneen.njoum.1@city.ac.uk(H.Njoum),p.kyriacou@city.ac.uk
(P.A.Kyriacou).
vesselwallwhichisassociatedwithfurthercardiovascular compli-cationsandplaquerupture[13,14].
Itis only recentlythat significant attentionhas beengiven to providing a precise measurement of AS. There has been an in-creased interest in the development of innovative non-invasive methodsanddevicesforthediagnosisofCVDatanearlystagein anefforttopreventfurthercomplications,andmonitor pharmaco-logicalandnon-pharmacological treatments [15,16].In recent pa-pers,weaddressedtheroleofhaemorheologyinthe photoplethys-mographicwaveform[17],andtherelationshipbetweenthe photo-plethysmographicsignalandtransmuralpressurevalues[18]. Fur-therwaveformanalysishasbeenusedfornon-invasiveestimations ofAS[19–21].
are electronically processed, amplified and finally recorded. The PPGsignalcomprisestwo components,thepulsatile AC,andthey non-pulsatileDCcomponent.Theoriginofthesignalandthe ques-tionofwhatdoesPPGactuallymeasureshasattractedwide inter-est fromthe research community over the last decades [25–28]. BesidesthemajorapplicationofPPGinpulseoximetry,thesignal is believedto contain further chemo-mechanical information re-latedtothecirculation[25,29,30].Forexample,therewerestudies wherethePPGwasusedtomonitorbloodpressurenon-invasively
[31–33].Othershavedevelopedmethodsfortheestimationof res-piratorybehaviour[34,35].
In relation to arterial stiffness, a hostof indices derived from PPGandpulsepressure signalshavebeen introduced toquantify AS[4,20,21,36–39].Whenmultipleindicesexist,itisexpectedthat nonehas proved anysuperiority, and all have problemsin mea-surementandinterpretation. NoninvasivemeasurementofAS en-tails measurement of parameters that are intrinsically associated withstiffness. The most widely used method is Pulse Wave Ve-locity(PWV),usedfortheestimationofASbytheStiffness Index (SI)[21,40,41].Furtherstudies haveexplored thepossibilityof us-ingthePPGpulsecounter analysisandprovidetheaugmentation index(AIx)[39,42].AIxisthemeasureofthecontributionthatthe wavereflectionmakes tothesystolicarterial pressure,andis ob-tainedbymeasuringthereflectedwavecomingfromtheperiphery tothecentre.Itisdefinedastheratiooftheheightofthelate sys-tolicpeaktothat oftheearlysystolicpeak inthepressurepulse. ThesecondderivativeofthePPGsignal (SDPTG)hasbeenutilised forthe detectionof the diastolic, systolicand inflexionpoints in thePPGfortheestimationofarterialstiffnessusingAIxorthe Re-flectionIndex[21,43].
The PWV method measures the pulse propagation speed be-tweentwomeasurementsites.Theparameterrelevance toAShas beendescribedinthelate19thcenturybyMoens–Korteweg equa-tion:
PWV=
Eh/(
2rρ
)
(1)and is determined by E, the elastic modulus, arterial geometry (h=thickness, r=radius) and blood density,
ρ
. The assessment involves measurement of two quantities: transit time of arterial pulse along the analysed arterial segment, and distance on the skinbetweenbothrecordingsites.Apracticalproblemthat arises inthe measurement of PWV is when convenient pointsof mea-surementarenotinthesamelineoftravel.Moreover,inaccuracies arehighlyexpectedindeterminingtheactualarterialdistance be-tween recording sites from measurements on the surfaceof the body[40].PWV inlarge central elasticarteries such astheaorta increasesmarkedlywithage,whereasinupperlimbarteriesPWV doesnotincrease.Furthermore,fundamentallimitationsstilloccur withPWV measurement duetoignoring some ofthemajor vari-ables inthe circulation.Such factors includethe pumpingpower oftheheart,bloodrheology,andtheresistanceofthe microcircu-lation.Allsuchfactorsareassociatedwithchangesinthethickness ofthearterialwall(h),thearterialradius(r)andblooddensity(ρ
), whichwilldirectlyaffectPWV,andhenceachangeinPWVmight notnecessarilyreflectonlystiffnesschangesinallcases[44–46].Pulse pressure, pressure AIx and ambulatory arterial SI have beenwidely used in the identificationof large AS. Over the age of60years, pulsepressureis expectedto increase andis associ-atedwithadominantriseinAS.However,inyoungsubjects,pulse pressureincrease at the peripheral sitemaylead to misinterpre-tations of hypertension. Thus, pulse pressure may not be a very accuratemarkerforassessingAS[47].
All indicessuggestedare known tobe qualitative andindirect inprinciple.Clarenbachetal.reportedastudycomparingPPGwith tonometry[20].ThisstudyconcludedthatAIxandSIweakly corre-latedinpatientswiththechronicpulmonarydiseaseorobstructive
sleepapnoea.Such correlation wasnot observed atall when pa-tients withlow cardiovascularrisk were included intheanalysis. Moreover, AIx did not differentiate between patients with inter-mediateandhighcardiovascular risks.Jerrardetal.demonstrated thatinahypertensivepopulation,therewasapooragreement be-tween PWV, AIx and pressure pulse methods. Following adjust-mentforageandgender, nocorrelationwasobserved[38].Some other studies have shown IMT and PWV to be positively corre-lated,however,suchrelationswererelativelyweakandsome stud-ieshaveshownnorelation[10,12].Zureiketal.foundno associa-tionin564subjectsafteradjustingforageandbloodpressure[48]. Comparedwiththeoriginal reportsthereissufficientevidencein theliteraturesuggestingapoorcorrelationbetweenthose param-etersinhypertensivepatientswhethertreatedoruntreated,tothe extentthatallcorrelationswerelostfollowingadjustmentforage andgender.Thecurrentunderstandingisthat thereisadisparity intheabilityofthesemeasurestopredictfuturevascularevents.
TheVolume Elasticmodulus(Ev)isestimatedfromtheregional
Pressure–Volume(P–V)relationship.Thisparameterprovides com-prehensive information on the arterial wall properties regarding the globaleffectof thecirculation. Ahighervalue ofEv suggests
increasedstiffness.Currently,therearenostudiesintheliterature reportingonthepreciseanddirectmeasurementofEvofthe
arte-rialwallusingnon-invasivemethods.
Inthisstudy,wehavedevelopedanewmethodtomeasureEv
using the PPGand pressure signals.We validated themethod in aninvitromodelofhumancirculationinhealthanddisease. Dur-ing an in vivo scenario,manyfactors can influence thedynamics oftheflow.Thisincludesthevassaltone,thespecificbiochemical content, andthe endothelial activity. Such factors also varyfrom oneparticipanttoanotherandcanbealteredinthesame partic-ipantthroughoutthe day.Toovercome some oftheselimitations anddevelop abetterunderstandingofthequantitative analysisof thePPG,an in vitrosetupwasdeveloped.Thisallowed validation oftheproposedmethodwiththegoldstandardelasticitymethod ofextension testingandgeneratingthetruestress-straincurve, a merely unfeasible practice for in vivo studies. In this paper, we presentinvitroresults,highlightingthecapabilityofusingthePPG componentsasameasureofASwhichcouldcontributefurtherin thediagnosisofcomplicationsrelatedtobiomechanical abnormal-itiesinthearterialwallandtheendothelium.
1.1. Theoreticalmethod
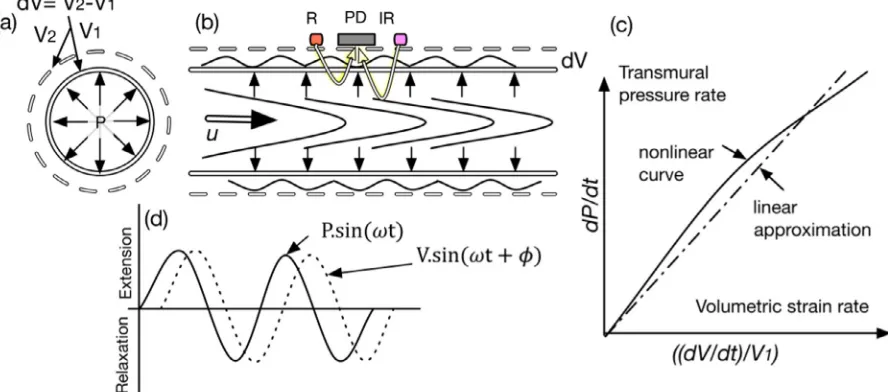
Consider a circulartube with an initial volume (V1); suppose theinnersurfacesofthetubeareexposedtotransmuralpressure (P);forcesofradial stressareperpendiculartoandactonall sur-facesuniformlyasseeninFig.1(a).Theresponseoftheobjectto thisuniformstressisanexpansionofvolumetoV2.Thisbehaviour
canbecharacterisedusingthebulkmodulusortheVolumeElastic modulus(Ev) whichcanbeexpressedwiththefollowing
relation-ship:
dV V
.Ev=dP (2a)
wheredP,isthechangeinthetransmuralpressuresignal, anddV
Fig.1. (a)Cross-sectionalviewofflowinacylindricalmodel.(b)Sideviewofflowinathemodelwithapulsatilepressuresignal.(c)isarepresentationofthenonlinear curveandthelinearapproximationformeasurementofElasticVolumeModulus(d)therelationshipbetweenthepulsatilepressureandthepulsatilestrainsignals,where w,istheradianfrequency,andisthephasebetweenbothsignals.
to haveanoscillatingtime-dependentvolumetricsignal dVanda steadyflowvolumeV,theconstantvolumeofthesteadyflowthat developsatthecentreofthetube.
Ev=d
(
dP/dt)
/d((
dV/dt)
/V)
(2b)1.2. Measurementofvolumetricstrain
The volumetricstrain in the arterialmodel wasmeasured us-ing the PPG signals.We consider the pulsatile flow to consist of an oscillatory component
(
V˜o)
andasteady component(
V¯s)
[49].Assuming that the Beer–Lambert’s Law holds inthis model,the following equation expresses the relation betweenthe total inci-dent(I0)andtotaltransmittedlight(I)[19,50]:
I=exp
−ε
scsV¯sexp
−ε
ocoV˜oI0 (3)
where c is the concentration of the light-absorbing substancein each component and
ε
is the absorbance coefficient. The sub-scripts,oands,denoteoscillatoryandsteadycomponents respec-tively. Giventhat(
V¯s)
is constant atthe same pressure andwallelasticity,thefollowingequationholdsforthesteadyvolume com-ponent:
¯
I=exp
−ε
scsV¯sI0 (4)
where,
(
I¯)
isconstantlightintensityobtainedfromthesteady vol-umelayer.Hence, from(3) and(4),andbyderiving both sidesinrespect totime,thefollowingcanbederived
˜
Vo=−
ε
c.ln(
I/I¯)
(5)considering thatdI istheamplitudeofthe oscillatoryoptical sig-nal, andI¯is the level of the steady optical signal,at a particular wavelength.Itisnotedthatln
(
I/I¯)
isindirectproportiontothe os-cillatorycomponentofthetotalfluidvolume(V˜o),viatheunknownconstantterm(
ε
oco),presumingthatbothareconstantNormalisedPulseVolume(NPV)canbegivenby
NPV= −ln
(
dI/I¯)
(6)asweareinterestedinthebehaviourofatime-dependentsignal, deriving(6)inrespecttotimeandrelyingontheassumptionthat
(
ε
oco) is an unknown constant term, the rate of change of NPVwouldbe
(
dNPV/dt)
= −(
dI/dt)
/I (7)finally,we introducetherateofchangeofNormalisedVolumetric Strain(NVS)asdNPV/dt/NPVwhichisgivenbythefollowing equa-tion:
dNVS/dt=
(
dI/dt)
/I.ln(
dI/I¯)
(8)consideringthatthereisnochangeofvolumetricstrainwhenthe rateof change of pressure is zerothen Ev from Eq.(2b) can be
expressedasinEq.(9)
Ev=
(
dP/dt)
/(
dNVS/dt)
(9)1.3.Objectives
InordertoinvestigatetheplausibilityofutilisingthePPG com-ponents andpressure signalsfor thequantification oftissue me-chanicalproperties,anin-vitroexperimentwasconductedwithan aimto:
-Evaluatethefeasibilityofthenewmethodfordirect measure-ment ofEvinan invitromodelfeaturinga healthyarteryand
another affected withATH.This isachieved by collecting PPG andpressuresignalsandvalidatetheresultswiththegold stan-dardEvmeasurements.
-Investigate Ev values over a range of pressure values in
nor-motensive,hypotensiveandhypertensiveconditionsby control-lingthestrokevolumeandpulsefrequency.
-Contributetothefurtherunderstandingofthebehaviourofthe PPGinpulsatileflowconsideringthewallelasticpropertiesand flowdynamicforces.
2. Materialsandmethods
[image:4.595.81.525.60.256.2]Fig.2. Aschematicdiagramoftheflowloopusedtoimposemechanicalstressatvariableflowpatterns.
2.1.Thearterialnetworkmodel
Apulsatile flowloopillustrated inFig.2wasdesignedto con-tainanelaborate elastictubesmodelandproducearangeof pat-ternsofmechanicalforcesattheinnersurfaceoftheelastictubing. Apulsatile pump(1423PBP, Harvard Apparatus,US) wasusedto generatethepulsatile flow.The pumpallowed controlof flowby twomeans(1)controllingthestrokevolume(2)andthepumping rate. A custom madeplexiglass fluid reservoir (Volume: 8L) was developedtocontainthefluidforthecirculation.
A flexible Polyvinyl Chloride (PVC) tubing at a length (L) of 20cm, WallThickness (WT) of 3mmand an Inner Diameter(ID) of16mmwasconnectedtotheinputofthesystemtoenablethe flowto be fullydevelopedbefore enteringthe model.The model consistedoftwodifferentelastic transparenttubes withdifferent elasticities.Thepurposeofthetwoelastictubesistosimulatethe changefromhealthyarteriestoanadvancedstageofATHwith re-ducedelasticity andincreased wallthicknessThe setup consisted of two tubes (L: 30cm): (1) Model 1 consisted of a PVC tube (ID:16mm, WT: 1.8mm) whichsimulates a large arteryaffected withATH, with increased IMT and AS; (2) Model 2 is a silicone rubbertube (ID: 16mm,WT: 0.9mm)which simulatesa healthy artery.
The modelwasmounted ontoa custommadesupport system whichincorporatedrubberclamps toholdthetubes straightata constantlength withoutinterferingwiththeir movement. An ini-tialaxialstretchof1–2%wasusedtoensurethattheflexibletubes remainedin a straight position during the pumpingphase. One-waycheck valves with preset opening pressure (50mmHg) were introducedatboth endsofeach tubewhichprovided thecontrol overtheresistanceandbackwardflow.Valveswerealsointroduced atthe entrance ofeach tube to allow control of flow paths and switchto a bypasstube inorderto eliminate anybubblesin the
Fig.3. 3Dillustrationofthecustom-madePPGopticalsensorenclosingatube sec-tion,showingInfrared(IR)andRed(R)LEDs,aphotodiode(PD),mockarteryand thedesignedencasing.
system.Theroomtemperatureduringallinvitroexperimentswas maintainedat23±0.5°C.
2.2. Sensorsandinstrumentation
2.2.1. PPGsensor
[image:5.595.103.485.55.360.2] [image:5.595.305.551.399.520.2]2.3. Pressureandflowmeasurement
The pressure wasmeasured atthe entrance ofeach tube us-ing a catheter tip research grade transducer (Harvard Apparatus, U.S.) inserted through the lumen of the model. The flow rate was measured at the centre of each tube using an ultrasound Doppler (MD2,HuntleighHealthcare,UK)withan 8MHzprobe.A 3D printedholderwasalsodesignedto holdtheprobe ata60◦
anglewiththe tubewithoutinterferingwiththetube’s wall mo-tion.
2.4. PPGprocessingsystemanddataacquisition
FortheacquisitionofPPGsignals,acustom-madetwo-channel dualwavelengthPPGinstrumentationsystemwasdesignedforthis study.The PPGprocessingsystemwasconstructedto pre-process and convert the detected current into voltages for later acquisi-tion.Theprocessingsystemusedmultiplexedcurrentsources (set to 25mA) todrive both red andinfraredLEDs consecutively.The microcontroller generates the digital switching clock so that the photodetectorcaptures bothat afrequencyof 900Hz.The mixed signals were fed into the demultiplexerandwere then split into theirrespectiveredandinfraredPPGsignals.ThePPGsignalswere thenlow-passfilteredatacut-off frequencyof40Hzandamplified withagainof19.Theprocessedpressuresignalsweredigitised us-ingthe9172-cDataAcquisitioncard(DAQ2)(NationalInstruments, UK).Theprocessed redandinfraredACandDCPPGsignalswere digitised using a NationalInstruments PCIe-6321 16-bit data ac-quisitioncard(DAQ1)(NationalInstrumentsInc.,Austin,TX,USA). All signals were digitised at a sampling rate of 1kHz and were recordedforfurtherofflineanalyses.
2.5. Fluidhandling
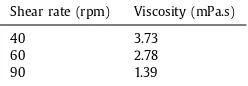
Extra pure hexahydrate Cobalt (II) Nitrate powder Co(NO3)2 (Fischer Scientific, UK) was prepared with a saline solution to produce 2L of a 0.6mol/L solution. The fluid optical properties were measured in the visible and near infrared region using a spectrophotometer (Lambda1050,PerkinElmer).The fluid viscos-ity was measured at shear rates of 40, 60 and 90rpm using a cone/plate viscometer LVD3T (Brookfield, US). pH and conductiv-itymeasurementswere obtainedusingthepH/conductivitymeter (Jenway,UK)
2.6. Invitroexperimentalprotocol
In order to evaluate the plausibility of using the PPG and pressure signalsin the identificationofarterial stiffness, Model 1
andModel2were testedundervarying patternsoffluid dynamic forces.Flowrateswerecontrolledby adjustingthepumpto oper-atefor10minateachpumpingfrequencyrepresentingaheartbeat of40,60and90bpm.
Flow rates were also controlled by adjusting the stroke vol-ume at 30ml and 70ml. At each stroke volume, the pump was alsoadjustedtopumpatthethreedifferentpulsefrequencies(40, 60,90bpm). Systolictodiastolicpumpingratios weremaintained at 25%−75%. To avoidany inaccuracies, a bubble-free flow anda steadypulsatilepatternwere maintained.Thedesignedmodel al-lowedbypassinganytrappedbubblesandadjustmentofpressure limitsby usingtheone-waycheck valvesinstalled ateachmodel andstopcocksattheentranceforeachmodel.
2.7. Dataanalysis
2.7.1. Goldstandardmeasurementofe
The elasticmodulus (E)forboth tubemodelswastestedusing the stress-strain curve fromthe gold standard method. The gold
Table1
Fluidviscositymeasurement.
Shearrate(rpm) Viscosity(mPa.s)
40 3.73
60 2.78
90 1.39
standard is a calibratedelectromechanical systemInstron (model 5900,Instron Co, USA).A 100mm specimenfrom each tubewas extendedatarateof0.1mm/stoobtainthestress-straincurve.Eis calculatedfromtheslopemeasurementofthatcurve.visPoisson’s ratioandis estimatedfromthetraverse-longitudinal straincurve.
EvwascalculatedfromtherelationshipE=3Ev(1−2v).
2.7.2. ProposedmethodforpulseanalysisformeasurementofEv The offline analysis was performedusing automated software developed in Matlab (Mathworks, Inc. Natick, MA). PPG signals were filtered accordinglyto provide the AC andDC components. Peaks andvalleys of PPGand pressuresignals were detected us-ingacustom-madepeakdetectorscriptusingthefirstandsecond derivative. Pressureandoptical rateof changein respect totime wasperformedon30%ofthesignal inthesystolicregionasseen inFig.4.Thisregion waschosen tostandardisethe measurement atdifferent stroke volumesand frequencies. It isthe region that mostlycontributestothechangesinwallstiffnessanditwas pur-poselyselectedinorderto reduce thecontributionoffluid prop-ertiesandresistancethatwillbemostlyobservedinthelower re-gion ofthe systolic phase.The change rateof NVS wasobtained fromthePPGsignalsasdescribedinEq.(8).Toavoidinaccuracies, themeasurement extendedfrom60% to 90% beforethepeak. Fi-nally, Eq.(9)can be rewritten asseen in Eq.(10) andEv can be
calculatedasfollows:
Ev=
(
Pd,c/td,c
)
/Ib,a/
tb,a /Ia.ln
Ipk−pk/I
.K
(10)wherea,b,c,daredenotedasseeninFig.4and
Ipk−pkisthepeak topeak ACamplitude. K isthe inverseofthe total gainconstant usedinthePPGprocessingsystem.
Statisticalanalysiswasperformedusingtheanalysispackagein Matlab(Mathworks, Inc. Natick,MA). The goodness ofmodel fit-tingwasevaluatedwiththeSumSquareError(SSE),R-squareand the Root Mean Square Error (RMSE). Where SSE shows variation fromthemean,R-squareisthepercentageoftheresponsevariable variation,andRMSEisthesquarerootofthevarianceofthe resid-ualsandindicatestheabsolutefitofthemodeltothedata. Corre-lationsignificanceisstatedwithap-valueandt-value.Pulse Tran-sitTime(PTT)valueswerecalculatedasthedifferencebetweenthe locationofthepeakofthePPGAC signalandthepressurepeak.A statisticalt-testwasalsoperformedwithvaluesofp≤0.05 consid-eredto besignificant andthosewherep<.001are highly signifi-cant.Theslopes(Ev)ofthemeasuredandproposedmethodswere
comparedusingtheanalysisofthecovarianceandthepercent er-rorvalueswerealsocalculatedwithanacceptedlimitof5%.
3. Results
3.1. Fluidtesting
[image:6.595.376.500.77.120.2]Fig.4. Three-secondsnapfromtherecordeddata(strokevolume70ml,pumpfrequency:0.6Hz,Model1)portrayingtheadoptedpulseanalyticsmethodforpressureand pulsatileInfrared(IRAC)PPGsignalobtainedbyacustommadesoftwareusingMatlab.Thehighlighteddatapointswereusedforthecalculationoftheslope.
Fig.5. Opticalspectraforthepreparedcobaltnitratesolution.
3.2.EffectofpulsefrequencyPPGandpressuresignals
Thepumpwassettooperateatdifferentpulsatingfrequencies ata constant stroke volume of 30mlfor each model separately. The processed PPG and pressure signals were of high quality.
Fig. 6(a) shows a five seconds sample of recorded infrared AC PPG signals and pressure signals from Model 1 at all operating pulse frequencies (w1=0.6Hz, w2=1Hz, and w3=1.6Hz) at a strokevolume of30ml. Fig. 6(b)showsa fiveseconds sampleof recordedinfraredACPPGsignalsandpressuresignalsfromModel 2 at all operating pulse frequencies (w1=0.6Hz, w2=1Hz and
w3=1.6Hz)atastrokevolumeof30ml.
3.3. Effectofstrokevolumeonopticalandpressuresignals
The pumpparameters were altered to increase stroke volume to 70ml andwassetto operateat thesame threepulsating fre-quencies as describedin Section 3.2. Fig. 7(a) shows a five sec-ondssampleofrecordedinfraredACPPGsignalsandpressure sig-nalsfromModel1,atalloperatingpulsefrequencies(w1=0.6Hz,
w2=1Hz,andw3=1.6Hz) at astroke volume of70ml. Fig. 7(b) showsa fivesecondssampleof recordedinfrared ACPPGsignals andpressuresignalsfromModel2,atalloperatingpulse frequen-cies(w1=0.6Hz,w2=1Hz,andw3=1.6Hz)atastrokevolumeof 70ml.
3.4. Ev calculation
ThissectionpresentsEvvaluesascalculatedfromtheproposed
method forboth models. Fig.8 presents therelationship seen in
Eq.(10)fortherateofchangeofPressureversusthechange rate ofNVS.Fig.8(a)showsvaluesobtainedfromModel1andFig.8(b) showsvaluesobtainedfromModel2.SSE,R-square,andRMSE val-ues indicate the goodness of the linear fit. Values are obtained from cycle-to-cyclemeasurements atboth strokevolumes (30ml and 70ml) and at the three varying pulsefrequencies. Aplot of residualsversuslaggedresidualsispresentedinFig.9forModel1
[image:7.595.93.497.54.400.2] [image:7.595.67.251.456.583.2]Fig.6. Five-secondsampleforInfraredsignals(IRAC)acquiredfromModel1andModel2.Pressuresignals(P)arealsoplottedagainsttherighty-axis.Thissetofdatais acquiredat30mlofstrokevolumeatalloperatedpulsefrequencies;(a)SignalsacquiredfromModel1.atastrokevolumeof30mlandalloperatingfrequencies;(b)Shows signalsacquiredfromModel2atastrokevolumeof30mlandalloperatingfrequencies.
Fig.7. 5ssampleforInfraredsignals(IRAC)acquiredfromModel1andModel2.Pressuresignals(P)arealsoplottedagainsttherighty-axis.Thissetofdataisacquired
at70mlofstrokevolumeatalloperatedpulsefrequencies;(a)SignalsacquiredfromModel1.atastrokevolumeof70mlandalloperatingfrequencies;(b)Showssignals acquiredfromModel2atastrokevolumeof70mlandalloperatingfrequencies.
3.5. Evvalidationusingthegoldstandardmethod
The stress-Straincurvesforboth modelsasobtainedfromthe gold standard elasticity measurement techniqueare presented in
Fig. 10. Fig. 10(a) shows values obtained from Model 1, and Fig. 10(b)showsvaluesobtainedforModel2.ElasticModulus(E)isthe slope value obtainedusing a 1st-degree polynomial fit and Ev is
calculated for each model using the formulaE/3(1–2v). Where v
is thecalculated Poisson’sratio andisestimatedfor each model. The obtainedvvaluesforModel1andModel2 were0.4914 and 0.4884,respectively.SSE,R-square,andRMSEvaluesindicate good-nessofthelinearapproximationfit.
Fig.10 presents thestress-strain scattergrams asobtained us-ingthe goldstandardmethod.A linearapproximationis fittedto the data. Fig. 10(a) shows the measured Values for a sample of
Model1andFig.10(b)showsthemeasuredvaluesforasampleof
Model2.Elastic Modulus is theslope of thefitting equation and VolumeElasticModulusiscalculatedusingthePoisson’sratio.The dottedlinesrepresentthe99%predictionbounds.
[image:8.595.57.547.56.272.2] [image:8.595.59.549.330.552.2]Fig.8. ScattergramsandlinearregressionmodelsfortherateofchangeofPressureversustherateofchangeonNormalisedVolumetricStrain;(a)Valuesobtainedfrom
Model1;(b)valuesobtainedfromModel2.Evvaluesaretheslopeofthefittingequation.R-square,SSE,andRMSEpresentthegoodnessoffit.Pointsareobtainedfrom
cycle-to-cyclemeasurementsatbothstrokevolumesandatvaryingpumpingfrequencies.
Fig.9. Plotofresidualsversuslaggedresiduals;(a)Model1and;(b)Model2.
Table2
Statisticalcomparisonbetweentheproposedmethodand the gold standardofEv measurement for Model 1 and Model2.
Model p-value Significant Percenterror(%)
Model1 .409 No 0.258
Model2 .080 No 1.85
3.6.TheeffectofstrokevolumeandpulsewavevelocityonEvand PTT
Instantaneous Ev and PTT were calculated at different stroke
volumesandateach pumpingfrequency.Boxplots forthe instan-taneousEvandthepulsetransittimemethodscalculatedforboth
models are presented in Fig. 11. Fig. 11(a) shows values for Ev
methodand Fig. 11(b) showsvalues for the PTT method. Values
wereestimatedover1minofcycle-to-cycledataateachfrequency and stroke volume 70ml (70), 30ml (30) and for both models,
Model1(M1)andModel2(M2).
Infact,Bonferroni’smultiplecomparisonstestswereableto de-tectasignificantdifference betweenModel1andModel2atboth strokevolumes,andatallpumpingfrequencies fromthePTTand
Ev methods.However,thePTTmethodwasnotabletodetect
dif-ferencesat increasing pumpingfrequencies inModel 2from1Hz to1.8Hz.Atafrequencyof1HzModel2seemedtoproducehigher elasticityathigherstrokevolumesfromthePTTmethod.
The Ev method showed a consistent significant drop in wall
stiffnesswithincreasingpumpingfrequencies. Moreover,a signif-icantincrease inwallstiffnesswasobserved athigherstroke vol-umes.Nevertheless,thisobservationdiminishedatafrequencyof 1.8Hz with no significant difference in Ev values at both stroke
[image:9.595.48.543.56.301.2] [image:9.595.80.511.345.532.2] [image:9.595.71.247.601.637.2]Fig.10. Stress-strainscattergramsasobtainedusingthegoldstandardmethod,Instron.Alinearapproximationisfittedtothedata;(a)MeasuredValuesforasampleof
Model1;(b)MeasuredvaluesforasampleofModel2.
Fig.11. BoxplotsfortheinstantaneousEv andthepulsetransittimemethodscalculatedforbothmodelsatvaryingpumpingfrequencyarepresentedinFig.11.Panel(a)
showsvaluesforEvmethodandPanel(b)showsvaluesforthePTTmethod.Valueswereestimatedover1minofcycle-to-cycledataateachfrequencyandstrokevolume,
70ml(70),30ml(30)andforbothmodels,Model1(M1)andModel2(M2).
4. Discussion
Anaccuratemeasurementofarterialvolumeelasticmoduluscan be significant forseveralmedical applications.Ev can provide
in-formation onthe arterial wall propertiesregardingthe global ef-fect of the circulation.Particularly for ourinterest, Ev is ofgreat
importanceasitcanbeusedfortheprognosisofCVDatanearly stage[10].Prominently,ATHisdirectlyrelatedtoanincreasein ar-terialstiffness[51,52].Thisincreaseinstiffnesscanbeduetotwo mainreasons,theprogressiveformationoffibrosis,plaqueand cal-cificationandhence,increasedIMT[11],ortheincreaseinCSand symptomatic hypertension [53].As thesesymptoms persist, they can causefurther damage andruptureof the arterialwall which canleadtothrombosisandstroke[54,55].Interventionatanearly stagewillbelife-changingformanypatients.
The linear regressionwaswell fittedfordP/dt versus the rate of changeof dNVS/dt.Correlation coefficientswere highly signifi-cant(p<.001)forbothmodelsasseeninthescattergramsinFig. 8.Valuesfromtheproposed methodforEvmeasurement showed
agreement withthe goldstandardInstron elasticitymeasurement withno significant difference asseen in Fig.10 andTable 2 and percenterrorswerewithintheaccepted5%limitforbothmodels.
Thesefindings highlightthatPPGcan providea measureof volu-metricstrain viathe proposedmethod andhence,using pressure values,anaccuratemeasureofEv.
4.1. Effectofstrokevolumeandpumpingfrequency
[image:10.595.99.506.57.239.2] [image:10.595.51.560.278.462.2]associatedwithariskoflesionrupture[53,56]duetotheincrease intransmuralpressures andcircumferential stress.Thatis tosay, the more elastic wallsare capable of absorbing fluid energy de-liveredfromthepump,wherethisenergyisreflectedbackto the fluidandconsumedaskineticenergyratherthanbeingdissipated atthewallinterfaceregion,causingasignificantincreasein pres-surevaluesasseeninModel1.
TheinstantaneousEvvaluesasseeninFig.11highlightthatan
increase in pumping frequency increase wall stiffness. While Gi-annattasioet al.observed that AS increase withincreasing heart rate[57],Wilkinsonetal.alsoobservedaninverserelationship be-tween AIxand heart rates,however,this waspossibly causedby thechanges in ejection times [58]. While applyingsuch theories tosyntheticmaterialsisnotcompletelyaccurate,froma mechani-calpointofview,thisstudyagreeswiththefindingsof Giannatta-sioetal.,that wallstiffnessinelasticmaterials increases(drop in distensibility)atincreasingpumpingfrequencyduetotheconcept ofstress stiffening,wherethestress state(transmuralpressure in thiscase) determines the stiffening of the wall. While these ob-servationswere consistent andsignificantin bothmodels viathe InstantaneousEvmethod,thePTTmethodwasable todetectthis
behaviourinModel1,nevertheless,therewasnosignificant differ-enceobservedinModel2whenthefrequencyincreasedto1.8Hz atbothstrokevolumes.Thoughthisbehaviourisnotclear,itmight be possiblethat the fluid wave velocity reachedits maximum at 1Hz,andthephasebetweenpressureandvolumetricstrainsignals didnotchange.ThePTTmethoddoesnotdirectlyaccountpressure orstressvaluesandhenceoursuggestionthatitmightbe inaccu-ratelyinterpretedinsomecases.
At low pumping frequencies, the effect of stroke volume seemedtobesignificant,withhigherwallstiffnessvaluesobserved atlowerstrokevolumes.Theeffectofstrokevolumediminishedat higherpumping frequencies, where at 1.8Hz, both Instantaneous
Ev values hadno significant difference. Yet, thePTT method was
stillabletodetect asignificantdifference invaluesbetweenboth strokevolumesatthehighestfrequency.Withincreasing frequen-cies, fluid viscosity drops significantly (see Table 1), and hence fluidinertiabecomesaninsignificantfactorinthedynamicsofthe flow.However, thechangeoffluidcharacteristicsmightallowthe pulsatile fluid signal to travel at a higher speed in the axial di-rection,andhence,thedrop inphase betweenpressureand PPG signalsmightnotbe duetochangesin wallstiffness. These find-ingshighlight that asthe Ev and the PTT methods were able to
detectchanges in arterialstiffness betweenboth models,Ev
pro-videsadirectquantificationofarterialstiffnessandmightprovide betteraccuracyevenatan increasedpumpingfrequencyorstroke volumechanges.
4.2.RemarksontheoriginofthePPG
ItisusuallyknownthatthePPGsignalbehavesinverselyin re-lationtobloodpressureanditshouldbeinvertedtocorrelate pos-itivelywiththebloodvolume.Recently, Teplovetal.reportedthe coexistenceoftwo mutuallyinvertedsignalsinadjacentlocations
[59].Thisbehaviourwasalsoobservedinthisinvestigation,as in-vertedsignalswereobservedalong thesametubeindifferent lo-cations, andit is possibly related to the sensor contactpressure duringthewallmovement orthedirectionoftheflow. Neverthe-less,thisissuedoesnotaffecttheamplitudeorthemorphologyof thesignal andisnotthemainconcernofthiswork.Toavoidany errorsrelatedto theinversionofthePPGsignal,thesignalswere normalisedtocorrelatewiththebloodpressuresignal.AsPPGand pressuresignalswererecordedsimultaneously,thepeakofthePPG signal was determined in relation to the pressure peak in each cycle.
Finally,thisstudyhighlightsthesuitabilityof photoplethysmog-raphyto providea normalisedmeasureofvolumeandhence vol-umetricstrain.Recentstudieshavehighlighted thedependencyof PPGonwallelasticityandsuggestedthatthesourceofmodulation ofthePPGistheelasticdeformationsofthedermisasan alterna-tivemodelofthelightmodulation,notthearterialblood volumet-ric changes. Infact, thistheory sheds light on theimportance of wallelasticityintheformationofthePPG,however,itdismissesa majorfactorintheformationofthePPGwhichisfluidvolumeand radialstresses.ThisstudydirectstheattentiontoconsiderthePPG asstrainvolumetricchanges,ameasuredependentonwall elastic-ityandradialstresses.Radialstressesareaffectedbythe momen-tum ofthe fluid (e.g. changing pumping frequency) andby fluid inertia(e.g.theeffectofstrokevolumes).Inordertofurtherstudy the PPG signal, factors affecting the volume elastic modulus and transmuralpressuresmustbeconsidered.
4.3. Studylimitations
Our study confirms the capability of both PPG and pressure signals to provide an accurate and direct measure of AS by Ev
quantification.Nevertheless,thestudyincurssomelimitationsthat needtobeconsideredbeforeitcanbeappliedinaninvivo inves-tigation.
Themainlimitationisthenatureofthestudy,meaninginvitro. Thedevelopedinvitromodelwasonlyatooltoprovideaproofof concept,hence,onlythearterialcomponentofthesystemwas pre-sentedandthecompliance,singlediameterandbloodoxygenation arelimitingfactors.PPGsignalsobtainedinvivowillcontain phys-iological information related to respiration, temperature changes, nitricoxiderelease,vasoconstrictionanddilation,amongstothers. Hence, an effectiveand systematic PPG decompositiontechnique togetherwithrigorousinvivostudieswillberequiredinorderto isolate and account the contributions of such parameters on the PPGsignal.
The basic assumption for the derivation equations considers thefluidasconstitutesandnon-scatteringhomogeneous medium. However, this presumption is not validfor blood suspension be-cause the light interaction through the suspension is caused by absorption,aswellasscatteringevents[60].Nonetheless,the evi-denceisaccumulatingthatBeer-Lambert’slawcanbeextendedto a lightscatteringsystem[61].The derivationcan be expandedto considersuchfactors.
Thefactorswhichcanviolatethedirectlyproportional relation-shipbetweenVowerenotinvestigatedexperimentallyinthisstudy (c and
ε
). Yet,during an in vivo setup,ε
is constant within and between subjects dueto the fixed absorption coefficientsof oxy anddeoxyhaemoglobin atthespecificwavelength.Inrespecttoc, hematocritchangesareexpectedtobeonlyafewpercentdifferent duetochangesinneurohormonalfactors.Oneofthelimitationsofthisstudyisalsotheuseofaninvasive pressuremeasurementmethodviaacatheter transducer.We sug-gestthe utilisationofemergingreal-time andnon-invasive meth-ods forblood pressuremonitoring (i.e.Finapres, CNAP orNexfin) toovercomethislimitation.
5. Conclusion
Inthismanuscript,wedemonstratedthecapabilityofthePPG to providea measure ofvolumetric strain throughNVS, whichis utilisedtomeasureEvasapotential methodfordirect
quantifica-tion ofarterial stiffness. We haveevaluated our methodin an in vitro modelofa healthy artery andanotherofan artery affected with ATH. We further explored our method under conditions of increasedstroke volumesandpulsefrequencies. Experimental re-sultsareinstrongagreementwiththegoldstandardmeasurement of Ev.The study provides a proof of concept fordirect
measure-mentofASundersimulatedconditionsforhypotensive, normoten-siveandhypertensivescenariosandpavesthewayforapotential
in vivo non-invasive andcontinuous method for direct measure-mentofEvusingPPG.
References
[1] MembersAF,etal.Europeanguidelinesoncardiovasculardiseaseprevention inclinicalpractice(version2012).Eur.HeartJ.2012;33(13):1635–701.
[2] CavenderMA,etal.Impactofdiabetesonhospitalizationforheartfailure, car-diovascularevents,anddeath:outcomesat4yearsfromtheREACHregistry.
Circulation,p.CIRCULATIONAHA.2015;114:014796.
[3] DaviglusML,GAT,Avilés-SantaM,etal.Prevalenceofmajorcardiovascular riskfactorsandcardiovascular diseasesamonghispanic/latinoindividualsof diversebackgroundsintheunitedstates.JAMA2012;308(17):1775–84.
[4] O’RourkeMF,StaessenJA,VlachopoulosC,DuprezD,érardG,PlanteE. Clin-icalapplicationsofarterialstiffness;definitionsandreferencevalues.Am.J. Hypertens.2002;15(5):426–44.
[5] deOAlvimR,etal.Impactofdiabetesmellitusonarterialstiffnessina rep-resentativesampleofanurbanBrazilianpopulation.Diabetol.Metab.Syndr. 2013;5(1):45.
[6] SafarME,LevyBI,Struijker-BoudierH.Currentperspectivesonarterial stiff-nessandpulsepressureinhypertensionandcardiovasculardiseases. Circula-tion2003;107(22):2864–9.
[7] RehillN,BeckCR,YeoKR,YeoWW.Theeffectofchronictobaccosmokingon arterialstiffness.Br.J.Clin.Pharmacol.2006;61(6):767–73.
[8] ZebekakisPE,etal.Obesityisassociatedwithincreasedarterialstiffnessfrom adolescenceuntiloldage.J.Hypertens.2005;23(10):1839–46.
[9] DeGrootE,etal.Measurementofarterialwallthicknessasasurrogatemarker foratherosclerosis.Circulation2004;109(23):III33–8.
[10] CeceljaM,ChowienczykP.Roleofarterialstiffnessincardiovasculardisease. JRSMCardiovasc.Dis.2012;1(4):11.
[11] WentzelJJ,etal.Extensionofincreasedatheroscleroticwallthicknessintohigh shearstressregionsisassociatedwithlossofcompensatoryremodeling. Cir-culation2003;108(1):17–23.
[12] MatsushimaY, etal. Relationship ofcarotidintima-media thickness, pulse wavevelocity, and ankle brachial indextothe severity ofcoronary artery atherosclerosis.Clin.Cardiol.2004;27(11):629–34.
[13] LeeRT,SchoenFJ,LoreeHM,LarkMW,LibbyP.Circumferentialstressand matrixmetalloproteinase1inhumancoronaryatherosclerosisimplicationsfor plaquerupture.Arterioscler.Thromb.Vasc.Biol.1996;16(8):1070–3.
[14] ChengGC,LoreeHM,KammRD,FishbeinMC,LeeRT.Distributionof circum-ferentialstressinrupturedandstableatheroscleroticlesions.Astructural anal-ysiswithhistopathologicalcorrelation..Circulation1993;87(4):1179–87.
[15] DuprezDA.Isvascularstiffnessatargetfortherapy?Cardiovasc.DrugsTher. Spons.Int.Soc.Cardiovasc.Pharmacother.2010;24(4):305–10.
[16] JanicM,LunderM,SabovicM.Arterial stiffnessandcardiovascular therapy. Bio.Med.Res.Int.2014;2014:e621437.
[17] Njoum H, Kyriacou PA. Photoplethysmography for the assessment of haemorheology.Sci.Rep.2017;7(1):1406.
[18] Njoum H, Kyriacou PA. Photoplethysmography for an independent mea-sureof pulsatilepressure under controlled flow conditions.Physiol. Meas. 2017;38(2):87.
[19] TanakaG,etal.Anovelphotoplethysmographytechniquetoderive normal-izedarterialstiffnessasabloodpressureindependentmeasureinthefinger vascularbed.Physiol.Meas.2011;32(11):1869.
[20] Clarenbach CF, et al. Comparison of photoplethysmographic and arterial tonometry-derivedindicesofarterialstiffness.Hypertens.Res.Off.J.Jpn.Soc. Hypertens.2012;35(2):228–33.
[21]Bortolotto LA, Blacher J, Kondo T, Takazawa K, Safar ME. Assessment of vascularaging and atherosclerosisin hypertensivesubjects: second deriva-tive ofphotoplethysmogram versus pulsewave velocity. Am. J. Hypertens. 2000;13(2):165–71.
[22] SeveringhausJW. Takuoaoyagi:discoveryofpulseoximetry.Anesth.Analg. 2007;105(6S):S1–4Suppl.
[23] NijboerJA,DorlasJC,MahieuHF.Photoelectricplethysmography–some funda-mentalaspectsofthereflectionandtransmissionmethod.Clin.Phys.Physiol. Meas.1981;2(3):205–15.
[24]KyriacouPA.Directpulseoximetrywithintheesophagus,onthe surfaceof abdominalviscera,andonfreeflaps:.Anesth.Analg.2013;117(4):824–33.
[25]ShelleyKH.Photoplethysmography:beyondthecalculationofarterialoxygen saturationandheartrate.Anesth.Analg.2007;105(6):S31–6.
[26]Lindberg LG, Tamura T, ÖbergPP˚A.Photoplethysmography. Med.Biol. Eng. Comput.1991;29(1):40–7.
[27]KamalAAR,HarnessJB,IrvingG,MearnsAJ.Skinphotoplethysmography— a review.Comput.MethodsProgramsBiomed.1989;28(4):257–69.
[28]D’AgrosaLS,HertzmanAB.Opacitypulseofindividualminutearteries.J.Appl. Physiol.1967;23(5):613–20.
[29]SommermeyerD,SchwaiboldM,SchöllerB,Grote L, HednerJ,BolzA. Pre-diction of cardiovascular risk from peripheral pulse wave. In: Dössel O, SchlegelWC,editors.ProceedingsoftheWorldCongressonMedicalPhysics andBiomedicalEngineering.Springer;2009.p.891–2.
[30]Njoum H. Investigation offinger reflectance photoplethysmography in vol-unteers undergoing a local sympathetic stimulation. J. Phys. Conf. Ser. 2013;450(1):012012.
[31] Ruiz-Rodríguez JC, et al. Innovative continuous non-invasive cuffless blood pressure monitoring basedon photoplethysmography technology. Intensive CareMed2013;39(9):1618–25.
[32]BuclinT,Buchwalder-CsajkaC,BrunnerHR,BiollazJ.Evaluationof noninva-sivebloodpressurerecordingbyphotoplethysmographyinclinicalstudies us-ingangiotensinchallenges.Br.J.Clin.Pharmacol.1999;48(4):586–93.
[33]TengXF,ZhangYT.Continuousandnoninvasiveestimationofarterialblood pressureusingaphotoplethysmographicapproach.In:Proceedingsofthe25th AnnualInternationalConferenceoftheIEEEEngineeringinMedicineand Bi-ologySociety,4;2003.p.3153–6.
[34]Nakajima K, Tamura T, MiikeH. Monitoringof heartand respiratory rates byphotoplethysmographyusingadigitalfilteringtechnique.Med.Eng.Phys. 1996;18(5):365–72.
[35]Alian AA, Shelley KH. Respiratory physiology and the impact of differ-ent modes ofventilationonthe photoplethysmographicwaveform. Sensors 2012;12(2):2236–54.
[36]Pannier BM, Avolio AP, Hoeks A, Mancia G, Takazawa K. Methods and devices for measuring arterial compliance in humans. Am. J. Hypertens. 2002;15(8):743–53.
[37]NaiduMUR,ReddyBM,YashmainaS,PatnaikAN,RaniPU.Validityand repro-ducibilityofarterialpulsewavevelocitymeasurementusingnewdevicewith oscillometrictechnique:apilotstudy.Biomed.Eng.OnLine2005;4:49.
[38]Jerrard-DunneP,MahmudA,FeelyJ.Ambulatoryarterialstiffnessindex,pulse wavevelocityandaugmentationindex– interchangeableormutuallyexclusive measures?:.J.Hypertens.2008;26(3):529–34.
[39]Nürnberger J, Keflioglu-ScheiberA, OpazoSaez AM, Wenzel RR, Philipp T, SchäfersRF.Augmentationindexisassociatedwithcardiovascularrisk.J. Hy-pertens.2002;20(12):2407–14.
[40]Rajzer MW, Wojciechowska W, Klocek M, Palka I, Brzozowska-Kiszka M, Kawecka-Jaszcz K. Comparison ofaortic pulsewave velocity measured by three techniques: Complior, SphygmoCor and Arteriograph. J. Hypertens. 2008;26(10):2001–7.
[41]MiyataniM,MasaniK,OhPI,MiyachiM,PopovicMR,CravenBC.Pulsewave velocityforassessmentofarterialstiffnessamongpeoplewithspinalcord in-jury:apilotstudy.J.SpinalCordMed.2009;32(1):72–8.
[42]Millasseau SC, Ritter JM, Takazawa K, Chowienczyk PJ. Contour analysis ofthe photoplethysmographicpulsemeasured atthe finger:. J. Hypertens. 2006;24(8):1449–56.
[43]Takazawa K, et al. Assessment of vasoactive agents and vascular aging by the second derivative of photoplethysmogram waveform. Hypertension 1998;32(2):365–70.
[44]ObataY,etal.Theeffectsofhemodynamicchangesonpulsewavevelocityin cardiothoracicsurgicalpatients.BioMedRes.Int.2016;2016.
[45]NürnbergerJ,DammerS,OpazoSaezA,PhilippT,SchäfersRF.Diastolicblood pressureisanimportantdeterminantofaugmentationindexandpulsewave velocityinyoung,healthymales.J.Hum.Hypertens.2003;17(3):153–8.
[46]KamoiS,etal.Relationshipbetweenstrokevolumeandpulsewavevelocity. IFAC-Pap2015;48(20):285–90.
[47]SteppanJ,BarodkaV,BerkowitzDE,NyhanD.Vascularstiffnessandincreased pulsepressureintheagingcardiovascularsystem.CardiologyRes.Pract.2011. [Online].Availablehttps://www.hindawi.com/journals/crp/2011/263585/ [Ac-cessed:10-Nov-2017].
[48]Zureik M, et al. Carotid plaques, but not common carotid intima-media thickness, are independently associated with aortic stiffness.J. Hypertens. 2002;20(1):85–93.
[49]ZamirM.ThePhysicsofPulsatileFlow.Springer;2000.
[50]SawadaY,TanakaG,YamakoshiK.Normalizedpulsevolume(NPV)derived photo-plethysmographically asa morevalid measureofthefingervascular tone.Int.J.Psychophysiol.2001;41(1):1–10.
[51]Oliver JJ, WebbDJ. Noninvasiveassessmentofarterial stiffness andrisk of atheroscleroticevents.Arterioscler.Thromb.Vasc.Biol.2003;23(4):554–66.
[52]AggounY,SzezepanskiI,BonnetD.Noninvasiveassessmentofarterialstiffness andriskofatheroscleroticeventsinchildren.Pediatr.Res.2005;58(2):173–8.
[53]AlexanderRW.Hypertensionandthepathogenesisofatherosclerosisoxidative stressandthemediationofarterialinflammatoryresponse:anewperspective. Hypertension1995;25(2):155–61.
[55]Mattace-RasoFUS,etal.Arterialstiffnessandriskofcoronaryheartdisease andstroketherotterdamstudy.Circulation2006;113(5):657–63.
[56]HollanderW.Roleofhypertensioninatherosclerosisandcardiovascular dis-ease.Am.J.Cardiol.1976;38(6):786–800.
[57]GiannattasioC,etal.Effectsofheartratechangesonarterialdistensibilityin humans.Hypertension2003;42(3):253–6.
[58]WilkinsonIB,MacCallumH,FlintL,CockcroftJR,NewbyDE,WebbDJ. The influenceofheartrateonaugmentationindexandcentralarterialpressurein humans.J.Physiol.2000;525:263–70.
[59]TeplovV,NippolainenE,MakarenkoAA,GiniatullinR,KamshilinAA. Ambigu-ityofmappingtherelativephaseofbloodpulsations.Biomed.Opt.Express 2014;5(9):3123.
[60]FriebelM,RogganA,MüllerG,MeinkeM. Determinationof optical proper-tiesofhumanbloodinthespectralrange250to1100nmusingMonteCarlo simulationswithhematocrit-dependenteffectivescatteringphasefunctions.J. Biomed.Opt.2006;11(3):034021.