Rochester Institute of Technology
RIT Scholar Works
Theses
Thesis/Dissertation Collections
4-1-1980
Halftone Dot Method for Image Evaluation of
High-Resolution Films Applied to Vesicular Film
Mark Gulden
Follow this and additional works at:
http://scholarworks.rit.edu/theses
This Thesis is brought to you for free and open access by the Thesis/Dissertation Collections at RIT Scholar Works. It has been accepted for inclusion in Theses by an authorized administrator of RIT Scholar Works. For more information, please [email protected].
Recommended Citation
HALFTONE DOT METHOD FOR IMAGE
EVALUATION OF HIGH-RESOLUTION
FILMS APPLIED TO VESICULAR FILM
by
Mark P. Gulden
A thesis submitted in partial fulfillment
of the requirements for the degree of
Bachelor of Science in the School of
Photographic Arts and Sciences in the
College of Graphic Arts and Photography
of the Rochester Institute of Technology
Apri I ' 1980
Mark P. Gulden
Signature of the Author ...
.
Photographic Science
and Instrumentation
Name Illegible
Certified by ... .
Thesis Adviser
J.
F. Carson
HALFTONE DOT METHOD FOR IMAGE
EVALUATION OF HIGH-RESOLUTION
FILMS APPLIED TO VESICULAR FILM
by
Mark P. Gulden
Submitted to the
Photographic Science and Instrumentation Division
in partial fulfillment of the requirements
for the Bachelor of Science degree
at the Rochester Institute of
Technology
ABSTRACT
A feasible technique for
deriving
the spread function andmodulation transfer function of a vesicular film has been determined.
This technique is based on a method described
by
R. Byer which doesnot require the use of a microdensitometer, but only that of a "macro"
densitometer. The method utilizes the fact that a halftone dot will change in size as a function of exposure. The spread function of the
vesicular film was approximated with a mathematical model. The results,
although favorable in many ways, are not conclusive. Some of the
advantages and disadvantages associated with this technique as applied
ACKNOWLEDGEMENTS
I would like to thank my adviser, R.
Byer,
for all of his guidanceand encouragement. A special thanks goes to my wife,
Barbara,
for herassistance in the lab and with the art work.
And,
I am grateful to S.Harding
for her typing. I would also like to thank Xidex CorporationTABLE OF CONTENTS
INTRODUCT ION 1
OBJECTIVE 12
EXPERIMENTAL 13
RESULTS 21
ANALYS IS 37
CONCLUS ION
43
INTRODUCTION
Vesicular photography is a relatively new photographic process
in terms of commercially successful
imaging
systems. The KalvarCorporation,
first in the production of vesicular film for commercial use, began its operation in the late 1 950'
s.
Today
there areonly two major producers of vesicular films- Xidex Corporation and
3M Corporation.
Vesicular photography has many uses in micrographics, but the
majority of the film used today is for
duplicating
COM(Computer
Output Microfilm).^ Another important
use is in the area of micro
film information storage and retrieval systems. L2
Vesicular films are low speed, ultra-violet sensitive, and
heat developed. The film consists of a polyester film
base,
usuallyMylar,
coated with a thin plastic polymer containing the radiationsensitive diazonium salt. Upon exposure to UV radiation, nitrogen
gas is released from the diazonium molecule. The nitrogen gas is
entrapped in the plastic polymer for a short period.3 This is in
effect the "latent image". The film must be developed
by heating
within this short period before the nitrogen gas diffuses out of
the film. The diffusion rate may range from one-half second to
ten minutes before a noticeable change is observed in the charac
teristic curve. Development temperatures can vary from 230F to
350F and dwell times vary from 0.1 to 1.4 seconds. Caution
must be taken in adjusting the development temperatures as found
toe
density,
as well as giving the film a brown color in the viewerdue to light scatter from small size vesicules. Overdevelopment
will produce image decomposition in the higher densities and a loss
in resolution. The
heating
process causes the nitrogen gas toexpand and form microscopic vesicules. These vesicules have an index
of refraction different from that of the surrounding medium causing
the light to scatter. The light scattering vesicules can vary in
9 9
size from 0.5 to 2.0 micrometers in diameter. ' '
The film can
be fixed
by
an overall exposure to UV radiation without development.The nitrogen gas is then allowed to diffuse out of the film.
Because vesicular films scatter light rather than absorb light
to form its
image,
diffusedensity
is relatively low.Measuring
density
in the way in which the film is used, i.e. projection density, will produce densities between 2.0 and 3-0. The projection
density
obtained is a factor of lens aperture of the projectionsystem.
Vesicular photography,
being
a relatively new photographicsystem, and the fact that limited literature is available on the
image characteristics demonstrates the need for research in this
area. Rabedeau stated that the
macro-and microimage character
istics of Kalvar film differ considerably from those of silver
7
halide photographic materials. Because of the scattering effect,
the vesicular material mi crodensitometry is more difficult to per
form. The scattered light is reflected off the metal surfaces with
flare causing erroneous results.
It was also found that the
density
of a given sample variesas a function of the size of the area of the sample illuminated. At
high
densities, doubling
the narrow presilt widths reduces the density
by
0.25. It was concluded that this effect was due to scattering within the layer.
Noting
this relationship ofdensity
as afunction of illumination in adjacent areas, Rabedeau postulated
that
density
of adjacent areas would affect measurements of a givenarea uniformly illuminated well beyond the image area. He called
this
"viewing
adjacency"effect. There is an additional problem
with microdensitometry of high resolution vesicular
films,
that isthe resolution limits of the optical system. The optics used in
conven-o
tional microdensitometry are limited to about 200 to 250 cycles/mm.
9 10 There are better techniques with higher resolution capabilities, '
but these systems are designed to handle silver halide products.
Also these newer systems are expensive and not readily available.
Therefore,
the use of a more conventional microdensitometer forderiving
the spread functions of high resolution images will resultin erroneous output data above 250 cycles/mm. A system is needed
which will eliminate the uncertainties and provide reliable, con
sistent output. The output should also be free of any transfer
characteristics of the measuring instrument.
There has been a great deal of discussion thus far concerning
the microcharacteri sties of vesicular film and the
diffuculty
indetermining
these characteristics. The question may be raised asand modulation transfer characteristics of the film in order to
describe the microcharacteri stics. An industrial customer, al
though he may not realize
it,
isdealing
with the film's spreadfunction everyday. The spread
function,
as the customer viewsit,
is composed of two elements. The first is the scattering and
reflecting of the light that takes place within the film due to the
fundamental characteristics of the film. The customer has no
control over this element. The second element concerns the
spreading of the light as a function of exposure, or simply
stated, exposure latitute. Image size will vary with exposure
(e.g.
increasing
exposure will cause an increase in the imagesize).
(See
photographs)Exposure Xidex SX High Contrast Film
IX
2X
3X
4X
F234E
0
HHS
\
.DM0803 .PUISY2
R
XOEMPLT
_ _
HCI
ft
VCD
Y
JCS
psam _ . -= ~ '~
tCtlVIO
|T
JCt
Print 1
-Photographs of a microfiche exposed at 4 exposure levels onto
Xidex SX high contrast film.
(Magnification
approx.400X)
If this relationship of the scattering of light versus exposure
is
known,
it would be possible to determine the exact image dimensions for a particular exposure.
Therefore,
exposure limits canin which the vesicular films are most used are information storage
and retrieval, and COM
(Computer
Output Microfilm). Both of these systems require tight limits on image
dimensions,
hence an understanding ofthe spread function would be an asset.
The understanding of the film's spread function is important
in yet another way. Film speed can change for various reasons
(e.g.
aging, variations in the manufacturing of thefilm,
storage etc.). With knowledge of the spread
function,
speed changescan be calculated
by
a simple measurement of the image dimensions.Clearly
then, there is a need to find a feasible techniquefor
determining
the spread function of the vesicular film.A method is described
by
R. J. Byer in which the spreadfunction of high resolution films can be determined without
using mi crodensitometry. The problems in using the microden
sitometer are therefore removed. This method has been used with
silver halide films and found to be successful. There is reason
to believe that this technique could be applied to vesicular
f i lms.
12
Byer's method is based on a technique devised
by
Goldberg.The idea is that the image size will increase as a function of
increasing
exposure. If the image spread can be measured atvarious exposure
levels,
then essentially the spread function hasbeen determined.
All photographic materials are turbid to a greater or lesser
degree. Radiation striking the sensitized layer will be scattered
of radiation is also caused
by
emulsion-base and base-air reflections. The turbidity of the emulsion and inter-layer reflections
of radiation within the film are the two parameters that describe
the spread function.
In Byer's system, the spreading of light is measured using
a "hard-dot" halftone tint. The tint is contact printed onto a
film in a vacuum frame. As the exposure
increases,
the spreadingof the dot image also increases to produce a
"soft",
unsharp dot.The unsharp dot image must be made sharp. This is accom
plished
by
contact printing the testfilm,
"soft" dotimage,
ontoa high contrast film using a constant exposure. This exposure is
determined such that a high contrast film image of the vesicular
film image of the measuring tint will produce a dot radius equal
to that of the measuring tint. Said differently, the image of
the measuring tint on the vesicular film has one exposure level
in which the measuring tint dot is exactly reproduced. When the
vesicular image at this exposure level is contact printed onto
the high contrast
film,
the exposure given to the high contrastfilm is adjusted so that this dot is again exactly reproduced.
This will ensure that all dots are made "hard" in the same way.
Because the high contrast film exposure remains constant, the
dot radii of the test film as a function of exposure can be com
pared. The assumption here is that the exposure given to the high
contrast film is adjusted to lie on the straight-line portion of
the characteristic curve. Because the straight-line portion of
is needed, the effect of the high contrast film is nulled out.
Densities of the halftone image on the high contrast film
are measured with a densitometer using an aperture of two mi 1 1 i
meters or larger.
Knowing
thedensity
at each exposurelevel,
dot radii can be computed with the
following
relation:R =
transmittance of high contrast film X
unit area tint
if
2, where
1,-rDensity ,.
transmittance =10 'or percent area of clear dot
unit area of tint = the area of a 100
percent dot
(for
a 150 lines/inch screen, the unit area is 28,674yu.m)
Once the radii of the dots have been determined at various
exposure
levels,
a dot spread curve can be generated. Silverhalide films have a linear increase in image spread
(increase
in1>
dot radii) with the logarithm of the exposure. This would in
dicate an exponential decrease of the scatter of light around the
image site. With this dot radii versus exposure technique, it
is possible to measure a change in dot radii of about 0.6/ym.
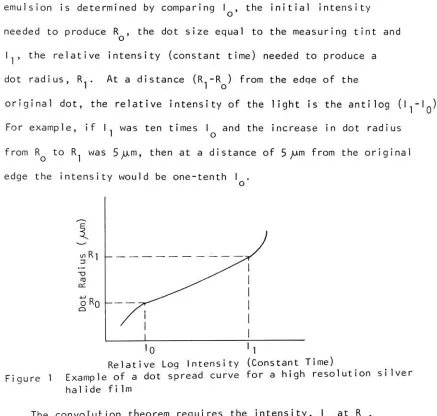
Figure 1 shows an example of a dot spread curve for a high resolu
tion silver halide film.
Using
this dot spread curve, it is possible to determine theedge spread function. Because the dots receive the same exposure
on the high contrast
film,
all the dots must have the samedensity
emulsion is determined
by
comparing I , the initialintensity
needed to produce R , the dot size equal to the measuring tint and
k,
the relativeintensity
(constant
time) needed to produce adot radius, R. . At a distance
(R--R
)
from the edge of thel 1 o
original
dot,
the relativeintensity
of the light is the antilog(k-L).
For example, if
I,
was ten times I and the increase in dot radiusI o
from R to R was
5jmm,
then at a distance of 5 /^m from the originaledge the
intensity
would be one-tenth I .Relative
Log
Intensity
(Constant Time)Figure 1 Example of a dot spread curve for a high resolution silver
hal ide film
The convolution theorem requires the
intensity,
I atRQ,
the original edge to be one-half the incident
intensity,
L^-I =1 II
O -oo
To generate a curve of relative
intensity
versus distance froman edge, which is the spread function curve, is a simple matter.
The relative
Log
exposure is converted to relativeintensity,
remembering that I =l_oo/2, and !t is then Plotted against the
[image:13.520.39.476.57.473.2]Rq
is much larger thand,
the increase in dot radius, theintensity
distribution at the dot's edge can be approximatedby
theedge spread function. Because the edge spread function is sym
metrical, only half of the function need be examined.
1Q-d/r
'd^'-oo
2=
ec'9e sPread function
The line spread function is the differential of the edge spread
function with respect to d.
2-3 in_d/r ,
j r
j 10 = line
spread function
It follows
directly
that the integral of the line spread functionmust equal the edge spread function.
'd
f>
V'-co
~\
-'^S/r ds
(See
Appendix I forderivations)
where
d = distance from the
original edge
s = distance from the
infinitely
narrow slitr =
change in distance
(radius)
for a 10X change in exposureI = incident
intensity
14 15
According
to H. Frieser andByer,
the spread function ofa silver halide film is composed of two major components. One
part
being
the slightly diffused light scatteredby
the grainsand the other part due to the scattering
by
the base. Frieser'sapproximation for the spread function which was modified
by
Byer10
V'-ocT
P10"d/r1 + (l-p)l0"d/r2
2
where
^
and r are the "one-tenth widths"of the
intensity
distributions of the two types of scattering and p indicates
the relative contribution of r- type scatter of light scattered. Frieser used
k,
andByer,
in his modified equation, set k=2r. Frieser made his images from a line and measured changes in linewidth, where in Byer's technique, the change in dot radius is measured. It must now be emphasized, that this is the theory and equation that describe silver halide films. Frieser has listed several other equations that could approximate the spread
func-, . ,.. 14
tion for various films.
Modulation transfer function curves can be derived
by
takingthe Fourier transform of the spread function. The modulation trans
fer function for Frieser's approximation to the spread function is given as fol lows:
M. P
(1-p)
Mo
1 +(.002iT
1+(
.0021T r?0 12. 3)2where M. is the modulation of the input
frequency,
M is themodulation of the output
frequency,
r. and r are the "one-tenthwidths", p is the relative contribution of r type scattering, and
~v is the
frequency
in cycles/mm.Byer's procedure for
deriving
spread functions and consequently modulation transfer curves for film is an easy, inexpen
11
would allow the vesicular film users to determine transfer char
12
OBJECTIVE
The objective of this study is to test the hypothesis that R.J,
Byer's halftone dot method is a feasible technique which could be
13
EXPERIMENTAL
The basic design of the experiment is described in the intro
duction. The technique which Byer used will be modified and tested
for UV sensitive vesicular films.
The first step to be taken was to make some sensitometric
tests on the vesicular film. There are three important characteristics
that must be determined for the vesicular film in order to apply the
halftone dot technique effectively;
(l)The
maximum and minimum diffusedensities must be known.
(2)The
effects of varyinglag
time(time
between
initializing
exposure anddeveloping
thefilm)
must be determined.
Investigating
the effects oflag
time is essentially measuringfor any reciprocity law failure which is caused
by
loss ofdensity
dueto diffusion of nitrogen gas from the emulsion.
(3)The
spectral sensitivity of the film must be known. The vesicular
film,
as mentionedearlier, forms an image
by
scattering light rather than absorbinglight.
Therefore,
its diffusedensity
is very low. The Dmax and Dmindensities are 0.45 and 0.15 respectively. The effect of
lag
time wasdetermined
by
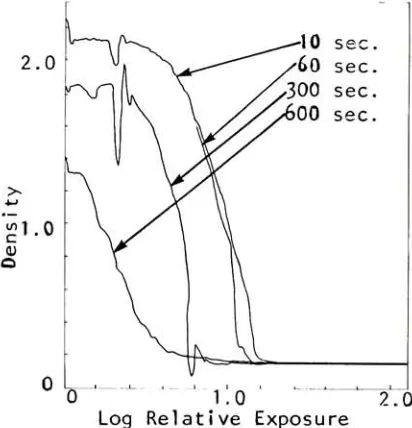
making a series of constant time exposures(45
seconds).The
intensity
was modulated with a continuous tonedensity
wedge sothat the specular
density
could be measured on the Quantascan and compared
(Figure
2). This demonstrates that alag
time of about two minutes or less will not have a noticeable effect on reducing the densities,
At about six minutes there is a change in the Dmax
densities,
but thecurve shape remains the same. The spectral sensitivity of the film was
provided
by
the manufacturer. The sensitivity range for Xidex SX high14
10 sec.
60 sec.
300 sec.
00 sec.
0 1.0 2.0
Log
Relative ExposureFigure 2
Lag
time betweeninitializing
exposure and processing theQuantascan traces of vesicular film were made with a
f/4.5
aperture setting
with maximum sensitivity at 405nm.
The Atlantic Printer was used to make all exposures on the vesi
cular film. The Atlantic Printer is a UV contact printer. Its
source is a mercury vapor
lamp,
and it employs a vacuum frame easel.The vacuum frame is necessary with the halftone dot technique, because
intimate contact is needed between the film layers.
The processor used for
developing
the film was the Kalvar 160Processor. This processor operates
by
pulling the film over a hotplaten. The film dwell time is approximately two seconds. The
platen temperature is 25020" F.
It was observed that the
density
over a sheet of film was notuniform. Film exposed and processed
by
Xidex Corporation demonstratedthe same non-uniformities. Therefore it was concluded that this was
an inherent problem with Xidex film. The Eastman Kodak vesicular film
[image:19.520.115.321.31.245.2]15
The second step deals with
finding
a high contrast film that willfit the
following
requirements:(l)The
high contrast film must producea
density
range of approximately 2.00 over alog
exposure range ofapproximately 0.35 and remain on the straight-line portion of the DLogE
curve.
(2)The
film must produce this high contrast index using a continuous tone rather than a litho
(infectious)
developer. The infectiousdeveloper is not used because it will cause nonl inearities in the
Log
Exposure-Density
response. Three films were tested- DupontCRF,
DupontC0S-4,
Dupont BLC film. The Dupont CRF film had a contrast index ofapproximately 8 when developed in Eastman Kodak D
19 developer for six
minutes at 68F. The contrast index was obtained
by locating
the pointon the characteristic curve .10 above base plus fog. Then a straight
line 2.0
Log
Exposure units in length is drawn from the point .10above base plus
fog
to the point where it intersects the Curve. Theslope of this line is the contrast index. In this way the CRF film
fulfills both requi rements.The C0S-4 and BLC did not meet the requirements.
The dot size and distance separating the dots determines the sensi
tivity and reliability of the measurements. Small dots with small dis
tances between them means very small changes in dot size can be detect
ed. Larger
dots,
spaced further apart gives more reliability. A95%,
150
lines/inch,
photographic silver screen was felt to be a goodcompromise of sensitivity and reliability. The reason a
35%,
150lines/
inch tint was chosen, rather than one where the dots Were smaller and
closer together was because the spread function of the film may have
been to wide. This would have meant that the dots would have overlapp
16
work with any commercial film.
The modulator used throughout the experiment was a Carbon-M type,
square-root of two-stepped wedge. Because the carbon particles in the
stepped wedge are at a distance many times their diameter away from
the vesicular emulsion, the stepped wedge will have little affect on
the spreading of light in the vesicular film.
The vesicular film and measuring tint are placed emulsion to emul
sion. The carbon-M wedge is then placed over the measuring tint and
film and put inside the vacuum frame. It is also necessary to have a
Dmin and Dmax area on the film. It was found that a two minute, fif
teen second exposure time was required to obtain a range of exposure
levels,
which would include an exposure that is ten times the exposureneeded to reproduce the measuring tint dot exactly.
Two problems occurred, one of which was overcome and the other was
determined to be negligible. The first problem was one that is common
in vacuum frame
printing-Newton's rings. The vesicular emulsion is
very thin and has very little texture. The step wedge is made
by
laminating two pieces of plastic over the carbon particles. The result of
having
many smooth surfaces together in a vacuum is an excessiveamount on Newton's ring patterns. This problem was overcome
by
using"Anti-Newton's Ring" powder. A fine mist of particles
("Ant
i-Newton'sRing"
powder) of approximately 10yum in diamter was sprayed onto the
measure tint and step wedge. A very small amount of the powder was
used, in that the average distance between particles was many times
the diamter of the dots on the measuring tint.
remove the
dust,
e.g. blow it off with a high pressure stream of air,brush it off with an anti-static
brush,
an anti-static film cleaningsolution was also tried; but nothing seemed to work. The Anti-New
ton's
Ring
powder was not the cause of thedust,
because printing withor without the powder had no effect. It was felt that the dust spots
on the film would effect the
density
measurements,however,
underclose examination the total area of dust spots were a small percentage
of the dot area. The conclusion was made that the dust spot(s) would
have a negligible effect on the measurements.
A tungsten "point" light source was used for making the exposure
onto the Dupont CRF film. The vesicular film image of the measuring
tint was placed emulsion to emulsion with the CRF film in a vacuum
frame. The correct exposure was determined as described in the intro
duction. Should this exposure be
improperly
calculated, the resultswould remain the same except for an addition of a constant term.
This is true as
long
as the exposure has not moved off thestraight-1 ine portion.
An aid used to determine the proper exposure for the CRF
film,
(i.e.
when the dot size of the measuring tint, vesicular film and,CRF film are equivalent) is a microscope with a filar eyepiece. The
filar eyepiece is a microscope eyepiece with a ruled liner and a mov
ing
crosshair.Densities of the CRF film are determined using a MacBeth 504
transmission densitometer with a 2mm stage aperture. The densitom
eter was zeroed on the Dmin, which is produced
by
the Dmax area on18
The non-uniformity of the vesicular
image,
as discussed earlier,were imaged onto the CRF film. This caused large variations in the
density
measurements. The large variance, made it necessary to makereplicates and take many
density
measurements off of each replicate.The
density
measurements were taken over a 0.8 X4.5cm.
rectangle.Each measurement was independent of the other. The
density
measurements for each exposure level on each replicate were summed and the
mean was calculated. These densities were then used to calculate the
dot radius. This calculation is given in the introduction. One modi
fication had to be made to this equation. Because the Dmax is not
opaque, as the equation assumes, the amount of light transmitted
through the
background,
Dmax area, had to be subtracted from the totallight transmitted
by
the sample. A dot spread curve is plotted foreach replicate and a smooth curve is fitted to the data.
The constants
(p,
r.., r_) for the spread function approximationwere derived using the sum of the least square error method.
Twenty
sets of points were taken from the spread function curve of each rep
licate. A computer was used to compare all combinations of ten poss
ible values for each of the three constants. The values for the
con-* The equation for
determining
the radius becomes:R=
A
transmittance of the high contrast film
-transmittance
of the background area
(Dmax
area) X unit area tintFor example, with a
95%,
150 line/inch measuring tint the unit area is27674/^m2. If the
density
of the film is 0.85(i.e.
transmittance =0.14)
and the background Dmax area is opaque(i.e.
transmittance is0.0)
the dot radius is 35.91/<m. If the background Dmax area has adensity
of 2.00(i.e.
transmittance =19
stants were changed and the program was computed again until the best
least square fit was achieved.
It was found that Frieser's Spread Function approximation was a
poor model for this film. Other spread function models were attempted
and the Gaussian curve was found to be the best fit.
The equation
finally
used to approximate the spread function wasa sum of two Gaussians.
(p)e-fl(d/r,)2+
d -oo
The transform fo this equation normalized to one at a
frequency
ofzero is as fol lows:
(p)(
)e-r(.ooirio))2+(]_p)(
M. ' l
I
M0
=
p(r1) +
(1-p)r2
(See
reference 16 for derivation)where again r and r are the "one-tenth widths"
of the two major
types of scatter measured in /j.m, p is the contribution of r. type
scattering, d is the distance from the edge, and %> is the
frequency
in cycles/mm.
Five sets of experiments were made, according to the techniques
which were just described.
1
)
ThIs first experiment was to test the system for a film with aknown MTF. Kodak Recordak
AHU 5460
(silver
halide) film tested.20
minute fifteen second exposure was used to expose the vesicular film.
A one minute exposure was used to expose the CRF film. The "Anti-New
ton's Ring" powder was used in both exposures.
3)Five replicates using Xidex SX high contrast film were made. The same
exposures were used as in Experiment 2. In this experiment no
"Anti-Newton's Ring"
powder was used. This experiment would demonstrate the
effect, if any, that the Newton's Rings might have on the results.
4)Five replicates using Xidex SX high contrast film were made. In this
experiment the exposure given to the vesicular film was varied
by
changing
the time of the exposure rather than the intensity. The exposureto the CRF film was the same as in Experiment 2. The "Ant i-Newton' s
Ring"
powder was used in both exposures.
5)Five replicates using the Eastman Kodak Recordak Thermal Print film
1953 were made. Other than the film change it was the same as in Ex
RESULTS
The basic steps which were followed to obtain the modulation trans
fer
Curve,
after the exposures were made, were the following:1)
Ten independentdensity
readings at each exposure level of each re plicate were taken(The
densitometer was zeroed on the Dmin area producedby
the Dmax area of the vesicular film.).2)
The meandensity
at each exposure of each replicate was determined.3) The dot radius was calculated
(The
background Dmax area was includedin this calculation.).
4)
The data from each replicate was plotted on the dot spread curve.A smooth curve to best approximate the data was drawn.
5)
Spread function curves, were generated from the dot spread curves.6)
Twenty
points from the spread function curve were used to derive the constants(
p, r^, r)
for the spread function model which approximated the actual curve.
7) The constants derived in step 6 were used for the Fourier Trans form of the spread function approximation to determine the modul
ation transfer function.
The figures on the
following
pages are the results of the fiveexperiments that were made. For each
figure,
the three curves represented the mean and two standard deviations. The table is a tabulation of
the constants
(p,
r , r)
which were derived for each replicate.The standard deviations were found
by
plotting the values for allreplicates, then the mean and standard for the values along the "y" axis
were calculated for a particular point along the "x" axis.
An approximation of the spread function curve had to be found in
order to generate a modulation transfer curve. The curve that represents
the average spread function and two standard deviations to this curve
approx-22
imation curves, then taking the mean and standard deviation.
The average of p, r , r , derived from the approximating equation
closely approximated the mean curve which was generated
by
takingthe average of individual points on each replicate's calculatd
spread function.
The modulation transfer curve was generated using the constants
(
p, r- , r)
which were used to approximate the spread function.Figures
(21,22)
are the average spread function and modulationtransfer curve for experiments
2,3,4,
in which the Xidex SX film was23
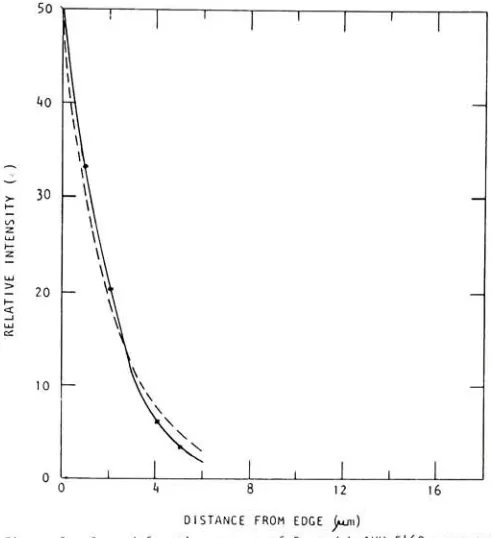
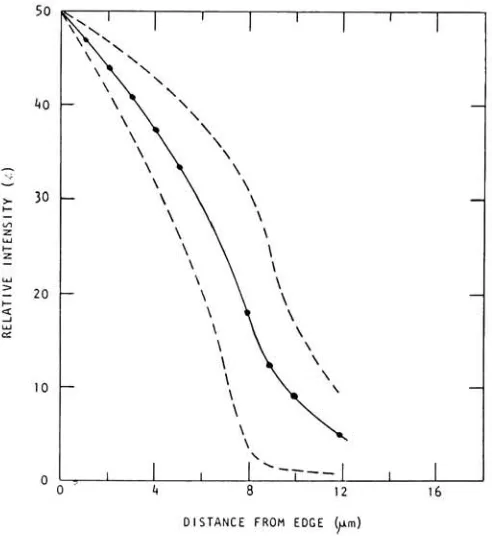
DISTANCE FROM EDGE (m4ii)
Figure 3. Spread function curves of Recordnk AHU 5^60 measured
with halftone dot technique and calculated from
r =f4.5. r?=5.0, and p=.30 using Byer's modified equation.
100
E 10
'
Manufac turer's data
10 100 1*00
SPATIAL FREQUENCY (CYCLES/mm)
Figure *4.
Modulation transfer curves for Recordak AHU 5^60 comparing the edge gradient
[image:28.520.106.352.61.330.2] [image:28.520.58.403.67.632.2]24
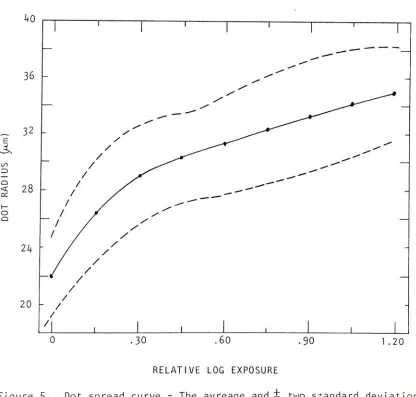
EXPERIMENT 2
Ten replicates using Xidex SX high contrast film were made. A two
minute fifteen second exposure was used to expose the vesicular film.
A one minute exposure was used to expose the CRF film. The
"Anti-Newton's Ring"
powder was used in both exposures.
1 .20
RELATIVE LOG EXPOSURE
Figure 5. Dot spread curve
-The avreage and two standard deviations
[image:29.520.38.454.262.659.2]25
16
DISTANCE FROM EDGE yim)
Figure 6. Spread function curves for Xidex film taking the average of 10 replicates andI two standard deviations measured
from the dot spread curves. (Exp. 2)
DISTANCE FROM EDGE (/4m)
[image:30.520.81.327.61.329.2] [image:30.520.78.324.377.642.2]Table 1
Experiment 2
Repl icates
1 .90 15.0 18.0
2 .90 12.0 2.0
3
.50 15.06.0
4 .90 15.0 3-0
5 90 16.0 12.0
6 70 18.0 14.0
7 .85 14.0 13.0
8 .95 12.0 8.0
9 .80 16.0 18.0
10 70 12.0 11.5
average .81 14.8 10.6
26
100
E io
<
1 ""
I 1 1 1 1JJr r*
~^ ""A
i i II11'!
\
\
\1 1
-\
\
*
-1
\
I: '
\
. 1\
1\
1\
1t
1J J 1 1 1 1 1 i 1 1 1 1 . , 1 1 1
10 100 1*00
Figure
SPATIAL FREQUENCY (CYCLES/mm)
Modulation transfer curves for Xidex film taking the average of 10 replicates and two standard deviations using the constants in Table 1 and the
[image:31.520.117.340.69.274.2] [image:31.520.57.409.325.646.2]27
EXPERIMENT 3
Five replicates using Xidex SX high contrast film were made. The
same exposures were used as in Experiment 2. In this experiment no
"Anti-Newton's Ring" powder was used. This experiment would demon
strate the effect, if any, that the Newton's Rings
might have on the
results.
RELATIVE LOG EXPOSURE
Figure 9- Dot spread curve
-The average and two standard deviations
[image:32.520.37.455.239.647.2]28 50 40 30 20 10
L>
11
\\
\
M i M\ \ 1
1 1 i
-i i
I,, i
i i
i i
1
V
t1
\
v
-\VL
.,1,1,1 i
1
12 16
DISTANCE FROM EDGE ^um)
Figure 10. Spread function curves for Xidex film taking the average of 5 replicates andi two standard deviation measured
from the dot spread curves. (Exp. 3)
50 40 30 ^ 20 10 \A'
1 1 "1 -T"
1
\
\ ' ' ' i\
\L \
\\
^-\\ \
M
\V
\\
\- M \
-1
\
\ 1\
\\
\
\1
\
\\
\
\v
\
\ x\
^x
\
^^
\
\_
\
\
N \\
x\\n
\ \
N A
v
^-, \
r
\
, \ i1
12 16
DISTANCE FROM EDGE (wn)
Figure u. Spread function curves for Xidex film taking the average of 5 replicates and two standard deviations using the
[image:33.520.79.335.62.329.2] [image:33.520.77.323.382.648.2]Table 2
Experiment 3
Repl icates
1 .60
4.5
9.02 .90 9.0
7.5
3 90
7.5
9.04 90
6.0
15.05 .70
4.5
12.0average .80
6.3
10.5
29
100
10
1 1 1 ' ' ' ' ' *
'-g=-j~A i i i i i i i | 1 ,
- 1 ^*^:^. 1
. \ " NX\ -" \
\
\ \\
\ \\
\\
\ ^ \ \ \ V \\
\ \\
^ : \ \ \ \ 1\
x-iiii.I , ,
1
i i i i i i 1 , ,
10 100 400
SPATIAL FREQUENCY (CYCLES/mm)
Figure 12. Modulation transfer curves for Xidex film taking the average of 5 replicates
andi two standard deviations using the constants in Table 2 and the
[image:34.520.52.401.371.640.2]30
EXPERIMENT 4
Five replicates using Xidex SX high contrast film were made. In this
experiment the exposure given to the vesicular film was varied
by
changing the time of the exposure rather than the intensity. The
exposure to the CRF film was the same as in Experiment 2. The
"Anti-Newton's Ring"
powder was used in both exposures.
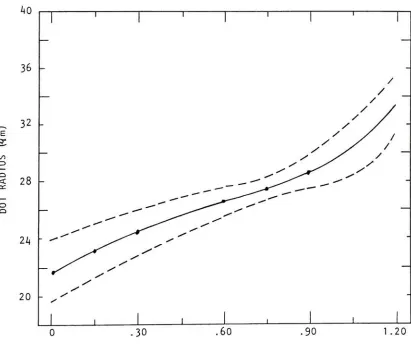
40 36 -~ 32 E o < 28 on o 24 20
1
'1
'1
'1
'1
/ / / / / / / /
/
y/
/ //
'-' X '
'
^
s^ ^r^
S
*^
_ **"
a0^t^ """* "\,--^ *** y ^***^ y^ -- -" y y ^* y ^x S-^^ ^ _ * ^ / s S
1
,1
I1
,1
I1
.30 .60 ,90 1.20
RELATIVE LOG EXPOSURE
Figure 13. Dot spread curve
-The average and
i
two standard deviations [image:35.520.42.453.275.623.2]31 50 40 30 20 -10
\
'1
'1
'1
1 1[\
-*A\V
*VA\
\\\-\v
*V v\\ -'\
\v \\\ \V \\\ \v \\-x \\N\\ "> N_^
\ w "^ ^^^^_
^^"
,,1,1,1 1
1
16
DISTANCE FROM EDGE (|im)
Figure 14. Spread function curves for Xidex film taking the average of 3 replicates andt two standard deviations measured
from the dot spread curves. (Exp. 4)
50
40
30
20
-10
S 1 1 1 1 1 i
\\ 1 1 1 '
V
V1
-i
-l\\\V
\\v ">L
v\
\ v\\
\\\
\ \x
\\>
\ VsV-^r
**.^-, 1 ,
1
*"
, 1 ,
1
12 16
DISTANCE FROM EDGE ^im)
Figure 15- Spread function curves for Xidex film taking the average of 3 replicates and two standard deviations using the
[image:36.520.81.330.63.334.2] [image:36.520.80.328.384.647.2]Table 3
Experiment 4
Repl icates
1 .80 5.0 22.0
2 .75 4.0 17.0
3 50 3.0
10.5
average .68
4.0
16.5
32
100
10
10 100 400
Figure 16.
SPATIAL FREQUENCY (CYCLES/mm)
[image:37.520.59.406.369.641.2]33
EXPERIMENT 5
Five replicates using the Eastman Kodak Recordak Thermal Print film
1953
were made. Other than the film change it was the same as in Experiment 2. 40 36 -32 E y < 28 or: o24
20-I
'I
'I
'I
'I
^* y ---^y *"^ ~ ~ ~~~ ' / *>** S '" y y __-~^ y ' ^ /^
/ "/ y* y""""
/ / ^ '
/
' / / / //
/ //
/ / //
//
/I
II
1I
1I
II
.30 .60 .90 1.20
RELATIVE LOG EXPOSURE
The average and two standard deviations
Figure
17-Dot spread curve
[image:38.520.41.457.270.642.2]34
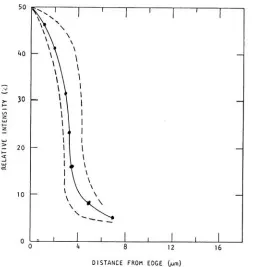
12 16
DISTANCE FROM EDGE (ujn)
Figure IS. Spread function curves for Recordak Thermal Print film
1953 taking the average of 5 replicates andi two standard deviations measured from the dot spread
curves. (Exp. 5)
12 16
DISTANCE FROM EDGE (^m)
Figure 19. Spread function curves for Recordak Thermal Print film
1953 taking the average of 5 replicates and two standard
deviations using the Gaussian approximation to the
[image:39.520.81.328.61.332.2] [image:39.520.78.324.353.637.2]Table
4
Experiment 5
Repl icates
1 .70 10.5
4.5
2 .90
8.0
10.03
.90 9.01.5
4 .90 11.0 6.0
5 90 12.0 2.0
average .06 10.1
4.3
35
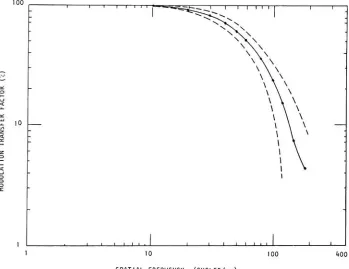
100
~1 > 1 t I I I ^u~
10
10
SPATIAL FREQUENCY (CYCLES/mm)
100 400
[image:40.520.122.349.66.204.2] [image:40.520.54.404.372.641.2]36
[image:41.520.105.351.60.328.2]DISTANCE FROM EDGE ( m)
Figure 21. Spread function curves for the Xidex film - (1)
using
the "Antinewton'
s rings"
powder, (2) without using the
"Antinewton's rings"
powder, (3) with the "Antinewton'
s
rings"
powder, without the carbon wedge.
100
3
Z 10
Figure 22.
SPATIAL FREQUENCY (CYCLES/mm)
Modulation transfer curves for the Xidex film (l) using the "Antinewton1
rings"
powder, (2) without using the "Ant inewton's
rings"
powder, (3) with the "Antinewton'
s
rings"
[image:41.520.61.413.306.638.2]37
ANALYSIS
Experiment 1 was designed to compare the results of this technique
with the results published
by
the manufacturer. The Eastman Kodak AHU5460 high resolution film tested with this technique is within 20% of
the modulation transfer response of the manufacturer's data.
However,
these results were obtained with only one trial. One reason the spread
function is wider, may be because of the "Anti-Newton ' s Ring" powder.
The Frieser approximation to the spread function was used as a model for
the spread function curve
(Figure
4). Figure 4 shows the modulationtransfer curve generated
by
the manufacturer andby
the dot radius versusexposure technique.
The image produced
by
the vesicularfilm,
discussed earlier, wasnot uniform. This uniformity problem was noticeableas can be seen from
the results of experiment 2. The results show the variance in the dot
spread and spread function curves was large.
(Figure
5 and 6). Toobtain the average dot spread curve, ten replicates were needed and at
each exposure level on each replicate ten
density
measurements were taken.In other words, 100 samples at each exposure level were used to determine
the average dot spread durve. This dot spread curve was then used to
generate the spread function curve which had to be curve-fit to the
model. This was very tedious and time consuming work, although it is
necessary to make many measurements, this may be the only technique avail
able for
determining
the spread function of vesicular film. As discussedby
Rabedeau mi crodensitometry of vesicular film is very difficult if not38
Figure 6 shows the measured spread function as the average and
two standard deviations of the ten replicates. Figure 8 shows the mod
ulation transfer curves corresponding to the calculated spread curves.
(
Figure 7 shows the average of the calculated spread function curve)
This modulation transfer curve could not be compared to the man
ufacturer's date because the manufacturers do not publish modulation
transfer curves. Table 1 is a tabulation of the constants obtained from
the sum of the least squared fit program used to fit the spread function
curves. The variance in this technqiue as applied to vesicular film is
quite large. It is believed that the majority of this variance is due
to the non-uniformity of the vesicular film. The "Ant i-Newton 's Ring"
powder was an attempt to eliminate the noise created
by
Newton's ringswhich formed in the vacuum frame. The problem that the "Ant i-Newton' s
Ring"
powder could cause is discussed in the
following
paragraphs.Any
variance caused
by
the dust spots formedduring
the contact printingcould be eliminated using a"clean air station"
when the exposures were
made.
(The
author did not have one available to use.)There might be some question raised concerning the contact printing
of a vesicular film onto another film. There may be some doubt as to
whether or not the vesicular image can be reproduced exactly, because of
its mechanism of image formation. The two sets of photographs below
represent the vesicular image
(left)
and the CRF image (right). Eachset represents a different exposure level on the vesicular film. At
each exposure level the size on both films correspond very closely.
(The
CRF film is not a copy of the exact four
dots,
but of dots in the same39
vesicular film are not completely formed do the contact copies not re
produce the image exactly.
(Photos
not shown) At the low exposure levelsthe dots are not at Dmax. The dots at higher exposure levels are at Dmax.
When the vesicular film is printed onto the
CRF,
the low exposure dotswill no longer be clear and for this reason the smaller dots cannotibe
used.
Exposure.
8X
Xidex SX Film CRF Fi 1m
Print 2. Photographs of the vesicular film at two exposure levels
imaged onto the CRF film.
(Magnification
approx.400X)
The approximation to the spread function was Gaussian in nature.
This differs from Friesers equation for silver halide film. This fact
is not surprising when the type of scattering in the two films are com
pared. The silver halide films scatter light due to the grain size and
inter-layer reflections. The vesicular film has essentially no grain
structure. The radiation sensitive salts are of a molecular level.
Therefore,
the spreading of radiation can only be causedby
inter-layerreflections. The radiation would either be absorbed or passed
directly
40
layer or passed out of the film. The radiation could again be ab
sorbed
by
the sensitized salts or reflected back to the base. The majorityof the radiation would be absorbed in the first few reflections. The dis
tribution of radiation
(i.e.
the spreadfunction)
appears to be(but
cannotbe mathematically proven
by
the author) a normal distribution(i.e.
Gaussian)Experiment 2 and 3 were designed to determine the effects of using
the "Anti-Newton' s Ring" powder and a stepped wedge.
Comparing
the resultsof experiment 2
(Figure 5-8)
and the results of experiment 3(Figure 9-12)
and those of experiment 4
(Figure
13-16),
it is observed that the spreadfunctions without using the "Ant i-Newton's Ring" powder and the spread
function where the stepped wedge was not used are much narrower than the
spread function where the "Anti-Newton' s Ring" powder was used.
In experiment 4 the "Ant i-Newton' s Ring" powder was used, but the exposure was varied
by
using a constantintensity
and moving an opaqueobject over the film while exposing. In the region where the exposure is
critical
(5
to 30 seconds) it was difficult to correctly time the exposure.Because of this
difficulty,
two replicates of the five which were made,could not be used.
Therefore,
the spread function curves(Figure
10,11)were determined using only three replicates. In addition reciprocity law
failure was observed at the longer exposures. The results of experiment 4
are not complete therefore, conclusions from this experiment could not be
drawn.
Examining
the measured spread functions with and without using the"Ant i-Newton's
Ring"
powder, it is difficult to determine the exact cause
for the difference. It would appear that the "Ant i-Newton' s Ring" powder
41
explanations which could explain the differences in the results. The
first explanation deals with the space created between the measuring
tint and the film. The space created is approximately tenam. Although
this is a small
distance,
it will allow the light which isdefract-ed at the measuring tint to form a larger image of the dot. The dot
sizes on the vesicular film and CRF film were compared. At a parti
cular exposure level the dot size of the vesicular film and CRF film
were equal on the average. At one exposure level the dot diameters
were not exactly the same. The densities of the carbon wedge were
uniform across each step.
Therefore,
the variation had to be due toeither the difference in the distances between the tint and film
caused
by
the powder or due to the scatter of lightby
the powder.In comparing the dot size with the microscope, it was difficult to
determine if the exact dot was reproduced.
Therefore,
there was somefactor causing the measured spread function to be wider when the
"Anti-Newton's Ring"
powder was used. The second explanation concerns the
intensity
distribution of the light causedby
the Newton's ring.The Newton's ring patterns are cosine in nature. The cosine
intensity
patterns, after going through the characteristic curve will not pro
duce a cosine
density
distribution. Newton's rings will cause
non-linearity
in the system. The noise may not be averaged outby
takingmany repl icates.
In experiment
5,
the Recordak Thermal Print film 1953 was examined. Again the "Ant i-Newton' s Ring" powder was used so it is diffi
cult to determine if the spread function which is measured is indeed
42
of the Recordak Thermal
film has a narrower spread function than that
of the Xidex film
(Figure 6-18).
The Recordak ThermalPrint film
should have a spread
function
narrower than the Xidex film inthat the
resolution of the Recordak is twice the resolution of the Xidex
film.*
Although
the technique is not perfected it produced results whichwould indicate it is feasible.
In summary, there are problems with the contact printing that must
be overcome. The results indicate
feasibility,
but modifications arerequired for the technique to be reliable.
Feasibility
has been shown, but methods of overcoming theproblems in contact printing techniques should be investigated.
Investigation of different "Ant i-Newton' s ring"
powder
(i.e.
different size particles) could be made. This would demonstrate the
effect of separation between layers has on the spread function.
The effect of the modulator should be examined. The dimensions
and geometry of the UV exposing source could be varied to see what
effect it might have on the spread function. These are some of
the more urgent problems that must be investigated in order to
perfect the halftone dot technique as applied to vesicular film.
Manufacture's data: Recordak Thermal Print
1953,
resolving43
CONCLUSION
A technique for
deriving
the spread function and modulationtransfer function of the vesicular film has been determined which
does not require the use of a microdensitometer.
Therefore,
theproblems associated with microdensitometry of vesicular films
are eliminated. This technique utlizes the fact that a dot image
will increase in size as the exposure increases and that this change
in dot size can be measured using many small dots and a "macro"
densitometer. Modifications in the contact printing technique must
APPENDIX I
44
Derivation
of the edge spread function,Figure A1 Dot Spread Curve
r =
radius of the image which is equivalent to the measuring tint dot size
r1 =
radius of the dot at an exposure level of 1 0X E
1 o
E = exposure level which will reproduce the
measuring tint dot
E- = exposure which is 10X E
(time
of exposure isconstant,
intensity
is increasedby
10X)The edge spread function can be derived from the dot spread
function. The initial exposure, E is the exposure needed to exactly
reproduce the measuring tint dot.
Assuming
the exposure is variedby
adjusting
intensity
andkeeping
exposure time constant theintensity
will describe the exposure. The
intensity
I will produce a dot radius,r with a particular
density
distribution in the vicinity around theedge. An intensity, I.
(
corresponding to EL which is 10X I willproduce a dot radius r. with the same
density
distribution at the edgeas that of r . This means that at a distance of
(r,
-r
)
from an edge,o ' o
the intensity will be one-tenth the
intensity
at the edge.The edge spread function is shown in figure A-2. The spreading of
[image:49.520.43.445.132.393.2]45
in figure A-2, the spreading on either side can be considered. The
spreading of light on one side is symmetrical with the other.
In figure A-1
(the
dot spread curve) it was shown that at thedistance
(r1
-r
)
from an edge, theintensity
is 1/10 of I . Thisrepresents the area under the opaque side of the edge where d goes
from zero to positive infinity.
Figure A2 Edge Spread Function
Using
theseideas,
the edge spread function can be determinedfrom f igure A-1 .
d = distance from the edge
(edge
corresponds to r)
r = distance
(r.
-r
)
Log
(
I ,/I)
= the logarithm of the
intensity
at some distance dfrom an edge with respect to ' j/'
_<j0 >
the incident
intensity
(l_o0=2lQ)
I can now be considered to be 1/10 of I
Using
the equation of theline and applying it to the straight line portion of figure
A-1,
theedge spread function can be derived:
d =
rLog(2(ld/l_03
))
Log
(2(ld/l_00)) = d/rI ./I
= 10 d -bo
d/r
where d is negative
and in general
l,/l ^
= 10
d
46
Derivation
of the line spread function:Lsp =d(e(x))
dx
where e(x) is the edge spread function.
10x/r
e(x) =
, where x is negative
d f
(x)
f(x)
i / \ * i / \using
^
p '=
p
ln(p)
f'(x)
d(e(x)
)
_2.3
inx/r
cc j
=
^ 10 = LSF, where x is negative
dx 2r 3
and in general
LSF =
\^-
10_ld/rl,
letting
x= d
2r
I ,/l is obtained from the spread function as follows
I 2r
3 s/r
10 ds , where d is negative
'!
s/r
ln(lO)
,e ds
10d/r
and in general
d'
-, 2
Derivation of the Fourier transform of the Frieser approximation:
io-ld/rl
Frieser equation = I ,/l
= =
-47
Using
the property of sum of two functions Fourier transforms tothe sum of the Fourier transform of each function.
g(x) +
f(x)
transforms toG(f)
+F(f)
setting
h(x)
=x/r
x>0
h(x)
=0 x<0H(f, =^e^3W/re^ixfdx
-U2)
f"e"((2-3/r)
+
2*if>xdx
2
Jo
'
v
1 -((2.3/r)-2n1xl
((2.3/r)
+ 2if)
1
(2.3/r)
+ 2?fif2.3/r
(2.3/r)2
+ (2frf)2 (2.3)2 + (2rrf)2
2-rfif
since e
I
' is an even function theimaginary
part does not exist.2.3/r
H(f) =
-(2.3)2
+
(2rrf)2
normalizing the function so that H(f) = 1 when f = 0
1
H(f)
= .1 +
(2flfr/2.3)
If r is in^m and f is in cycles/mm, f must be multiplied
by
.001It follows that:
M.
Mo
1 +48
e
REFERENCES
Dr. H.H.
McGregor, Jr.,
"Vesicular Photography- AnOverview",
ThJournal of
Micrographics,
Volume9,
Number1,
September 1975pp 13-20
Seifert and
Elbrecht,
"The KalvarProcess",
Photographic Scienceand
Engineering,
Volume5,
Number4,
July-August1961,
pp 235-238
e
3. R.T.
Nieset,
"The Basis of the Kalvar System ofPhotography",
ThJournal of Photographic Science. Volume
10,
1962,
pp 188-1954.
M.G.Anderson,
"Sensitometry of VesicularFilms",
Journal of Appl iedPhotographic
Engineering,
Volume3,
Number3,
Summer1977,
pp 135-1425.
Timothy
J. Sewell and PaulWillig,
MTF andAdjacency
Effects of Vesicular
Films,
Photo Science Thesis RIT 19776.
Xidex Vesicular Film product sheet7. M.E.
Rabedeau,
"The Microimage Characteristics of a KalvarFilm",
Photographic Science and
Engineering,
Volume9,
Number1,
January-February 1965,
pp 58-628.
C.E.K. Mees and T.H. James(eds.),
"Theory
of the PhotographicProcess",
ThirdEdition,
The MacmillanCompany,
NewYork,
1966,
PP 508
9. J.C.
Dainty
and R.Shaw,
ImageScience,
AcademisPress,
NewYork,
1976,
pp 27210. R.L. Lamberts and F.C.
Eisen,
"A System for Automated Evaluation ofModulation Transfer Functions of Photographic
Materials",
Journal ofApplied Photographic
Engineering,
Volume6,
NumberI, February
T980PP 1-8
11. Richard J.
Byer,
"Facile Image Evaluation of High-ResolutionFilms",
Journal of Applied Photographic
Engineering,
Volume3,
Number2,
Spring
1977,
pp 61-6612. Dr. E.
Goldberg,
"On TheResolving
Power of the PhotographicPlate",
The Photographic
Journal,
November1912,
pp 300-31913. F.E.
Ross,
The Physics of the DevelopedImage,
VanNostrand,
NewYork,
1924
14. H.
Frieser,
"Spread Function and Contrast Transfer Function of Photographic
Layers",
Photographic Science andEngineering,
Volume4,
49
15. Private conversation with Richard J. Byer
16. R.N. Bracewell, The Fourier Transform and Its
Application,
McGraw-Hill,
NewYork,
1978, pp 13017- Kodak Publication
D-36,
Recordak Thermal Print Film1953,2953,