Computational complexity analysis for Monte Carlo
approximations of classically scaled population processes
David F. Anderson
∗,
Desmond J. Higham
†,
Yu Sun
‡June 5, 2018
Abstract
We analyze and compare the computational complexity of different simulation strategies for Monte Carlo in the setting of classically scaled population processes. This allows a range of widely used competing strategies to be judged systematically. Our setting includes stochastically modeled biochemical systems. We consider the task of approximating the expected value of some path functional of the state of the system at a fixed time point. We study the use of standard Monte Carlo when sam-ples are produced by exact simulation and by approximation with tau-leaping or an Euler-Maruyama discretization of a diffusion approximation. Appropriate modifica-tions of recently proposed multilevel Monte Carlo algorithms are also studied for the tau-leaping and Euler-Maruyama approaches. In order to quantify computational com-plexity in a tractable yet meaningful manner, we consider a parameterization that, in the mass action chemical kinetics setting, corresponds to the classical system size scal-ing. We base the analysis on a novel asymptotic regime where the required accuracy is a function of the model scaling parameter. Our new analysis shows that, under the specific assumptions made in the manuscript, if the bias inherent in the diffusion approximation is smaller than the required accuracy, then multilevel Monte Carlo for the diffusion approximation is most efficient, besting multilevel Monte Carlo with tau-leaping by a factor of a logarithm of the scaling parameter. However, if the bias of the diffusion model is greater than the error tolerance, or if the bias can not be bounded analytically, multilevel versions of tau-leaping are often the optimal choice.
∗Department of Mathematics, University of Wisconsin, Madison, USA. [email protected], grant
support from NSF-DMS-1318832 and Army Research Office W911NF-14-1-0401.
†Department of Mathematics and Statistics, University of Strathclyde, UK.
[email protected], grant support from a Wolfson/Royal Society Research Merit Award and an EPSRC Fellowship with reference EP/M00158X/1.
‡Facebook, Inc., 1 Hacker Way, Menlo Park, CA, USA. [email protected].
1
Introduction
For some largeN0 >0 we consider a continuous time Markov chain satisfying the stochastic
equation
XN0(t) = XN0(0) + K
X
k=1
1
N0
Yk
N0
Z t
0
λk(XN0(s))ds
ζk, (1)
where XN0
(t)∈Rd,K <∞, the Yk are independent unit Poisson processes and, for each k,
ζk ∈Rd and λk :Rd →R≥0 satisfies mild regularity conditions. For a given path functional
f, we consider the task of numerically approximating E[f(XN0(·))], in the sense of confi-dence intervals, to some fixed tolerance ε0 <1. Specifically, we consider the computational
complexity, as quantified by the number of random variables utilized, required by different Monte Carlo schemes to achieve a root mean squared error of ε0. For concreteness, we will
assume throughout that the path functional f depends upon XN0
(·) only on the compact time interval [0, T].
The class of models of the form (1) has a long history in terms of modelling [12,13,14,31], analysis [9,27,28] and computation [18,19]. The framework covers many application areas, including population dynamics [32], queueing theory [33], and several branches of physics [15]. In recent years, chemical and biochemical kinetics models in systems biology [34] have been the driving force behind a resurgence of activity in algorithmic developments, including tau-leaping [20] and its multilevel extension [4, 5]. In this setting, the parameter N0 in (1)
can represent Avogadro’s number multiplied by the volume, and in this classical scaling, species are measured in moles per liter. More generally, however,N0 can just be considered
a large number, often of the order 100s or 1000s.
In section 2, we discuss some of the issues involved in quantifying computational plexity in the present setting, and introduce a novel scaling regime in which clear-cut com-parisons can be made. Further, the specific assumptions utilized throughout the manuscript are presented and a high-level summary of our main conclusions is presented. In section 3, we summarize two widely used approximation methods for the model (1): the tau-leap dis-cretization method, and the Langevin or diffusion approximation. In section 4, we quantify the computational complexity of using exact simulation, tau-leaping, and simulation of the diffusion equation with standard Monte Carlo for approximating E[f(XN0
(·))] to a desired tolerance under our assumptions. Further, in subsection4.2 we review the more recent mul-tilevel methods and quantify the benefits of their use in both the tau-leaping and diffusion scenarios. In section5, we provide numerical examples demonstrating our main conclusions. In section 6, we close with some brief conclusions.
This paper makes use of results from two recent papers.
• In [5] an analysis was carried out to determine the variance of the difference between coupled paths in the jump process setting under a more general scaling than is consid-ered here.
• In [6] an analysis was carried out to determine the variance of the difference between coupled paths in the setting of stochastic differential equations with small noise.
mid-point or trapezoidal tau-leaping, could be considered. Here, we consider a particular scaling (which is the most common in the literature) and present a unified computational complexity analysis for a range of Monte Carlo based methods. This allows us to make what we believe are the first concrete conclusions pertaining to the relative merits of current methods in a practically relevant asymptotic regime. Moreover, an open question in the literature involves the selection of the finest time-step in the unbiased version of multilevel Monte Carlo (since it is not constrained by the accuracy requirement). By carrying out our analysis in this particular scaling regime, we are able to determine the asymptotics for the optimal selection of this parameter. Selecting the finest time-step according to this procedure is shown to lower the computational complexity of the method by a nontrivial factor. See the end of Section 4.2.2 for this derivation and the end of Section 5 for a numerical example. Second, it has become part of the “folk-wisdom” surrounding these models that in the particular scaling considered here, properly implemented numerical methods applied to the diffusion approximation are the best choice. This idea was somewhat exacerbated by the analysis in [6], which applied to a key aspect of the algorithm. There it was shown that the variance between the coupled paths of a diffusion approximation is asymptotically smaller than the variance between the properly scaled jump processes. However, here we show that the actual difference in overall complexity between properly implemented versions of multilevel Monte Carlo for the diffusion approximation and for the jump process never differ by more than a logarithm term. If one combines this conclusion with the fact that the bias of the diffusion approximation itself is often unknown, whereas multilevel Monte Carlo applied to the jump process is naturally unbiased, then the folk-wisdom is overturned and unbiased multilevel Monte Carlo is seen as a competitive choice.
2
Scaling, assumptions, and a summary of results
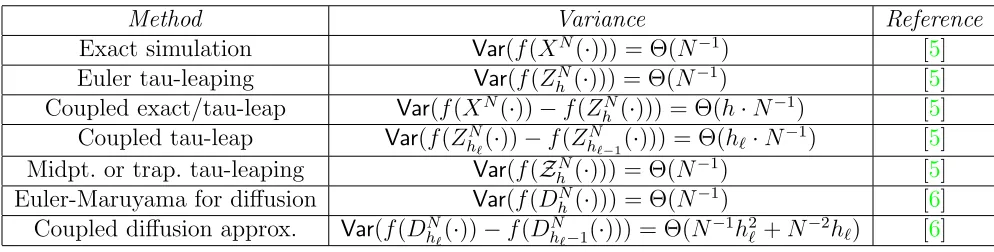
In order to motivate our analysis and computations, we begin with a brief, high-level, overview. In particular, we discuss the entries in Table1, which summarizes the key conclu-sions of this work. Full details are given later in the manuscript, however we point out here that the terms in Table 1include assumptions on the variances of the constituent processes that will be detailed below.
A natural approach to approximate the desired expectation is to simulate paths exactly, for example with the stochastic simulation algorithm [18, 19] or the next reaction method [1,16], in order to obtain independent sample paths {XN0
[i] }ni=1 that can be combined into a
sample average
ˆ
µn= 1
n
n
X
i=1
f(XN0
[i] (·)). (2)
This becomes problematic if the cost of each sample path is high—to follow a path exactly we must take account of each individual transition in the process. This is a serious issue when many jumps take place, which is the case when N0 is large.
Anderson, Ganguly, and Kurtz [3] considered a family of models, parameterized by N ≥N0
(see (3) below), and considered the limitN → ∞and h→0 with h=N−β for some β >0. To see why such a limit is useful we note two facts:
• If, instead, we allow N → ∞ with h fixed, then the stochastic fluctuations become negligible [8, 27]. In this thermodynamic limit the model reduces to a deterministic ODE, so a simple deterministic numerical method could be used.
• If, instead, we allow h → 0 with N0 fixed then tau-leaping becomes arbitrarily
inef-ficient. The “empty” waiting times between reactions, which have nonzero expected values, are being needlessly refined by the discretization method.
The relationh =N−β brings together the large system size effect (where exact simulation is expensive and tau-leaping offers a computational advantage) with the small h effect (where the accuracy of tau-leaping can be analysed). This gives a realistic setting where the benefits of tau-leaping can be quantified. It may then be shown [3, Theorem 4.1] that the bias arising from Euler tau-leaping isO(h) =O(N−β) in a wide variety of cases. Higher order alternatives to the original tau-leaping method [20] are available. For example, a mid-point discretization [3, Theorem 4.2] or a trapezoidal method [7] both achieve O(h2) =O(N−2β) bias for a wide variety of cases.
As an alternative to tau-leap discretizations, we could replace the continuous-time Markov chain by a diffusion approximation and use a numerical stochastic differential equation (SDE) simulation method to generate approximate paths [9]. This approximation is detailed in section 3.2 below. While higher order methods are available for the simulation of diffusion processes, we restrict ourselves to Euler-Maruyama as the perturbation in the underlying model has already created a difficult to quantify bias. Thus, higher order numerical schemes are hard to justify in this setting.
For our purposes, rather than the step size h of a particular approximate method, it is more natural to work in terms of the system size, N0, and accuracy parameter ε0. Let
ε0 =N0−α, for some fixedα >0. A larger value ofαcorresponds to a more stringent accuracy
requirement. Next, consider the following family of models parameterized by N ≥N0,
XN(t) =XN(0) + K
X
k=1
1
NYk
N
Z t
0
λk(XN(s))ds
ζk, (3)
with initial conditions satisfying limN→∞XN(0) = x
0 ∈ Rd>0. We will study the
asymp-totic behavior, as N → ∞, of the computational complexity required of various schemes to approximateE[f(XN(·))] to a tolerance of
εN =N−α, (4)
wheref is a desired path functional. Specifically, we require that both the bias and standard deviation of the resulting estimator is less than εN.
We emphasize at this stage that we are no longer studying a fixed model. Instead we look at the family of models (3) parameterized through the system sizeN, and consider the limit, as N → ∞, of the computational complexity of the different methods under the accuracy requirement (4). The computed results then tell us, to leading order, the costs associated with solving our fixed problem (1) with accuracy requirement N−α
2.1
Specific assumptions and a brief summary of results
Instead of giving specific assumptions on the intensity functions λk and the functionalf, we give assumptions pertaining to the cost of different path simulation strategies, the bias of those strategies, and the variance of different relevant terms. We then provide citations for when the assumptions are valid. We expect the assumptions to be valid for a wider class of models and functionals than has been proven in the literature, and discovering such classes is an active area of research.
To quantify computational complexity, we define the “expected cost-per-path” to be the expected value of the number of random variables generated in the simulation of a single path. Standard Θ notation is used (providing an asymptotic upper and lower bound in N
orh). We emphasize that computations take place over a fixed time interval [0, T].
Assumption 1. We assume the following expected cost-per-path for different methods.
Method Expected cost-per-path
Exact simulation Θ(N) Euler tau-leaping Θ(h−1)
Midpoint tau-leaping Θ(h−1/2)
Euler-Maruyama for diffusion Θ(h−1)
We make the following assumptions on the bias, |E[f(XN(·))] −E[f(ZN(·))]|, of the different approximation methods, whereZN is a generic placeholder for the different methods.
Assumption 2. We assume the following biases.
Method Bias Reference
Exact simulation 0 N.A. Euler tau-leaping Θ(h) [3] Midpoint tau-leaping Θ(h2) [3]
Euler-Maruyama for diffusion Θ(h) [6, 26]
A bias of Θ(h) for Euler-Maruyama applied to a diffusion approximation is extremely generous, as it assumes that the bias of the underlying diffusion approximation is negligible. However, analytical results pertaining to the bias of the diffusion approximation for general functionals f are sparse. A startling result of the present analysis is that even with such generosity, the complexity of the unbiased version of multilevel tau-leaping is still often within a factor of a logarithm of the complexity of the multilevel version of Euler-Maruyama applied to the diffusion approximation.
We provide our final assumption, pertaining to the variances of relevant terms. Below,
ZN
h is a tau-leap process with step size h, ZhN is a midpoint tau-leap process with step size
h, and DN
Monte Carlo method Computational complexity unbiased? Most efficient MC + exact simulation Θ(N2α+N) Yes Never
MC + tau-leaping Θ(N3α−1+Nα) No Never MC + midpt. or trap. tau-leap Θ(N2.5α−1+Nα/2) No 1
2 < α≤ 2 3
MC + Euler for diff. approx. Θ(N3α−1+Nα) No Never MLMC + E-M for diff. approx. Θ(N2α−1+Nα) No α ≥ 2 3
biased MLMC tau-leaping Θ(N2α−1(logN)2+Nα) No α ≥ 2 3
[image:6.612.71.568.329.455.2]unbiased MLMC tau-leaping Θ(N2α−1(logN)2+N) Yes α ≥1
Table 1: Computational cost for different Monte Carlo methods, as N → ∞. The final column indicates when each method is most efficient, in terms of the parameter α, up to factors involving logarithms.
Assumption 3. We assume the following relevant variances per realization/path.
Method Variance Reference
Exact simulation Var(f(XN(·))) = Θ(N−1) [5]
Euler tau-leaping Var(f(ZN
h (·))) = Θ(N−1) [5] Coupled exact/tau-leap Var(f(XN(·))−f(ZN
h (·))) = Θ(h·N−1) [5] Coupled tau-leap Var(f(ZN
hℓ(·))−f(Z N
hℓ−1(·))) = Θ(hℓ·N
−1) [5]
Midpt. or trap. tau-leaping Var(f(ZN
h (·))) = Θ(N−1) [5] Euler-Maruyama for diffusion Var(f(DN
h(·))) = Θ(N−1) [6] Coupled diffusion approx. Var(f(DN
hℓ(·))−f(D N
hℓ−1(·))) = Θ(N
−1h2
ℓ +N−2hℓ) [6] The results presented in Table 1 can now start coming into focus. For example, we immediately see that in order to get both the bias and standard deviation under control, i.e. below εN, we have the following:
Monte Carlo plus exact simulation: We require Θ(N−1ε−2
N + 1) paths for the standard deviation to be order ε2
N, at a cost of Θ(N) per path. This totals a computational complexity of Θ(ε−2
N +N) or Θ(N2α+N).
Monte Carlo plus tau-leaping: Θ(N−1ε−2
N + 1) paths at a cost of Θ(ε−
1
N ) per path (re-quired to achieve a bias ofO(ε)), totaling a computational complexity of Θ(N−1ε−3
N +
ε−1
N ) or Θ(N3α−1+Nα),
We also mention that a crude and inexpensive approximation to the required expected value can be computed by simply simulating the deterministic mass action ODE approxima-tion to (1), which is often referred to as the reaction rate equation [8,9]. Depending upon the choice of functional f and the underlying model (3), the bias from the ODE approximation can range from zero (in the case of a linear λk and linear function f), to order N−1/2 (for example, whenf(XN(·)) = sup
t≤T |XN(t)−c(t)|, wherecis the ODE approximation itself). As we are interested in the fluctuations inherent to the stochastic model, we view α= 1
2 as a natural cut-off in the relationship (4).
In addition to the asymptotic complexity counts in Table 1, another important feature of a method is the availability of computable a posteriori confidence interval information. As indicated in the table, two of the methods considered here, exact simulation with Monte Carlo and an appropriately constructed multilevel tau-leaping, are unbiased. The sample mean, accompanied by an estimate of the overall variance, can then be delivered with a computable confidence interval. By contrast, the remaining methods in the table are biased: tau-leaping and Euler-Maruyama introduce discretization errors and the diffusion approx-imation perturbs the underlying model. Although the asymptotic leading order of these biases can be estimated, useful a posteriori upper bounds cannot be computed straightfor-wardly in general, making these approaches much less attractive for reliably achieving a target accuracy.
Based on the range of methods analysed here in an asymptotic regime that couples system size and target accuracy, three key messages are
• simulating exact samples alone is never advantageous,
• even assuming there is no bias to the underlying model, simulating at the level of the the diffusion approximation is only marginally advantageous,
• tau-leaping can offer advantages over exact simulation, and an appropriately designed version of multilevel tau-leaping (which combines exact and tau-leaped samples) offers an unbiased method that is efficient over a wide range of accuracy requirements.
3
Approximation methods
In this section, we briefly review the two alternatives to exact simulation of (3) we study in this paper: tau-leaping and an Euler-Maruyama discretization of a diffusion approximation.
3.1
Tau-Leaping
parameter x, with all such samples being independent of each other and of all other sources of randomness used.
Algorithm 1 (Euler tau-leaping). Fixh >0. SetZN
h (0) =x0,t0 = 0,n = 0 and repeat the
following until tn=T:
(i) Set tn+1 =tn+h. If tn+1 ≥T, set tn+1 =T and h=T −tn.
(ii) For each k, let Λk= Poisson(λk(ZN
h (tn))h). (iii) Set ZN
h (tn+1) = ZhN(tn) +
P
kΛkζk. (iv) Set n←n+ 1.
Analogously to (3), a path-wise representation of Euler tau-leaping defined for all t ≥0 can be given through a random time change of Poisson processes:
ZhN(t) =ZhN(0) +X k
1
NYk
N
Z t
0
λk(ZhN(ηh(s)))ds
ζk, (5)
where the Yk are as before, and ηh(s)
def
= js
h
k
h. Thus, ZN
h (ηh(s)) =ZhN(tn) iftn≤s < tn+1.
As the values of ZN
h can go negative, the functions λk must be defined outside of Zd≥0. One
option is to simply define λk(x) = 0 for x /∈Zd≥0, though other options exist [2].
3.2
Diffusion approximation
The tau-leaping algorithm utilizes a time-stepping method to directly approximate the under-lying model (3). Alternatively, a diffusion approximation arises by perturbing the underlying model into one which can be discretized more efficiently.
Define the function F via
F(x) =X k
λk(x)ζk.
By the functional central limit theorem,
1
√
N [Yk(N u)−N u]≈Wk(u), (6)
where Wk is a standard Brownian motion. Applying (6) to (3) yields
XN(t)≈XN(0) +
Z t
0
F(XN(s))ds+X k
1
√
NWk
Z t
0
λk(XN(s))ds
ζk,
where the Wk are independent standard Brownian motions. This implies that XN can be approximated by the process DN satisfying
DN(t) = DN(0) +
Z t
0
F(DN(s))ds+X k
1
√
NWk
Z t
0
λk(DN(s))ds
where DN(0) =XN(0). An equivalent, and more prevalent, way to represent DN is via the Itˆo representation
DN(t) =DN(0) +
Z t
0
F(DN(s))ds+X k
1
√
Nζk
Z t
0
p
λk(DN(s))dWk(s), (8)
which is often written in the differential form
dDN(t) =F(DN(t))dt+X k
1
√
Nζk
p
λk(DN(t))dWk(t), (9)
where the Wk of (9) are not necessarily the same as those in (7).
The SDE system (9) is known as aLangevin approximation in the biology and chemistry literature, and adiffusionapproximation in probability [9,34]. We note the following points.
• The diffusion coefficient, often termed the “noise” in the system, is Θ(√1
N), and hence, in our setting is small relative to the drift.
• The diffusion coefficient involves square roots. Hence, it is critical that the intensity functionsλkonly take values inR≥0on the domain of the solution. This is of particular
importance in the population process setting where the solutions of the underlying model (3) naturally satisfy a non-negativity constraint whereas the SDE solution paths cannot be guaranteed to remain non-negative in general. In this case one reasonable representation, of many, would be
dDN(t) =F(DN(t))dt+X k
1
√
Nζk
p
[λk(DN(s))]+dWk(s), (10)
where [x]+ = max{x,0}. Another reasonable option would be to use a process with
reflection [30].
• The coefficients of the SDE are not globally Lipschitz in general, and hence standard convergence theory for numerical methods, such as that in [26], is not applicable. Ex-amples of nonlinear SDEs for which standard Monte Carlo and multilevel Monte Carlo, when combined with and Euler-Maruyama discretization with a uniform timestep, fail to produce a convergent algorithm have been pointed out in the literature [22, 23]. The question of which classes of reaction systems lead to well-defined SDEs and which discretizations converge at the traditional rate therefore remains open.
In this work, to get a feel for the best possible computational complexity that can arise from the Langevin approximation, we will study the case where the bias that arises from switching models fromXN toDN is zero. We will also assume that, even though the diffusion coefficients involve square roots and are therefore not generally globally Lipschitz, the Euler-Maruyama method has a bias of order Θ(h). We will find that even in this idealized light, the asymptotic computational complexity of Euler-Maruyama on a diffusion approximation combined with either a standard or a multilevel implementation is only marginally better than the corresponding computational complexity bounds for multilevel tau-leaping. In particular, they differ only in a factor of a logarithm of the scaling parameter.
4
Complexity analysis
In this section we establish the results given in Table 1. In subsection4.1, we derive the first four rows, whereas in subsection 4.2 we discuss the multilevel framework and establish rows five, six, and seven.
4.1
Complexity analysis of standard Monte Carlo approaches
4.1.1 Exact Sampling and Monte Carlo
By Assumption1the expected number of system updates required to generate a single exact sample path is Θ(N). Letting
δN =Var(f(XN(·))), in order to get a standard deviation below εN we require
n−1δ
N ≤ε2N =⇒ n≥δNε−N2+ 1.
Thus, the total computational complexity of making the desired approximation is
Θ(nN) = Θ(δNε−N2N +N) = Θ(δNN2α+1+N).
By Assumption 3, δN = Θ(N−1), yielding an overall complexity of Θ(N2α+N), as given in the first row of Table1.
4.1.2 Tau-leaping and Monte Carlo
Suppose now that we usenpaths of the tau-leaping process (5) to construct the Monte Carlo estimator ˆµn for E[f(XN(·))]. By assumption 2, the bias is Θ(h), so we constrain ourselves toh =εN. Letting
δN,h =Var(f(ZhN(·)))
we again requiren≥δN,hε−N2+ 1 to control the statistical error. Since by Assumption1there are Θ(h−1) expected operations per path generation, the total computational complexity for
making the desired approximation is
Θ(nh−1) = Θ(δ
N,hε−N3+ε−N1). By Assumption3,Var(f(ZN
h,i(·))) = Θ(N−1), giving an overall complexity of Θ(N3α−1+Nα), as reported in the second row of Table 1.
Weakly second order extensions to the tau-leaping method can lower the computational complexity dramatically. For example, if we use the midpoint tau-leaping process ZN
h from [3], by Assumption 2 we can set h = √εN and still achieve a bias of Θ(εN). Since by As-sumption3we need n≥N−1ε−2
N + 1 paths to control the standard deviation, the complexity is
Θ(n·h−1) = Θ(N−1ε−2.5
N +ε−
1/2
N ) = Θ(N2.5α−1+Nα/2),
If methods are developed that are higher order in a weak sense, then further improvements can be gained. In general, if a method is developed that is weakly of order ρ, then we may set h =ε1N/ρ to achieve a bias of Θ(εN). Still supposing a per-path variance of Θ(N−1), we again choose n≥N−1ε−2
N + 1 paths, and find a complexity of
Θ(n·h−1) = Θ(N−1ε−(2+
1 ρ) N +ε−
1/ρ
N ) = Θ(N
(2+1
ρ)α−1+Nα/ρ).
For example, if a third order method is developed, i.e., ρ = 3, then this method becomes optimal for 1
2 ≤ α ≤ 3
4. To the best of the authors’ knowledge, no such methods have yet
been designed.
4.1.3 Diffusion approximation and Monte Carlo
Given Assumptions1,2, and3, the complexity analysis for the diffusion approximation with Euler-Maruyama is exactly the same as for Euler tau-leaping. Hence, we can again give an overall complexity of Θ(N3α−1+Nα), as reported in the fourth row of Table1.
4.2
Multilevel Monte Carlo and complexity analysis
In this section we study multilevel Monte Carlo approaches and derive the results summarized in rows five, six, and seven of Table 1.
4.2.1 Multilevel Monte Carlo and Diffusion Approximation
Here we specify and analyze an Euler-based multilevel method for the diffusion approxima-tion, following the original framework of Giles [17].
For some fixed M > 1 we let hℓ = T ·M−ℓ for ℓ ∈ {0, . . . , L}, where T > 0 is a fixed terminal time. Reasonable choices for M include M ∈ {2,3,4, . . . ,7}, and L is determined below. Let DN
hℓ denote the approximate process generated by Euler-Maruyama applied to (9) with a step size ofhℓ. By Assumption 2we may sethL =εN, givingL= Θ(|logεN|), so that the finest level achieves the required order of magnitude for the bias.
Noting that
E[f(DhNL(·))] =E[f(Dh0N(·))] + L
X
ℓ=1
E[f(DhNℓ(·))−f(DNhℓ
−1(·))], (11)
we use i as an index over sample paths and let
b
QN0 def= 1
n0
n0
X
i=1
f(DNh0,[i](·)), and Qb N ℓ
def
= 1
nℓ nℓ
X
i=1
(f(DhNℓ,[i](·))−f(DNhℓ−1,[i](·))),
for ℓ = 1, . . . , L, where n0 and the different nℓ have yet to be determined. Note that the form of the estimator QbN
ℓ above implies that the processesDNhℓ andD N
hℓ−1 will be
coupled, or constructed on the same probability space. We consider here the case when (DN
hℓ, D N
coupled in the usual way by using the same Brownian path in the generation of each of the marginal processes. Our (biased) estimator is then
b
QN def= QbN
0 +
L
X
ℓ=1
b
QN ℓ .
Set
δN,ℓ =Var(f(DhNℓ(·))−f(D N
hℓ−1(·))).
By Assumption3,δN,ℓ = Θ(N−1h2ℓ+N−2hℓ) andVar(f(DNh0(·))) = Θ(N−1).In [6] it is shown that under these circumstances, the computational complexity required is Θ(ε−2
N N−1+ε−N1). In the regime (4) this translates to Θ(N2α−1+Nα), as reported in the fifth row of Table1.
4.2.2 Multilevel Monte Carlo and tau-leaping
The use of multilevel Monte Carlo with tau-leaping for continuous-time Markov chains of the form considered here was proposed in [4], where effective algorithms were devised. Com-plexity results were given in a non-asymptotic multi-scale setting, with followup results in [5]. Our aim here is to customize the approach in the scaling regime (4) and thereby develop easily interpretable complexity bounds that allow straightforward comparison with other methods. In this section ZN
hℓ denotes a tau-leaping process generated with a step-size of
hℓ =T ·M−ℓ, for ℓ∈ {0, . . . , L}.
A major step in [4] was to show that a coupling technique used for analytical purposes in [3,29] can also form the basis of a practical simulation algorithm. LettingYk,i, i∈ {1,2,3}, denote independent, unit rate Poisson processes, we couple the exact and approximate tau-leaping processes in the following way,
XN(t) =XN(0) +X k
1
NYk,1
N
Z t
0
λk(XN(s))∧λk(ZhNL(ηL(s)))ds
ζk
+X k
1
NYk,2
N
Z t
0
[λk(XN(s))−λk(XN(s))∧λk(ZhNL(ηL(s)))]ds
ζk,
(12)
ZhNL(t) =ZhNL(0) +X k
1
NYk,1
N
Z t
0
λk(XN(s))∧λk(ZhNL(ηL(s)))ds
ζk
+X k
1
NYk,3
N
Z t
0
[λk(ZhNL(ηL(s)))−λk(XN(s))∧λk(ZhNL(ηL(s)))]ds
ζk, (13)
where a ∧b denotes min{a, b} and ηL(s) = ⌊s/hL⌋hL. Sample paths of (12)–(13) can be generated with a natural extension of the next reaction method or Gillespie’s algorithm, see [4], and forhL ≥N−1 the complexity required for the generation of a realization (XN, ZhNL) remains at the Θ(N) level. The coupling of two approximate processes,ZN
hℓ and Z N
the similar form
ZhNℓ(t) =ZhNℓ(0) +X k
1
NYk,1
N
Z t
0
λk(ZhNℓ(ηℓ(s)))∧λk(ZhNℓ
−1(ηℓ−1(s)))ds
ζk
+X k
1
NYk,2
N
Z t
0
[λk(ZhNℓ(ηℓ(s)))−λk(ZhNℓ(ηℓ(s)))∧λk(ZhNℓ
−1(ηℓ−1(s)))]ds
ζk,
(14)
ZhNℓ
−1(t) =Z
N
hℓ−1(0) +
X
k 1
NYk,1
N
Z t
0
λk(ZhNℓ(ηℓ(s)))∧λk(ZhNℓ
−1(ηℓ−1(s)))ds
ζk
+X k
1
NYk,3
N
Z t
0
[λk(ZhNℓ
−1(ηℓ−1(s)))−λk(Z
N
hℓ(ηℓ(s)))∧λk(Z N
hℓ−1(ηℓ−1(s)))]ds
ζk,
(15)
where ηℓ(s) def= ⌊s/hℓ⌋hℓ. The pair (14)–(15) can be sampled at the same Θ(h−ℓ1) cost as a single tau-leaping path, see [4].
For L as yet to be determined, and noting the identity
E[f(XN(·))] =E[f(XN(·))−f(ZLN(·))] + L
X
ℓ=1
E[f(ZhNℓ(·))−f(ZhNℓ
−1(·))] +E[f(Z
N
h0(·))], (16)
we define estimators for the three terms above via
b
QNE def= 1
nE nE
X
i=1
(f(X[Ni](·))−f(ZhNL,[i](·))),
b
QNℓ def= 1
nℓ nℓ
X
i=1
(f(ZhNℓ,[i](·))−f(ZhNℓ−1,[i](·))), for ℓ∈ {1, . . . , L},
b
QN0 def= 1
n0
n0
X
i=1
f(Zh0,N [i](·)),
(17)
so that
b
QN def= QbNE + L
X
ℓ=1
b
QNℓ +QbN0 (18)
is an unbiased estimator for E[f(XN(·))]. Here, QbN
E uses the coupling (12)–(13) between exact paths and tau-leaped paths of stepsize hL, QbN
ℓ uses the coupling (14)–(15) between tau-leaped paths of stepsizeshℓ and hℓ−1, andQbN0 involves single tau-leaped paths of stepize
h0. Note that the algorithm implicit in (18) produces an unbiased estimator, whereas the
estimator is biased if QbN
E is left off, as will sometimes be desirable. Hence, we will refer to estimator QbN in (18) as the unbiased estimator, and will refer to
b
QNB
def = L X ℓ=1 b
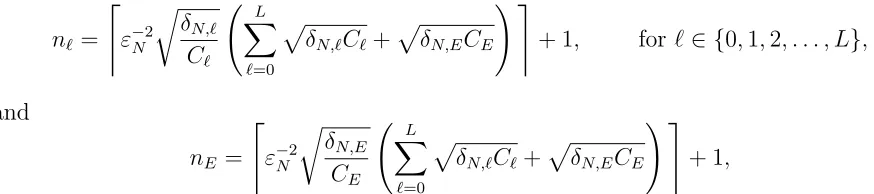
as the biased estimator. For both the biased and unbiased estimators, the number of paths at each level, n0,nℓ andnE, will be chosen to ensure an overall estimator standard deviation of εN.
We consider the biased and unbiased versions of tau-leaping multilevel Monte Carlo separately.
Biased multilevel Monte Carlo tau-leaping
Here we consider the estimator QbN
B defined in (19). By Assumption 2 |E[f(XN(·))]− E[f(ZN
hL(·))]| = Θ(hL). Hence, in order to control the bias we begin by choosing hL = εN and so L= Θ(log(1/εN)) = Θ(logN).
For ℓ ∈ {1, . . . , L}, let Cℓ be the expected number of random variables required to generate a single pair of coupled trajectories at level ℓ and let δN,ℓ be the variance of the relevant processes on level ℓ. Let C0 be the expected number of random variables required
to generate a single trajectory at the coarsest level. To findnℓ, ℓ∈ {0, . . . , L}, we solve the following optimization problem, which ensures that the variance of QbN
B is no greater than
ε2
N:
minimize nℓ
L
X
ℓ=0
nℓCℓ, (20)
subject to L
X
ℓ=0
δN,ℓ
nℓ
=ε2N. (21)
We use Lagrange multipliers. Since we have Cℓ = K ·h−ℓ1, for some fixed constant K, the optimization problem above is solved at solutions to
∇n0,...,nL,λ L
X
ℓ=0
nℓK·h−ℓ1+λ L
X
ℓ=0
δN,ℓ
nℓ −
ε2N
!!
= 0.
Taking derivatives with respect tonℓ and setting each derivative to zero yields,
nℓ =
q
λ
KδN,ℓhℓ, for ℓ∈ {0,1,2, . . . , L} (22) for some λ≥0. Plugging (22) into (21) gives us,
L
X
ℓ=0
r
δN,ℓ
hℓ =
q
λ K ·ε
2
N (23)
and hence by Assumption 3
q
λ K =
L
X
ℓ=0
q
δN,ℓ
hℓ ≤CLε
−2
N N−
1/2, (24)
where C is a constant. Noting that L= Θ(log(ε−1
N )), we have λ
K = Θ ε−
4
N (logεN)2N−1
Plugging this back into (22), and recognizing that at least one path must be generated to achieve the desired accuracy, we find
nℓ = Θ(ε−N2N−1hℓL+ 1).
Hence, the overall computational complexity is
L
X
ℓ=0
nℓKh−ℓ1 = Θ L
X
ℓ=0
ε−2
N N−1hℓLh−ℓ1+ L
X
ℓ=0
h−1
ℓ
!
= Θ ε−2
N N−1(logεN)2+ε−N1
= Θ N2α−1(logN)2+Nα,
recovering row six of Table 1.
Note that the computational complexity reported for this biased version of multilevel Monte Carlo tau-leaping is, up to logarithms, the same as that for multilevel Monte Carlo on the diffusion approximation. However, none of the generous assumptions we made for the diffusion approximation were required.
Unbiased multilevel Monte Carlo tau-leaping
The first observation to make is that the telescoping sum (16) implies that the method which utilizes E[f(XN(·))−f(ZN
hL(·))] at the finest level is unbiased for any choice of hL. That is, we are no longer constrained to choose L= Θ(|logεN|).
Assume that hL ≥ N−1. Let CE be the expected number of random variables required to generate a single pair of the coupled exact and tau-leaped processes when the tau-leap discretization is hL. To determinenℓ and nE, we still solve an optimization problem,
minimize nℓ
L
X
ℓ=0
nℓCℓ+nLCE, (25)
subject to L
X
ℓ=0
δN,ℓ
nℓ
+δN,E
nE
=ε2N, (26)
where Cℓ and δN,ℓ are as before and δN,E =Var(f(XN(·))−f(ZhNL(·))). Using Lagrange multipliers again, we obtain,
nℓ =
r
λδN,ℓ
Cℓ
forℓ ∈ {0,1,2, . . . , L} (27)
and
nE =
r
λδN,E
CE
. (28)
Plugging back into (26) and noting that by, Assumption 1, Cℓ = Θ(hℓ−1) and CE = Θ(N) yields
√
λ=ε−2
N L
X
ℓ=0
p
δN,ℓCℓ+
p
δN,ECE
!
≤C(Lε−2
N N−1/2+ε−N2
p
Therefore, plugging (29) back into (27) an (28) and noting nℓ ≥1 and nE ≥1, we get
nℓ =
r
λδN,ℓ
Cℓ
+ 1 =O
Lε−2
N N−1+ε−N2
r
hL
N
!
hℓ+ 1
!
forℓ ∈ {0,1,2, . . . , L}
and
nE =
r
λδN,ℓ
Cℓ
+ 1 =O(Lε−2
N N−
3/2h1/2
L +ε−
2
N N−
1h
L+ 1). (30) As a result the total complexity is
g(hL) =O(ε−2
N N−1L2+ε−N2
r
hL
NL+h
−1
L +ε−N2
r
hL
N L+ε
−2
N hL+N)
≤O(ε−2
N N−1L2+ 2ε−N2
r
hL
NL+ε
−2
N hL+ 2N) (since h−L1 ≤N) =O(2ε−2
N N−1L2+ 2ε−N2hL+ 2N). (using that 2ab≤a2+b2) It is relatively easy to show that the last line above is minimized at
hL= 2
(log 2)2NLambertW
N
2/(log 2)2
≈ (log 2)2 2N log
N
2/(log 2)2)
. (31)
Hence, taking hL = Θ(N−1logN), we have (loghL)2 = Θ((logN)2) and this method achieves a total computational complexity of leading order
Θ(ε−2
N N−1(logN)2+εN−2N−1logN+N) = Θ(εN−2N−1(logN)2+N) = Θ(N2α−1(logN)2+N), as reported in the last row of Table 1.
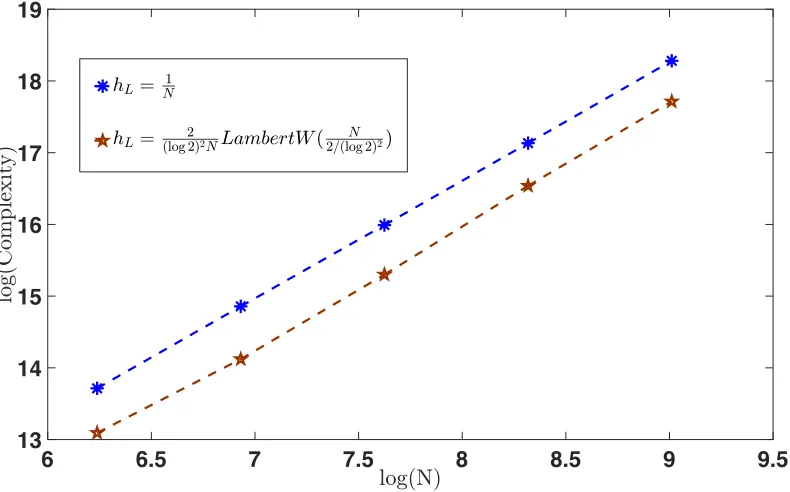
Note here that if we choose hL= N1 we get the same order of magnitude for the compu-tational complexity. However the hL in (31) is the optimized solution, meaning the leading order constant should be better and we will see this in Figure 3 and Figure 4 in the next section.
5
Computational results
In this section we provide numerical evidence for the sharpness of the computational com-plexity analyses provided in Table1. We will measure complexity by total number of random variables utilized. We emphasize that these experiments use extreme parameter choices solely for the purpose of testing the sharpness of the delicate asymptotic bounds.
Example 4. We consider the classically scaled stochastic model for the following reaction
network (see [9])
S1+S2
k1/N ⇄
k2
S3
k3
Letting Xi(t) give the number of molecules of species Si at time t, and letting XN(t) =
X(t)/N, the stochastic equations are
XN(t) =XN(0) + 1
NY1
N k1
Z t
0
X1N(s)X2N(s)ds
−1 −1 1 0 +1
NY2
N k2
Z t
0
X3N(s)ds
1 1 −1 0 +1
NY3
N k3
Z t
0
X3N(s)ds
0 1 −1 1 ,
where we assumeXN(0) →(0.2,0.2,0.2,0.2)T, asN → ∞. Note that the intensity function
λ1(x) = κ1x1x2 is globally Lipschitz on the domain of interest as that domain is bounded
(mass is conserved in this model).
We implemented different Monte Carlo simulation methods for the estimation ofE[XN
1 (T)]
to an accuracy of εN =N−α for both α= 1 and α= 5/4. Specifically, for each of the order one methods we chose a step size of h = εN and required the variance of the estimator to be ε2
N. For midpoint tau-leaping, which has a weak order of two, we chose h = √εN. For the unbiased multilevel Monte Carlo method we chose the finest time-step according to (31). We do not provide estimates for Monte Carlo combined with exact simulation as those computations were too intensive to complete to the target accuracy.
For our numerical example we chose T = 1 and X(0) = ⌈N ·[0.2,0.2,0.2,0.2]T⌉ with
XN(0) = X(0)/N. Finally, we chose k
1 = k2 = k3 = 1 as our rate constants. In Figure 1,
we provide log-log plots of the computational complexity required to solve this problem for the different Monte Carlo methods to an accuracy of εN =N−1, for each of
N ∈ {213,214,215,216,217}.
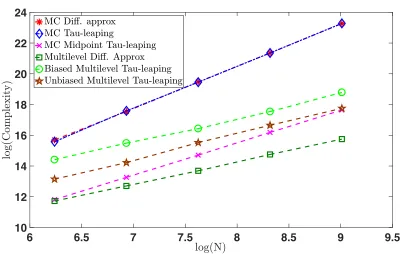
In Figure2, we provide log-log plots for the computational complexity required to solve this problem for the different methods to an accuracy of εN =N−
5
4, for each of
N ∈ {29,210,211,212,213}.
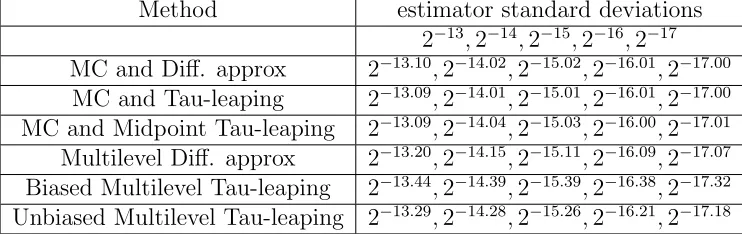
Tables 2 and 3 provide the estimator standard deviations for the different Monte Carlo methods with εN = N−1 and εN = N−
5
4, respectively. The top line provides the target standard deviations.
The specifics of the implementations and results for the different Monte Carlo methods are detailed below.
Diffusion Approximation plus Monte Carlo. We took a time step of size h = εN to
9 9.5 10 10.5 11 11.5 12 10
[image:18.612.103.506.84.342.2]12 14 16 18 20 22 24
Figure 1: Log-log plots of the computational complexity for the different Monte Carlo meth-ods with varying N ∈ {213,214,215,216,217}and ε
N =N−1.
6 6.5 7 7.5 8 8.5 9 9.5
10 12 14 16 18 20 22 24
Figure 2: Log-log plots of the computational complexity for the different Monte Carlo meth-ods with varying N ∈ {29,210,211,212,213} and ε
[image:18.612.103.505.415.669.2]Method estimator standard deviations 2−13,2−14,2−15,2−16,2−17
MC and Diff. approx 2−13.10,2−14.02,2−15.02,2−16.01,2−17.00
MC and Tau-leaping 2−13.09,2−14.01,2−15.01,2−16.01,2−17.00
MC and Midpoint Tau-leaping 2−13.09,2−14.04,2−15.03,2−16.00,2−17.01
Multilevel Diff. approx 2−13.20,2−14.15,2−15.11,2−16.09,2−17.07
Biased Multilevel Tau-leaping 2−13.44,2−14.39,2−15.39,2−16.38,2−17.32
[image:19.612.120.491.74.191.2]Unbiased Multilevel Tau-leaping 2−13.29,2−14.28,2−15.26,2−16.21,2−17.18
Table 2: Actual estimator standard deviations when εN =N−1.
Method estimator standard deviations
εN =N− 5
4 2−11.25,2−12.50,2−13.75,2−15.00,2−16.25 MC and Diff. approx 2−11.27,2−12.51,2−13.75,2−15.00,2−16.25
MC and Tau-leaping 2−11.26,2−12.52,2−13.76,2−15.00,2−16.25
MC and Midpoint Tau-leaping 2−11.26,2−12.52,2−13.76,2−15.00,2−16.25
Multilevel Diff. approx 2−11.46,2−12.63,2−13.85,2−15.06,2−16.29
Biased Multilevel Tau-leaping 2−11.62,2−12.81,2−13.99,2−15.19,2−16.41
[image:19.612.118.491.237.360.2]Unbiased Multilevel Tau-leaping 2−11.34,2−12.57,2−13.79,2−15.03,2−16.26
Table 3: Actual estimator standard deviations when εN =N−5/4.
and Figure 2, where the best fit line is y = 2.73x−1.37, which are consistent with the exponent α in Table 1.
Monte Carlo Tau-Leaping. We took a time step of sizeh=εN to generate our
indepen-dent samples. See Figure 1, where the best fit line is y= 1.96x−1.02, and Figure 2, where the best fit line is y= 2.76x−1.63, which are consistent with the exponent α in Table 1.
Monte Carlo Midpoint Tau-Leaping. We took a time step of size h = √εN. See
Figure 1, where the best fit line is y = 1.44−0.86, and Figure 2, where the best fit line is
y= 2.10x−3.53, which are consistent with the exponent α in Table 1.
Our implementation of the multilevel methods proceeded as follows. We chose hℓ = 2−ℓ and forεN >0 we fixedhL=εN andL=⌈log(hL)/log(2)⌉for the biased methods. For each level we generated N0 independent sample trajectories in order to estimate δN,ℓ, as defined
in section 3. Then we selected
nℓ =
&
ε−2
N
p
δN,ℓhℓ L
X
j=0
s
δN,j
hj
'
+ 1, for ℓ ∈ {0,1,2, . . . , L},
to ensure the overall variance is below the target ε2
N.
Multi-Level Monte Carlo Diffusion Approximation We used N0 = 400 for our
Figure2, where the best fit line isy= 1.45x+ 2.61, which are consistent with the exponent
α in Table 1.
Multi-Level Monte Carlo Tau-Leaping. We used N0 = 100 for our pre-calculation of
the variances. See Figure 1, where the best fit line is y= 1.12x+ 3.70, and Figure 2, where the best fit line isy= 1.56x+4.64, which are, up to a log factor, consistent with the exponent
α in Table 1.
Unbiased Tau-leaping multilevel Monte Carlo. For our implementation of unbiased
multilevel tau-leaping, we set hL = N2LambertW N2
and L = ⌈log(hL)/log(2)⌉. For each level we utilizedN0 = 100 independent sample trajectories in order to estimateδN,ℓ, Cℓ, δN,E, and CE, as defined in section 3. We then selected
nℓ =
&
ε−2
N
r
δN,ℓ
Cℓ L
X
ℓ=0
p
δN,ℓCℓ+
p
δN,ECE
! '
+ 1, for ℓ∈ {0,1,2, . . . , L},
and
nE =
&
ε−2
N
r
δN,E
CE L
X
ℓ=0
p
δN,ℓCℓ+
p
δN,ECE
! '
+ 1,
to ensure the overall estimator variance is below our targetε2
N. See Figure1, where the best fit line is y = 1.08x+ 3.71, and Figure 2, where the best fit line is y = 1.68x+ 2.65, which are, up to a log factor, consistent with the exponentα in Table1.
We also used the unbiased tau-leaping multilevel Monte Carlo method with hL = N−1 to estimate E[X1(1)] to accuracy εN = N−α, for both α = 1 and α = 5/4. See Fig-ures 3 and 4 for log-log plots of the required complexity when hL = N−1 and hL =
2
(log 2)2NLambertW
N
2/(log 2)2
. As predicted in section 4.2.2, the complexity required when
hL= (log 2)2 2
NLambertW
N
2/(log 2)2
is lower by some constant factor.
6
Conclusions
Many researchers have observed in practice that approximation methods can lead to compu-tational efficiency, relative to exact path simulation. However,meaningful, rigorous justifica-tion forwhether and under what circumstances approximation methods offer computational benefit has proved elusive. Focusing on the classical scaling, we note that a useful analysis must resolve two issues:
(1) Computational complexity is most relevant for “large” problems, where many events take place. However, as the system size grows the problem converges to a simpler, deterministic limit that is cheap to solve.
[image:20.612.76.513.242.339.2]9 9.5 10 10.5 11 11.5 12 13
[image:21.612.94.504.87.335.2]13.5 14 14.5 15 15.5 16 16.5 17
Figure 3: Complexity comparison of unbiased multilevel Monte Carlo tau-leaping when
hL= N1 and hL = (log 2)2 2
NLambertW
N
2/(log 2)2
, with εN =N−1.
6 6.5 7 7.5 8 8.5 9 9.5
13 14 15 16 17 18 19
Figure 4: Complexity comparison of unbiased multilevel Monte Carlo tau-leaping when
hL= N1 and hL = (log 2)2 2NLambertW
N
2/(log 2)2
[image:21.612.109.504.419.665.2]
In this work, we offer what we believe to be the first rigorous complexity analysis that allows for systematic comparison of simulation methods. The results, summarized in Table1, apply under the classical scaling for a family of problems parametrized by the system size,
N, with accuracy requirement N−α. In this regime, we can study performance on “large” problems when fluctuations are still relevant.
A simple conclusion from our analysis is that standard tau-leaping does offer a concrete advantage over exact simulation when the accuracy requirement is not too high, α < 1; see the first two rows of Table 1. Also, “second order” midpoint or trapezoidal tau-leaping improves on exact simulation forα <2; row three of Table1. Furthermore, in this framework, we were able to analyze the use of a diffusion, or Langevin, approximation and the multilevel Monte Carlo versions of tau-leaping and diffusion simulation. Our overall conclusion is that in this scaling regime, using exact samples alone is never worthwhile. For low accuracy (α <2/3), second order tau-leaping with standard Monte Carlo is the most efficient of the methods considered. At higher accuracy requirements, α > 2/3, multilevel Monte Carlo with a diffusion approximation is best so long as the bias inherent in perturbing the model is provably lower than the desired error tolerance. When no such analytic bounds can be achieved, multilevel versions of tau-leaping are the methods of choice. Moreover, for high accuracy (α > 1), the unbiased version is the most efficient as it does not need to take a time step smaller than εN as the biased version must.
Possibilities for further research along the lines opened up by this work include:
• analyzing other methods within this framework, for example, (a) multilevel Monte Carlo for the diffusion approximation using discretization methods customized for small noise systems, or (b) methods that tackle the Chemical Master Equation directly using large scale deterministic ODE technology [24, 25],
• development of tau-leaping methods with weak order greater than two,
• coupling the required accuracy to the system size in other scaling regimes, for example, to study specific problem classes with multiscale structure [11],
• determining conditions on the system for when the diffusion approximation and Euler-Maruyama scheme achieve the Θ(h) bias given in Assumption 2,
• determining wider classes of models and functionalsf for which Assumptions1,2, and
3hold. In particular, most of the results in the literature requireλkto be Lipschitz and for f to be a scalar valued function with domain Zd and bounded second derivatives.
References
[1] D. F. Anderson, A modified next reaction method for simulating chemical systems with time dependent propensities and delays, J. Chem. Phys., 127 (2007), p. 214107.
[2] ,Incorporating postleap checks in tau-leaping, J. Chem. Phys., 128 (2008), p. 054103.
[4] D. F. Anderson and D. J. Higham, Multilevel Monte-Carlo for continuous time Markov chains, with applications in biochemical kinetics, SIAM: Multiscale Modeling and Simulation, 10 (2012), pp. 146–179.
[5] D. F. Anderson, D. J. Higham, and Y. Sun,Complexity of multilevel Monte Carlo tau-leaping, SIAM J. Numer. Anal., 52 (2014), pp. 3106–3127.
[6] D. F. Anderson, D. J. Higham, and Y. Sun,Multilevel Monte Carlo for stochastic differential equations with small noise, SIAM J. Numer. Anal., 54 (2016), pp. 505 – 529.
[7] D. F. Anderson and M. Koyama, Weak error analysis of numerical methods for stochastic models of population processes, SIAM: Multiscale Modeling and Simulation, 10 (2012), pp. 1493–1524.
[8] D. F. Anderson and T. G. Kurtz,Continuous time Markov chain models for chem-ical reaction networks, in Design and Analysis of Biomolecular Circuits: Engineering Approaches to Systems and Synthetic Biology, H. Koeppl, D. Densmore, G. Setti, and M. di Bernardo, eds., Springer, 2011, pp. 3–42.
[9] , Stochastic analysis of biochemical systems, vol. 1.2 of Stochastics in Biological Systems, Springer International Publishing, Switzerland, 1 ed., 2015.
[10] D. F. Anderson and J. C. Mattingly, A weak trapezoidal method for a class of stochastic differential equations, Communications in Mathematical Sciences, 9 (2011), pp. 301–318.
[11] K. Ball, T. G. Kurtz, L. Popovic, and G. Rempala,Asymptotic analysis of mul-tiscale approximations to reaction networks, Annals of Applied Probability, 16 (2006), pp. 1925–1961.
[12] A. F. Bartholomay, Stochastic models for chemical reactions. I. Theory of the uni-molecular reaction process, Bull. Math. Biophys., 20 (1958), pp. 175–190.
[13] ,Stochastic models for chemical reactions. II. The unimolecular rate constant, Bull. Math. Biophys., 21 (1959), pp. 363–373.
[14] M. Delbr¨uck,Statistical fluctuations in autocatalytic reactions, The Journal of Chem-ical Physics, 8 (1940), pp. 120–124.
[15] C. W. Gardiner, Handbook of Stochastic Methods: for Physics, Chemistry and the Natural Sciences, Springer, Berlin, 2002.
[16] M. Gibson and J. Bruck, Efficient exact stochastic simulation of chemical systems with many species and many channels, J. Phys. Chem. A, 105 (2000), pp. 1876–1889.
[17] M. Giles, Multilevel Monte Carlo path simulation, Operations Research, 56 (2008), pp. 607–617.
[19] , Exact stochastic simulation of coupled chemical reactions, J. Phys. Chem., 81 (1977), pp. 2340–2361.
[20] , Approximate accelerated simulation of chemically reacting systems, J. Chem. Phys., 115 (2001), pp. 1716–1733.
[21] P. Glynn and C. han Rhee, Unbiased estimation with square root convergence for SDE models, Operations Research, 63 (2015), pp. 1026–1043.
[22] M. Hutzenthaler, A. Jentzen, and P. E. Kloeden, Strong and weak diver-gence in finite time of Euler’s method for stochastic differential equations with non-globally Lipschitz continuous coefficients, Proceedings of the Royal Society A, 467 (2011), pp. 1563–1576.
[23] M. Hutzenthaler, A. Jentzen, and P. E. Kloeden,Divergence of the multilevel Monte Carlo Euler method for nonlinear stochastic differential equations, Ann. Appl. Prob., 23 (2013), pp. 1913–1966.
[24] T. Jahnke, On reduced models for the chemical master equation, SIAM: Multiscale Modeling and Simulation, 9 (2011), pp. 1646–1676.
[25] V. Kazeev, M. Khammash, M. Nip, and C. Schwab,Direct solution of the chemi-cal master equation using quantized tensor trains, PLOS Computational Biology, (2014).
[26] P. E. Kloeden and E. Platen,Numerical Solution of Stochastic Differential Equa-tions, vol. 23 of Applications of Mathematics (New York), Springer-Verlag, Berlin, 1992.
[27] T. G. Kurtz,The relationship between stochastic and deterministic models for chemical reactions, J. Chem. Phys., 57 (1972), pp. 2976–2978.
[28] ,Strong approximation theorems for density dependent Markov chains, Stoch. Proc. Appl., 6 (1978), pp. 223–240.
[29] , Representation and Approximation of Counting Processes, vol. 42 of Advances in filtering and optimal stochastic control, Springer, Berlin, 1982.
[30] S. C. Leite and R. J. Williams,A constrained Langevin approximation for chemical reaction networks. http://www.math.ucsd.edu/~williams/biochem/biochem.pdf, 2016.
[31] D. A. McQuarrie, Stochastic approach to chemical kinetics, J. Appl. Prob., 4 (1967), pp. 413–478.
[32] E. Renshaw, Stochastic Population Processes, Oxford University Press, Oxford, 2011.
[33] S. M. Ross, Simulation, Academic Press, Burlington, MA, fourth ed., 2006.
[34] D. J. Wilkinson,Stochastic Modelling for Systems Biology, Chapman and Hall/CRC Press, second ed., 2011.