Article
Thermodynamics at Solid–Liquid Interfaces
Michael Frank * and Dimitris Drikakis
Department of Mechanical Aerospace and Engineering, University of Strathclyde, 75 Montrose, Glasgow G11UX, UK; [email protected]
* Correspondence: [email protected]; Tel.: +44-141-574-5087
Received: 3 April 2018; Accepted: 9 May 2018; Published: 12 May 2018
Abstract: The variation of the liquid properties in the vicinity of a solid surface complicates the description of heat transfer along solid–liquid interfaces. Using Molecular Dynamics simulations, this investigation aims to understand how the material properties, particularly the strength of the solid–liquid interaction, affect the thermal conductivity of the liquid at the interface. The molecular model consists of liquid argon confined by two parallel, smooth, solid walls, separated by a distance of 6.58σ. We find that the component of the thermal conductivity parallel to the surface increases with the affinity of the solid and liquid.
Keywords:nanofluidics; thermal conductivity; confinement; phonons; Green–Kubo
1. Introduction
The properties of a thermodynamic system are the result of an amalgamation of molecular interactions. Given a large number of molecules, the microscopic behaviour averages out into seemingly constant material properties, such as thermal conductivity, heat capacity, and viscosity. Most engineering applications deal with systems that are large enough to permit a simplified, averaged perspective of the microscopic structures and processes. Statistical mechanics, the branch of physics that bridges the microscopic world of atoms to the continuum world of material properties, has been a topic of interest primarily to theoretical physicists. Over the last two decades, nanotechnologies and nanomaterials have been applied commercially, and are gradually becoming a prominent branch of engineering. The physical scales associated with nanotechologies prohibit the continuum mechanics approach.
In gases, where molecular interactions are weak, heat is primarily transferred through molecular diffusion, and interactions are modelled by perturbation theory. In electrically conducting solids, such as metals, heat transfer is usually dominated by the transfer of delocalised electrons that are free to move across the atoms of the solid. The strong bonds between solid atoms also allow heat to be transferred through collective vibrations, which are quantum mechanically described by quasiparticles called phonons. The distinct behaviour of gases and solids has been studied extensively using analytical models for the thermodynamics of such systems.
Liquids exhibit more a complex behaviour. The fluidity of liquids is reminiscent of gases, but their density more closely resembles that of solids. While liquids undergo molecular diffusion, the strong molecular interactions enable the transfer of heat through phonons. Of course, the general lack of symmetry and constant deformation of liquids results in a large number of scattering events that give liquids the diffusive and isotropic nature of their heat transfer.
Frenkel [1] was the first to point out that the distinction between solids and liquids is based on loose terminology. While his ideas were perceived as too extreme at the time, a body of experimental work has since validated his theories [2–5]. Recent studies have attempted to establish a phonon-based theory for liquid thermodynamics [6–8] through the derivation of analytical models for the energy and heat capacity of liquids; their predictions are in general agreement with experiments.
Understanding the microscopic behaviour of liquids becomes more important in nanotechnologies, where interfacial effects dominate the system. Solid–liquid interactions introduce liquid stratification close to the solid surface, altering properties such as viscosity [9–11], diffusivity [12], and thermal conductivity [12]. Stratification can also change the vibrational properties of the liquid, which can impact the thermal conductance across an interface [13–16].
In a previous publication [17], we have shown that the component of the thermal conductivity of a confined liquid parallel to a smooth surface is significantly greater than the thermal conductivity of its bulk equivalent. We attributed this increase to the greater phonon mean free path, a result of the greater structural order and larger relaxation time of liquids in the vicinity of the wall.
In this paper, we investigate how the the strength of the solid–liquid interactions affects the propagation of phonons, and thermal conductivity within a nanochannel. A more comprehensive analysis is presented, and the implications, as well as future considerations of the solid-like behaviour of liquids is discussed.
2. Theory of Phonons
Atoms in a solid are bounded by each other through an energy potential. A frequently used analogy is that of masses connected by springs. Perturbing an atom leads to waves travelling at the speed of sound, transferring heat across the crystal lattice. Assuming relatively small displacements, we can decompose the system into a number of harmonic oscillators. These vibrational modes will have different frequencies, wavenumbers, and polarizations. Waves oscillating perpendicular to the direction of propagation are called transverse waves, whereas waves oscillating in the same direction as that of propagation are called longitudinal waves.
The energy of a classical oscillator is a continuous function of the amplitude of oscillation. However, quantum mechanically, systems bounded by a potential can only assume discrete values of energy. The energy of a quantum harmonic oscillator is given by:
E(ω) = ̵hω(1
2+n), n=1, 2, 3..., (1)
whereωis the angular frequency; andnis the quantum number of the oscillator. The discretized nature of the energy permits a different interpretation: we can view the energy of a vibrational mode with a ground state 12h̵ω, as the contribution ofnparticles, each of which has an energy̵hω. These particles are called phonons.
Phonons are bosons, and as such are described by the Bose–Einstein function according to which the expected number of phonons occupying a single vibrational mode is given by:
n(ω) = 1 exp(̵hω
κBT) −1
, (2)
whereTis the temperature; andκBis the Boltzmann constant.
Substituting Equation (2) into (1) and considering all vibrational modes, the total energy of the system yields:
E= ∑ ω
= ̵hω ⎡⎢ ⎢⎢ ⎢⎢ ⎣ 1 2+
1
exp(̵hω κBT−1)
⎤⎥ ⎥⎥ ⎥⎥ ⎦
. (3)
The heat capacity of a system can then be calculated by
CV = ∂E
∂T. (4)
is the ideal gas constant. However, for many materials, the model is accurate only for temperatures much higher than room temperature, thus rendering the approximation impractical.
More elaborate models consider the distribution of the possible energy states of the system across the available vibrational frequencies. This is formally described by the phonon density of states,g(ω), where the number of states within an infinitesimal increment of the frequency isg(ω)dω. The total energy is given by
E= ∑ i
g(ωi)n(ωi). (5)
The harmonic approximation provides an asymptotic limit, but is, in general, non-physical. Even in atomically flawless crystals, phonons will scatter at the boundaries of the solid. The harmonic approximation does not consider scattering events and phonons are considered to propagate uninterrupted. The phonon mean free path—the average distance travelled by a phonon prior to scattering—is infinite, thus resulting in an infinite thermal conductivity.
Anharmonicities can be taken into account by including higher order terms in the Taylor series expansion of the potential. The coefficient of thermal expansion is a good indicator of the anharmonic behaviour of a system: greater coefficients correspond to a more anharmonic behaviour. The large displacements of liquid atoms result in a large number of scattering events, as indicated by the significantly greater coefficients of thermal expansion, compared to those of solids.
Recent studies [6–8] have discussed the extension of the phonon theory for solids to liquids. They have treated anharmonicities by considering the thermal expansion coefficients of liquids. Based on Frenkel’s theory [1], shear waves with a frequency smaller thanτ1 were ignored, whereτis the liquid relaxation time.
3. Methodology
The computational model consists of liquid argon confined in a channel of nanometer characteristic dimensions. The walls of the channel are fixed perpendicular to they-direction (parallel to thexzplane) with dimensions in thex- andz-directions beingLx=14.14σandLz=16.33σ, respectively, whereσdenotes the molecular diameter of liquid argon (≈0.3405 nm).Ly, the distance separating the walls, is set to 6.58σ. Periodic boundary conditions are used along thex- andz-directions, emulating the perpetual continuation of the channel. In they-direction, the boundaries coincide with the walls and fixed boundary conditions are used. Each of the two walls consists of two(111)−oriented perfect Face-Center Cubic (fcc) lattice planes with densityρ∗wall=4 mσ−3.
We model the interactions between liquid–liquid and liquid–solid atoms using the Lennard–Jones (LJ) potential:
νijLJ(rij) =4ε[(σ/rij)12− (σ/rij)6], (6) wherei, jare the labels for two arbitrary particles in the system; rij is their interatomic distance; andεdepth of the energy well, and controls the strength of the interaction. For computational efficiency, interatomic interactions beyond a cut-off distancerc=2.2σare disregarded. TheLJparameters for the potential between argon particles areεll =1.0ε=1.6539×10⁻²¹ Jandσll =1.0σ=0.34 nm. The strength of the solid–liquid interaction is a parameter of interest to this study, and varies from 0.4εto 1 ε. Finally, we setσsl=0.75σ. The mass of all atoms was set equal tom=6.69×10⁻²⁶kg. We inserted 1280 argon atoms in the channel, realizing a densityρl=0.84Nσ−3, which along with the temperature T∗=0.7
εk−B1, represents the liquid phase of argon [18,19]. The equations of motion for the particlei are given by
mr¨i= − ∑ i≠j
∇νijLJ(rij). (7)
F= −K(ri−r0), (8) whereKis the wall stiffness, a parameter vital to the realistic representation of the wall. Its value determines the strength of the bonds between the wall’s particles. For the current study, the value K=500eσ−2is used [20].
In order to control the temperature of the system, each of the fcc planes of the walls is assigned a thermostat [21]. The thermostats control the temperature, which is related to the kinetic energy of
the atoms through the equipartition theorem, by multiplying the velocity of each atom with √
T0 T(t),
whereT(t)is the temperature of the current timestep; andT0is the desired temperature. Note that scaling velocities should be avoided on atoms that are directly used for the calculation of properties. Such cases should instead employ the Nose–Hover equations to advance the system within the canonical ensemble (NVT), i.e., the number of atomsN, volume of the systemVand temperatureT remain constant. In this paper, Newton’s equations of motion (Equation (7)) is used to advance the system in time, restricting the system within the microcanonical ensemble (NVE), i.e., the number of atomsN, volume of the systemV, and energyEremain constant. Due to the choice of statistical ensemble and the fact that the wall atoms are not used in the calculations, scaling the velocities of the solid atoms is a simple and accurate approach for retaining the temperature constant. Both channel walls are set to the same temperature,T∗=0.7
εk−B1.
The two techniques for calculating the thermal conductivity using Molecular Dynamics (MD) are the non-equilibrium method and the Green–Kubo (GK) approach. The non-equilibrium method introduces a one-dimensional temperature gradient. The resulting heat flux is then used, in conjunction with Fourier’s law, to calculate the thermal conductivity. However, in nanometer sized samples, applying a temperature difference of the order of 10Kcan lead to non-physical results [22,23].
The GK formalism is based on the fluctuation-dissipation theorem, i.e., the dissipation patterns of the thermal fluctuations of a system in equilibrium are used to calculate the thermal conductivity. The thermal conductivity is calculated by
λ= 1 VκBT2d
∞ ∫
0
⟨J(0).J(t)⟩dt, (9)
whereλis the thermal conductivity;Vis the volume of the system;κBis the Boltzmann constant;dis the number of dimensions of the system; the angled brackets indicate an autocorrelation function; andJis the microscopic heatflux, given by:
J= N ∑ i=1
viEi+
1 2
N ∑ i=1
N ∑ j≠1
rij(Fij⋅vi) −
N ∑ i=1
vih, (10)
wherevi is the velocity of particlei;Ei is the total energy of particlei; Fij is the interatomic force
between particleiand j; andhis the average enthalpy of the liquid, calculated as the sum of the average kinetic energy, potential energy, and viral terms [18,24]. For a system in equilibrium, the Heat Flux Autocorrelation Function (HFACF)⟨J(0).J(t)⟩should eventually decay to zero so that its integral (and therefore the thermal conductivity) has a finite and well defined value. The main issue with this approach is that HFACF is sensitive to statistical noise, which can accumulate significantly. This is particularly true for long correlation lengths that are often required for the HFACF to converge [23,25].
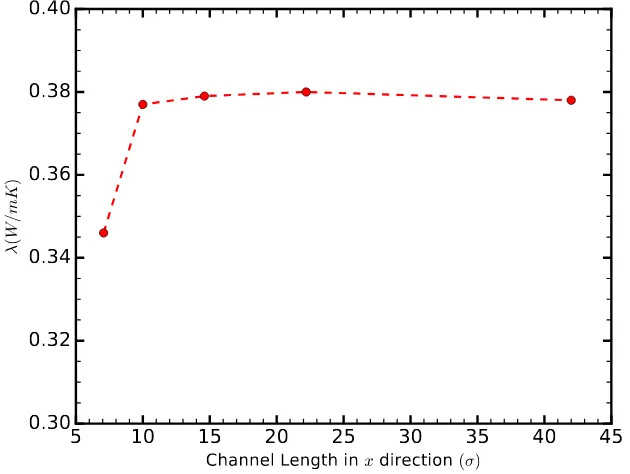
In this study, we calculate the thermal conductivity using the GK formalism, primarily due to the information provided by the HFACF, which sheds light on the heat transfer mechanism. The GK method has been used extensively with periodic boundary conditions [22,23,25]. However, accurate calculations require the size of the simulation box in the direction of the calculation to be comparable to the phonon mean free path McGaughey and Kaviany [23]. In order to reduce size-related uncertainties, we calculated the thermal conductivity for channels of different lengths and found it to converge for lengths greater thanLx=10σ(Figure1).
5 10 15 20 25 30 35 40 45
Channel Length in
x
direction (σ
)0.30 0.32 0.34 0.36 0.38 0.40
λ
(
W/m
K
[image:5.595.130.445.204.441.2])
Figure 1.The thermal conductivity of the liquid in thex-direction as a function of the channel length in the same direction,Lx, for a channel of height 6.58σ, and a strength of solid–liquid interaction
εsl=0.8ε. The thermal conductivity converges for channel lengths greater than 10σ.
The characteristic time of the simulation isτ=σ√mε ≈2.15ps. For the calculation of the thermal conductivity, the simulation step isδt = 0.001τ ≈ 2 f s. An initial equilibration phase of 2×10⁶ δt takes place to allow the temperature and energy of the system to settle. The simulations are then performed for a further 4×10⁷δtand the positions at each timestep are taken from the microcanonical ensemble (NVE). For the calculation of the HFACF, a correlation length of 2×10⁵δtis used giving the autocorrelation function sufficient time to decay.
The Vibrational Density of States (VDOS) are calculated as the Fourier transform of the autocorrelation function of the velocity [27]. For the calculation of the Fourier transform, we have sampled the liquid velocities every 5δt, for a total of 4000δt. Due to the constant restructuring of the liquid particles, the VDOS of the same system would vary slightly between different runs. To reduce such uncertainty, we run each case 10 times, starting with different atomic velocities and positions, and took the average value for each frequency.
4. Results
bulk, and a second, more gradual decay. This two-stage decay, initially observed in crystal solids, encapsulates the diffusive component of the thermal conductivity, as well as the component due to long-range phonons [23].
0
2000
4000
6000
8000
10000
12000
Timestep
0.00
0.05
0.10
0.15
0.20
He
at
Flu
x A
uto
co
rre
lat
ion
6. 58σ
Channel
[image:6.595.147.447.150.385.2]Unconfined
Figure 2.The Heat Flux Autocorrelation Function for bulk and confined liquid argon, forεsl=0.8ε.
Reconstructed from Frank and Drikakis [17].
We have previously shown that the different vibrational properties of confined liquids is due to the ordered liquid structure imposed by the solid surfaces [17]. The thermal conductivity in the direction parallel to the channel wall increases, as a result of the larger phonon relaxation time and mean free path. However, we did not consider the effect of different materials. A first step in doing so is to understand how the nature of the solid–liquid interactions affects the thermal conductivity.
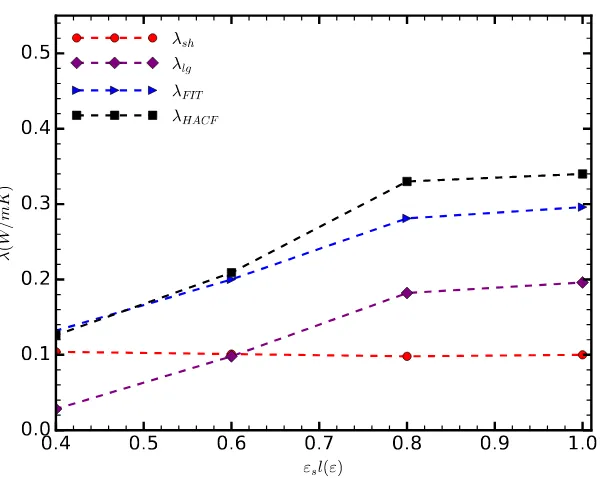
The thermal conductivity, as calculated directly by integrating HFACF, increases along with the strength of the solid–liquid interaction (◾in Figure3). Initially, the thermal conductivity increases linearly. As the adhesive and cohesive forces balance out, i.e.,εsl=1ε, we observe a reduction in the gradient of the thermal conductivity, tending to an asymptotic state; further simulations, however, are required to confirm the above. For the range of cases considered here, the thermal conductivity in the direction parallel to the channel walls increases approximately three-fold compared to the thermal conductivity of bulk argon (0.132 W/mK) [28].
To better appreciate the underlying mechanisms of heat transfer, we decompose the thermal conductivity by fitting a sum of two exponential functions onto the HFACF. This function is given by
⟨q(t) ⋅q(0)⟩ =Ashexp(−t/τsh) +Algexp(−t/τlg), (11)
where the indicesshandlgstand for short-range and long-range, respectively;Aandτare the average strength and relaxation times of phonons in the system. The short-range,λsh, and long-range,λlg, components of the thermal conductivity can then be calculated by
0.4 0.5 0.6 0.7 0.8 0.9 1.0
εsl(ε)
0.0 0.1 0.2 0.3 0.4 0.5
λ
(
W/m
K
)
λ
shλ
lgλFIT
[image:7.595.140.440.88.327.2]λHACF
Figure 3. The component of the thermal conductivity in the direction parallel to the surface, as a function of the strength of the solid–liquid interaction. The different curves correspond to the thermal conductivity as calculated by directly integrating HFACF (◾); the thermal conductivity as calculated by
fitting a sum of two exponential functions on the HFACF (◆); and the decomposed short- (●), long-range (◆) components of the thermal conductivity.
As the strength of the solid–liquid interaction increases, the short-range component of thermal conductivity decreases, albeit very slightly (●in Figure3). We attribute this decrease to the adhesive forces immobilizing the liquid atoms, thus reducing molecular diffusion and the associated heat transfer. However, this change is very small and the short range component of the thermal conductivity remains practically equal to that of the unconfined liquid argon.
The correlation between the total thermal conductivity and the strength of the solid–liquid interaction is predominantly due to the contribution of long-range phonons (Figure3). Forεsl=0.4ε, the lowest value considered here,λlgalmost vanishes. Asεslincreases,λlgfollows a trend similar to that of the total thermal conductivity. For values greater thanεsl=0.6ε, the long-range phonons become the dominant mechanism of heat transfer parallel to the channel.
Note the discrepancy (≈6%) betweenλHFACFandλFIT, forεsl=0.8εandεsl=1.0ε. We assume that the fitted values are more precise, as the HFACF is known to accumulate error, particularly when long correlation lengths are used [29]. In fact, fitting has previously been used as a means to filter unwanted noise [25].
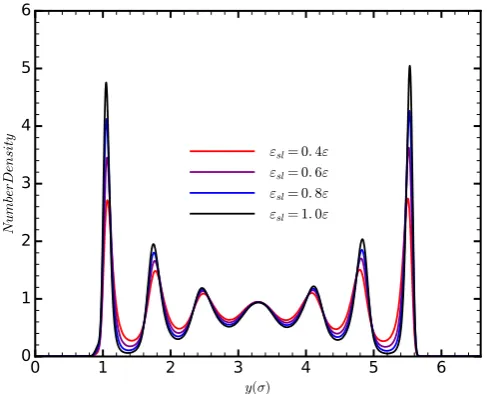
The thermal conductivity is influenced by the number of phonons available in the system, the frequencies of the phonons, and the phonon mean free path. To delineate these effects in our system, and how they contribute to the thermal conductivity, we start by considering the phonon relaxation time,τ, and strength,A, obtained from the fitting Equation (11) on the HFACF data (Figure4). The phonon relaxation time decreases as the strength of the solid–liquid interaction increases. This effect is either due to an increase in the phonon velocity causing the phonon to cover the distance of the mean free path faster, or to an increased occurrence of scattering events, which would reduce the phonon mean free path. Increasing the strength of the solid–liquid interaction increases the density of the liquid layers (Figure5), thus decreasing the interatomic spacing of the liquid atoms. This would decrease the phonon group velocity given byvg=α
√ C
result in an increasing relaxation time. It is more likely that the reduction ofτlgis due to an increased occurrence of scattering events. This claim, however, requires further investigation, as the increasing density of the liquid could also influence the value ofC.
0.4 0.5 0.6 0.7 0.8 0.9 1.0
εsl(ε) 0
1 2 3 4 5 6
Ph
on
on
Re
lax
ati
on
Ti
me
τlg
0 500 1000 1500 2000 2500 3000
Ph
on
on
St
ren
gth
[image:8.595.190.407.142.303.2]Alg
Figure 4.The relaxation time, and strength of the long-range phonons, as a function of the strength of the solid–liquid interaction.
0 1 2 3 4 5 6
y(σ)
0 1 2 3 4 5 6
Nu
mb
erD
en
si
ty
εsl= 0. 4ε εsl= 0. 6ε εsl= 0. 8ε εsl= 1. 0ε
Figure 5.The density profiles of the liquid for different values of the strength of the solid–liquid interaction.
While the relaxation time decreases, the phonon strength increases. For the values ofεslconsidered here,Aincreases in a linear fashion. This suggests a change in the vibrational properties of the liquids.
[image:8.595.172.416.360.557.2]effects of scattering overcome the constructive effects of the additional phonon modes, and the thermal conductivity starts to decrease. We expect a similar behavior here. As the affinity of the solid and liquid continues to increases, the thermal conductivity will eventually plateau or even decrease.
0 1 2 3 4 5 6
Frequency(THz)
0 1 2 3 4 5 6 7
V
DO
S
[image:9.595.173.415.146.341.2]εsl= 0. 4ε εsl= 0. 6ε εsl= 0. 8ε εsl= 1. 0ε
Figure 6.The vibrational density of states for different values ofεsl.
This study highlights a number of directions for further pursuit. For example, the effects of temperature of the system on the thermal conductivity of the liquid require further elucidation. On the one hand, the additional energy corresponding to a higher temperature could excite additional phonon modes, thus increasing the thermal conductivity. On the other hand, an increasing temperature could have a negative effect on the thermal conductivity by increasing Umklapp scattering, or by breaking the structure of the liquid layers next to the solid walls.
Other solid properties, such as the density and crystallographic direction of the solid surface, can also affect the density profiles of the liquid in a fashion similar to the strength of the solid–liquid interaction [32]. Would a similar change in the density profiles, resulting by changing these different properties, produce a similar change in thermal conductivity?
Although the viscoelastic nature of confined liquids in smooth geometries has been demonstrated experimentally, will this behavior persist in the presence of surface roughness? Recent studies have shown that wall irregularities break down the liquid layers close to the solid [33], altering the thermodynamic properties of the liquid such as viscosity at the interface [11].
Finally, how does the behavior of phonons in confined liquids affect other thermodynamic properties or flow dynamics, which have already been shown to differ in nanochannels [12]? Can this theory fit in the broader theme of micro- and nano-fluidics and build upon existing mathematical frameworks [34] on the behavior of such systems?
5. Conclusions
Using MD simulations, we have investigated the effect of the strength of the solid–liquid interaction on the component of the thermal conductivity of a confined liquid parallel to the channel walls. The main findings of the paper are summarized below:
2. We attribute the observed increase of the thermal conductivity to a larger number of phonon states available in the system. The thermal conductivity does not, however, follow the trend of the VDOS. We attribute this to the Umklapp scattering, which is known to increase as the number of phonons increases. Scattering events have a negative effect on thermal conductivity; this is probably the reason for the decreasing slope of the thermal conductivity forεsl>0.8ε.
3. We speculate that as the strength of the solid–liquid interaction further increases and more phonon modes become available, an increase in scattering will cause the thermal conductivity to reach an asymptotic state and even decrease. A similar phenomenon is observed with respect to the temperature effects on the thermal conductivity of CNTs.
Subject to further investigation, we believe that a deeper level of understanding of the thermodynamics and heat transfer at solid–liquid interfaces can have an impact in engineering and industry. A direct application would be for the design of more efficient nano-channel heat sinks. As thermal management is currently a bottleneck for adding or improving the functionality of high demanding applications, such as avionics, better cooling techniques could have a significant impact on these industries. Extending our findings to the broader theme of nanofluidics could also provide tools for optimizing nanotechnologies, which would benefit a wide range of different industries.
Author Contributions: Both authors contributed equally in the preparation of the computational model, the analysis of the results, and the writing of the paper.
Acknowledgments:Results were obtained using the EPSRC-funded ARCHIE-WeSt High Performance Computer
(www.archie-west.ac.uk). EPSRC Grant No. EP/K000586/1.
Conflicts of Interest:The authors declare no conflict of interest.
References
1. Frenkel, Y.I.Kinetic Theory of Liquids; Dover Publications Inc.: Mineola, NY, USA, 1955.
2. Copley, J.R.D.; Rowe, J.M. Short-wavelength collective excitations in liquid rubidium observed by coherent neutron scattering. Phys. Rev. Lett.1974,32, 49–52. [CrossRef]
3. Grimsditch, M.; Bhadra, R.; Torell, L.M. Shear waves through the glass-liquid transformation.Phys. Rev. Lett. 1989,62, 2616–2619. [CrossRef] [PubMed]
4. Pilgrim, W.C.; Hosokawa, S.; Saggau, H.; Sinn, H.; Burkel, E. Temperature dependence of collective modes in liquid sodium.J. NonCryst. Solids1999,250–252, 96–101. [CrossRef]
5. Pilgrim, W.; Morkel, C. State dependent particle dynamics in liquid alkali metals. J. Phys. Condens. Matter 2006,18, R585. [CrossRef] [PubMed]
6. Trachenko, K. Heat capacity of liquids: An approach from the solid phase. Phys. Rev. B2008,78, 104201. [CrossRef]
7. Bolmatov, D.; Trachenko, K. Liquid heat capacity in the approach from the solid state: Anharmonic theory.
Phys. Rev. B2011,84, 054106. [CrossRef]
8. Bolmatov, D.; Brazhkin, V.; Trachenko, K. The phonon theory of liquid thermodynamics. Sci. Rep.2012,
2, 421. [CrossRef] [PubMed]
9. Li, L.; Kazoe, Y.; Mawatari, K.; Sugii, Y.; Kitamori, T. Viscosity and wetting property of water confined in extended nanospace simultaneously measured from highly-pressurized meniscus motion.J. Phys. Chem. Lett. 2012,3, 2447–2452. [CrossRef] [PubMed]
10. Markesteijn, A.; Hartkamp, R.; Luding, S.; Westerweel, J. A comparison of the value of viscosity for several water models using Poiseuille flow in a nano-channel.J. Chem. Phys.2012,136, 134104. [CrossRef] [PubMed] 11. Papanikolaou, M.; Frank, M.; Drikakis, D. Effects of surface roughness on shear viscosity. Phys. Rev. E2017,
95, 033108. [CrossRef] [PubMed]
13. Duda, J.C.; English, T.S.; Piekos, E.S.; Soffa, W.A.; Zhigilei, L.V.; Hopkins, P.E. Implications of cross-species interactions on the temperature dependence of Kapitza conductance. Phys. Rev. B 2011, 84, 193301. [CrossRef]
14. Caplan, M.E.; Giri, A.; Hopkins, P.E. Analytical model for the effects of wetting on thermal boundary conductance across solid/classical liquid interfaces.J. Chem. Phys.2014,140, 154701. [CrossRef]
15. Ramos-Alvarado, B.; Kumar, S.; Peterson, G. Solid-liquid thermal transport and its relationship with wettability and the interfacial liquid structure.J. Phys. Chem. Lett.2016,7, 3497–3501. [CrossRef] [PubMed] 16. Wang, X.; Cheng, P.; Quan, X. Molecular dynamics simulations of thermal boundary resistances in a liquid between two solid walls separated by a nano gap. Int. Commun. Heat Mass Transf. 2016,77, 183–189. [CrossRef]
17. Frank, M.; Drikakis, D. Solid-like heat transfer in confined liquids. Microfluid. Nanofluid. 2017,21, 148. [CrossRef]
18. Sarkar, S.; Selvam, R.P. Molecular dynamics simulation of effective thermal conductivity and study of enhanced thermal transport mechanism in nanofluids.J. Appl. Phys.2007,102, 074302. [CrossRef]
19. Li, L.; Zhang, Y.; Ma, H.; Yang, M. Molecular dynamics simulation of effect of liquid layering around the nanoparticle on the enhanced thermal conductivity of nanofluids. J. Nanopart. Res.2010,12, 811–821. [CrossRef]
20. Asproulis, N.; Drikakis, D. Boundary slip dependency on surface stiffness. Phys. Rev. E2010,81, 061503. [CrossRef] [PubMed]
21. Kim, B.H.; Beskok, A.; Cagin, T. Thermal interactions in nanoscale fluid flow: Molecular dynamics simulations with solid–liquid interfaces. Microfluid. Nanofluid.2008,5, 551–559. [CrossRef]
22. Che, J.; Ça ˘gın, T.; Deng, W.; Goddard, W.A., III. Thermal conductivity of diamond and related materials from molecular dynamics simulations. J. Chem. Phys.2000,113, 6888–6900. [CrossRef]
23. McGaughey, A.; Kaviany, M. Thermal conductivity decomposition and analysis using molecular dynamics simulations. Part I. Lennard-Jones argon. Int. J. Heat Mass Transf.2004,47, 1783–1798. [CrossRef]
24. Eapen, J.; Li, J.; Yip, S. Mechanism of thermal transport in dilute nanocolloids. Phys. Rev. Lett. 2007,
98, 028302. [CrossRef] [PubMed]
25. Li, J.; Porter, L.; Yip, S. Atomistic modeling of finite-temperature properties of crystallineβ-SiC: II. Thermal conductivity and effects of point defects.J. Nucl. Mater.1998,255, 139–152. [CrossRef]
26. Frank, M.; Drikakis, D.; Asproulis, N. Thermal conductivity of nanofluid in nanochannels. Microfluid. Nanofluid.2015,19, 1011–1017. [CrossRef]
27. Allen, M.P.; Tildesley, D.J.Computer Simulation of Liquids; Oxford University Press: Oxford, UK, 2017. 28. Müller-Plathe, F. A simple nonequilibrium molecular dynamics method for calculating the thermal
conductivity. J. Chem. Phys.1997,106, 6082. [CrossRef]
29. Barrat, J.L.; Chiaruttini, F. Kapitza resistance at the liquid-solid interface. Mol. Phys.2003,101, 1605–1610. [CrossRef]
30. Marconnet, A.M.; Panzer, M.A.; Goodson, K.E. Thermal conduction phenomena in carbon nanotubes and related nanostructured materials.Rev. Mod. Phys.2013,85, 1295. [CrossRef]
31. Pop, E.; Mann, D.; Wang, Q.; Goodson, K.; Dai, H. Thermal conductance of an individual single-wall carbon nanotube above room temperature. Nano Lett.2006,6, 96–100. [CrossRef] [PubMed]
32. Soong, C.Y.; Yen, T.H.; Tzeng, P.Y. Molecular dynamics simulation of nanochannel flows with effects of wall lattice-fluid interactions. Phys. Rev. E2007,76, 036303. [CrossRef] [PubMed]
33. Papanikolaou, M.; Frank, M.; Drikakis, D. Nanoflow over a fractal surface. Phys. Fluids2016,28, 082001. [CrossRef]
34. Giannakopoulos, A.; Sofos, F.; Karakasidis, T.; Liakopoulos, A. Unified description of size effects of transport properties of liquids flowing in nanochannels.Int. J. Heat Mass Transf.2012,55, 5087–5092. [CrossRef]
![Figure 2.Reconstructed from Frank and Drikakis [17sl = The Heat Flux Autocorrelation Function for bulk and confined liquid argon, for ε 0.8 ε.].](https://thumb-us.123doks.com/thumbv2/123dok_us/1380355.91239/6.595.147.447.150.385/figure-reconstructed-frank-drikakis-autocorrelation-function-conned-liquid.webp)