Laboratory Study of Tidal Turbine Performance in
Irregular Waves
Kate Porter
#1, Stephanie Ordonez-Sanchez
#2, Matthew Allmark
*1, Robert Ellis
*2, Catherine Lloyd
*3, Tim
O’Doherty
*4, Cameron Johnstone
#3#Department of Mechanical and Aerospace Engineering, University of Strathclyde James Weir Building, 75 Montrose Street, Glasgow, G1 1XJ, UK
*School of Engineering, Cardiff University
Queen’s Buildings, The Parade, Cardiff, CF10 3AA, UK
Abstract—Wave loading on tidal turbines is of key concern for determining blade and drive train design loads and the fatigue life of components. Furthermore, irregular waveforms are likely to add complexity to the loading patterns, and represent more realistic conditions. To investigate this issue, a set of laboratory tests was conducted in a large wave-tow facility at CNR-INSEAN, Rome. A 0.9 m diameter three bladed horizontal axis turbine model was fixed to the tow carriage and tested under tow, regular wave-tow and irregular-wave-tow conditions at a range of turbine rotational velocities. Thrust and torque on the blades and rotor were measured dynamically during testing using strain gauges. The control mode was switched between constant speed and constant torque to understand how this influenced turbine power capture and thrust loading, and assess the potential to use control methods to mitigate loading fluctuations. It was found that average power and thrust values were not affected by the control mode or the addition of regular or irregular waves. However, using torque control resulted in increased thrust fluctuations per wave period of the order of 40% of the mean thrust compared to under speed control. Therefore, the operational mode must be taken into consideration.
Keywords
—
Dynamic loading, irregular waves, tidal turbine, tow tank, wave-currentI. INTRODUCTION
Wave loading is an important aspect to consider in the design and operation of tidal turbines. Not only will this affect the peak loads seen by the blades and hence the appropriate design of the turbine components and support structure, but the dynamic nature of this loading will impact the fatigue life of these components. Understanding fluctuations in the power capture due to waves will also be fundamental to successful power conditioning and integration with the electricity grid.
Recent studies have begun to address this important issue, through numerical simulations (e.g. 1-3) and experimental modelling (e.g. 4-8). However, for the most part these studies
have been constrained to regular waveforms, with turbine operation simulated by setting the turbine rotational speed constant in any given flow condition. This has built a knowledge base confirming the significant impact that waves are expected to have on tidal turbines situated in the marine environment. For example, fluctuations of 2-3 times that under current alone were recorded by [4]. [9] demonstrated that waves cause eccentric loading on the bearings, reducing their life, while [10] quantified the effect of waves on the fatigue life of the blades.
The complementary use of numerical and experimental modelling techniques has enabled a broader understanding to be achieved, but there are still obvious gaps between these studies and conditions experienced in the field.
Firstly, waves are unlikely to be regular at tidal energy sites, so questions remain as to the impact that sea states with changing wave heights and periods will have on the turbine loads and power capture. While there are some studies that have simulated irregular sea states in numerical models ([9]), there are very few published results of turbines tested under irregular waves in the laboratory.
Secondly, prototype turbines are usually operated to maintain a constant tip speed ratio to maximise power capture under changing flow conditions. This means that both the torque and rotational speed will vary during operation, and it is not yet understood how simulations under constant speed control can be equated to these operational procedures in the field.
models. Laboratory testing also enables different control modes to be tested more readily than in CFD models.
This work forms part of a wider EPSRC project entitled ‘Dynamic Loadings on Tidal Turbine Arrays’ lead by Cardiff University. The first set of experimental tests conducted as part of this project are discussed, in which regular and irregular wave forms were tested under both speed and torque control modes. Further laboratory programmes will be completed during the project to expand on these preliminary results, and together these will be compared with the CFD and blade
element momentum theory models currently under
development (progress in this respect is reported in [11] and [12]).
II. METHODOLOGY
The laboratory experiments were conducted in the 9 x 3.5 x 220 m wave-tow tank at CNR-INSEAN, Rome over a two week period in November 2017. The test set-up, programme and measurement systems are detailed in this section.
A. Test set-up
Following the method of [5] tests were conducted by attaching a scaled model horizontal axis turbine to the carriage and towing it along the tank, with and without waves. Details of the model turbine design are given in Section II C. Figure 1 shows the turbine installed on the carriage. A 0.105 m diameter stanchion held the turbine rigidly in place, attached by two sets of brackets to the tow carriage. The turbine hub centre was set 1.5 m below the still water surface, and centred in the cross-stream direction. Cables from the turbine were run along the inside of the stanchion and connected to the control and data acquisition systems situated on the carriage. The turbine measurement systems are detailed in Section II D.
Additional measurement systems were employed to monitor the flow conditions during testing. A bank of wave probes was mounted alongside the turbine at a cross-stream distance of 0.35 m, and a Pitot tube and an electromagnetic current meter were mounted on the opposite side of the turbine at cross-stream distances of 1 m and 1.5 m from the turbine hub centre, as shown in Figure 1. Further details of these systems are given in Section II E.
[image:2.595.305.555.475.657.2]a) b)
Fig. 1 Test set-up in the INSEAN wave-tow facility a) horizontal axis turbine mounted on the tow carriage via stanchion b) measurement equipment set-up, 1 = wave probe bank with circled ultrasonic probe used in this analysis, 2 = electromagnetic current meter, 3 = Pitot tube
B. Test programme and procedures
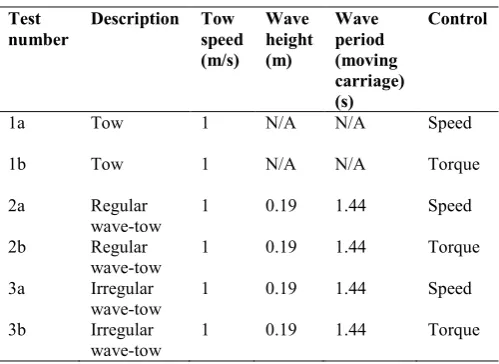
The test programme consisted of tow only, regular wave-tow and irregular wave-tow cases. The tow speed was set equal in each case, and was designed to provide approximately Reynolds independent conditions. The regular and irregular
wave cases were set so that H=HS and T=TP, where H and T are
the wave height and period in regular waves, and HS and TP are
the significant wave height and peak period in the irregular wave case. Therefore, the wave height was limited by the highest peaks in the irregular wave case not exceeding the maximum possible wave height in the facility (0.45 m). A Jonswap spectrum was used for the irregular waves as a starting point to simulating more realistic wave conditions, with relevance to projects in the North Sea. Table I shows the prescribed test parameters.
For each flow condition, tests were run in speed control mode and then in torque control mode, with the set speed and torque values varied between test runs to simulate a range of tip speed ratios for each flow condition.
Repeat tests were conducted where time allowed to check for consistency in the measurement systems and estimate uncertainty in the results.
Prior to each test, a recording was taken with stationary blades and carriage, to check initial readings on the instrumentation. To start a test the desired speed or torque set point was selected and then the carriage was started. Tests were recorded so that at least 100 seconds of data were collected with the carriage running at the desired speed, except for in the wave tests where the longest possible time before reflections from the beach reached the carriage was used. The regular wave tests were initiated with the carriage positioned halfway along the tank, compromising on test length but maximising the time before reflections reached the carriage. This resulted in approximately 30 wave forms or 40 seconds of useable data.
TABLE I TEST DESIGN PARAMETERS
Test number
Description Tow speed (m/s)
Wave height (m)
Wave period (moving carriage) (s)
Control
1a Tow 1 N/A N/A Speed
1b Tow 1 N/A N/A Torque
2a Regular
wave-tow
1 0.19 1.44 Speed
2b Regular
wave-tow
1 0.19 1.44 Torque
3a Irregular
wave-tow
1 0.19 1.44 Speed
3b Irregular
wave-tow
1 0.19 1.44 Torque
2 3
For the irregular waves the test time was maximised to better replicate the Jonswap spectrum, so full carriage runs were completed without mitigating reflections from the beach. While not ideal, this was deemed appropriate for preliminary testing in irregular waves to gain insight and start to build knowledge to feed into further testing campaigns during the project where longer test times and reduced reflections will be possible.
Data acquisition from all streams (turbine, carriage, flow measurement equipment) were synchronised in terms of their start time using a trigger. Data capture was set at 100 Hz for the flow measurement, carriage, rotor and blade strain gauge measurements. Data from the motor itself (torque generating current, rotor speed, rotor position etc.) was sampled at 50 Hz.
C. Model turbine design
A 0.9 m diameter 3-bladed horizontal axis turbine model was developed for the laboratory testing. The blades were 0.385 m in length, giving a hub diameter of 0.13 m. Full details of the model turbine design are given in [13]. To summarise, the turbine is operated by a Bosch Rexroth motor with an encoder to supply the feedback for control. Control algorithms were programmed using LabVIEW so that either the turbine rotational speed or the motor torque could be held constant during a test.
The turbine blades were designed following on from an earlier turbine version employed by the research group which utilised Wortmann FX 63-137 profile blades ([14], [15]). Whereas the original design was tailored to promote self-starting, the new design was optimised with peak power capture in mind, and a Blade Element Momentum Theory model was used to optimise the blade design in terms of twist, pitch and chord (for further details see [16]). The blade root design was selected to provide a smooth transition to the hub, adequate structural support and in order to house the blade root strain gauges.
D. Turbine measurement equipment
To monitor the power capture and forces acting on the blades and rotor, an Applied Measurements thrust and torque transducer was fitted on the driveshaft downstream of the rotor hub and before the bearings. Calibrations were provided for each direction by the manufacturer (thrust and torque). The offset in the calibrations was checked prior to each test run from the recordings with the stationary turbine. This constant was then taken as the actual offset for the calibration for each test, along with the gradient from the supplied calibrations. Noise in the raw thrust signal was removed prior to analysis by using a consistent gradient filter and maximum and minimum cut off values.
Unfortunately due to a wiring error, in this first set of tests measurements could not be obtained in the torque direction from the transducer. Therefore, an estimate for rotor torque was obtained instead from the measured motor torque generating current. To equate this parameter to the rotor torque the turbine was run at different rotational speeds without the blades attached and a calibration equation was obtained.
Each blade root was also strain gauged to measure
out-of-issues, data was lost towards the end of the testing period and so in this paper only the measurements from the roots of blades 2 and 3 are discussed for the tow only and regular wave cases. Unfortunately this data is not available for any of the irregular wave cases. This also prevented calibration of the gauges, so at this stage only the raw blade root bending moment data compared to the offset values recorded with the turbine stationary prior to each test are discussed. Future work will include similar tests with full blade root measurements to extend the conclusions of this study.
E. Flow and wave measurements
The surface elevation during wave tests was measured primarily by using a capacitance type wave gauge placed in-line with the turbine hub in the cross-stream direction. This was calibrated by setting the gauge to a series of known positions in still water.
The average wave height recorded across all regular wave tests was 0.19 m, with a standard deviation of 0.001 m between tests. The average wave period was 1.44 s, with a standard deviation of 0.001 s between tests.
For the irregular wave tests, the records were, as anticipated, rather too short to demonstrate the Jonswap spectrum characteristics. However, considering the records in the time domain and selecting the zero up-crossing points to define each wave period, reasonable agreement between the average wave period and wave height was obtained between repeated test runs. However, greater variations were evident between the repeated records in terms of the maximum and minimum wave periods and wave heights. These properties are given in Table 2.
Note that the average wave period and wave height are smaller than the programmed significant wave height and peak period. The short record lengths meant that the Jonswap spectrum was not evident in the frequency domain, and so in this study the time domain parameters will be considered as the most relevant when comparing the regular and irregular wave cases.
TABLE II
PROPERTIES OF IRREGULAR WAVE TESTS USING ZERO UP-CROSSING METHOD
Test number 3a 3a repeat
3b 3b repeat
Length of data (s) 136 140 135 139
Average wave period (s) 1.25 1.24 1.25 1.29
Maximum wave period (s)
1.83 2.25 1.96 3.14
Minimum wave period (s) 0.25 0.45 0.08 0.58
Average wave height (m) 0.12 0.13 0.12 0.13
Maximum wave height (m)
0.28 0.33 0.30 0.29
Minimum wave height (m)
0.00 0.01 0.00 0.01
loading to be investigated. They will provide a preliminary insight into the possible effects of random wave patterns on the turbine in contrast with regular waveforms. These initial insights will be confirmed in subsequent laboratory programmes where longer run times are possible (i.e. in a wave-current flume).
Tow speed was monitored by the carriage control system, and also using a Pitot tube set at hub height. This provided a basic measurement of horizontal flow speed. However, this did not demonstrate good agreement with the carriage readings, probably because of trapped air in the tubes. Therefore, this data will not be relied upon in the following analysis. The electromagnetic current meter resolution was found to be too coarse to provide insightful readings during these tests and so will not be discussed further.
Instead the carriage velocity reading will be used to provide an average speed, which should suffice considering that wave-current interaction effects should not be present in a tow tank, resulting in zero mean effect on the ‘current’. When investigating the data in the time domain the wave height measurements will be used to represent the flow conditions.
III.RESULTS AND DISCUSSION
The results from the turbine thrust, torque and blade root bending moment measurements are discussed in this section, firstly as averaged over the length of a test, and secondly in the time domain to investigate the size of loading fluctuations caused by waves.
A. Average Performance
The performance curves for the turbine in each flow condition and control mode are shown in Figures 3 and 4. These are plotted as power and thrust coefficients against tip speed ratio to aid comparison with other studies, see [17] for further details of these standard parameters.
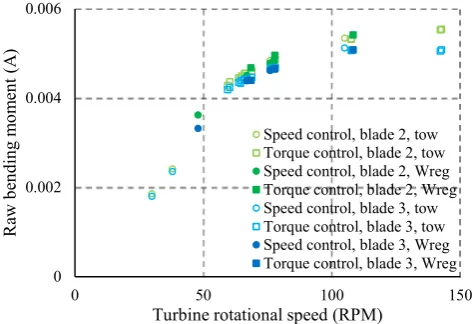
In Figure 5 the raw data for blade 2 and blade 3 root bending moment are given for the tow and regular wave-tow cases compared to rotor rotational velocity. While these are the uncalibrated values, as discussed in Section II D, they do at least give an indication of the general trend, and enable an assessment to be made of the suitability of the measurement technique.
[image:4.595.309.550.53.214.2]In terms of the measurement quality, the low scatter in the data in Figures 3-5 indicates qualitatively that the results are of acceptable quality. Where repeat tests were conducted, for example three tests were run in torque control mode with torque equal to 18 Nm, the standard deviation between these tests was less than 1% of the mean value for each of the coefficient of thrust, coefficient of power, and the raw blade 2 and blade 3 root bending moments. This represents a very low error, demonstrating that the chosen measurement equipment and test set-up/procedures were appropriate for these experiments.
[image:4.595.309.551.247.408.2]Fig. 3 Average coefficient of power versus average tip speed ratio for all test cases
Fig. 4 Average coefficient of thrust versus average tip speed ratio for all test cases
Fig. 5 Average raw blade root bending moment for blades 2 and 3 versus average turbine rotational velocity. Note that no data were available for the irregular wave tests due to a waterproofing fault occurring
0 0.1 0.2 0.3 0.4 0.5
0 2 4 6 8
CP
TSR
Torque control, tow Speed control, tow Torque control, Wreg Speed control, Wreg Torque control, Wirr Speed control, Wirr
0 0.2 0.4 0.6 0.8 1
0 2 4 6 8
CT
TSR
Torque control, tow Speed control, tow Torque control, Wreg Speed control, Wreg Torque control, Wirr Speed control, Wirr
0 0.002 0.004 0.006
0 50 100 150
R
aw
b
en
d
in
g
m
o
m
en
t
(A
)
[image:4.595.309.547.442.604.2]The standard deviation in the rotor rotational velocity measurements where this was set constant (i.e. under speed control) during a test run was found to be low at less than 0.25 RPM (equating to less than 1% of the average rotational velocity in all cases) and this was not affected by running waves.
In the torque control tests, the standard deviation in torque generating current was a little higher at 0.05 A (equates at worst to less than 7% of the mean torque generating current, as the absolute value of standard deviation does not vary with TGC) and similarly this was not altered by adding waves.
When running tow only conditions, the standard deviation in the non-controlled parameter was increased slightly compared to when constrained by the relevant control mode, so that the rotor speed standard deviation was less than 2.10 RPM under torque contro, and the standard deviation in TGC was less than 0.09 A under speed control.
In Figures 3, 4 and 5 the agreement between tests under the same flow condition and in either torque or speed control is excellent. This indicates that the control mode does not significantly affect the average values of power, thrust or blade root bending moment.
The agreement between tow only and regular wave-tow cases is also close in Figures 3, 4 and 5, so that adding waves has not resulted in a change to the average values of power, thrust or blade root bending moment.
When considering the irregular wave cases, there is greater scatter in the average thrust results, so that there is a reduction in thrust coefficient for the repeated torque control. However, the other cases demonstrate good agreement with the regular wave-tow and tow only cases. In terms of the power coefficient, all four irregular wave tests show a small reduction compared to the regular wave-tow and tow only conditions. Greater scatter in terms of the performance curves for the irregular wave tests could be explained by small changes in the average flow velocity. In Figures 3 and 4 the carriage velocity is used to normalise the data, but due to the irregularity of the wave form, and the high level of wave reflections expected due to the longer test runs than in the regular wave cases, this may lead to a small difference between the actual average velocity across the turbine swept area and the recorded carriage speed. This will be considered further in subsequent test campaigns where improved flow measurements will be collected (i.e. with LDV or ADV).
B. Loading fluctuations
While little difference was seen in terms of the average values of power and thrust regardless of running waves or changing the control mode, when designing and operating a tidal turbine, of key interest are the size and frequency of the loading fluctuations. This is of paramount importance for understanding power control, smoothing and integration with the grid, and structural and fatigue design of components such as the blades, driveshaft, generator etc.
Therefore, in this section the results are discussed in terms of the time domain to assess the magnitude of thrust and torque loading fluctuations caused by waves.
When considering the thrust and torque loading patterns, it is clear that the driving compoenent is that of the wave pattern, with predominately a single fluctuation occuring per wave period.
Therefore, in Figures 6, 7 and 8 the average loading fluctuation ranges per wave period are presented, along with the average maximum and minimum values per wave period, compared with the average rotor speed measured for each test. In Figure 6 the variations in the turbine rotational velocity are considered. This applies only to the torque controlled wave tests. It is clear that the size of the fluctuations decreases with average rotor speed, but both maximum and minimum speed increase with increased average speed. Note that there is excellent agreement between the repeated regular wave test in Figure 6a). The fluctuation range is up to 73% of the mean speed.
[image:5.595.306.549.292.625.2]The fluctuations in the irregular wave case are significantly smaller, at 33% of the mean speed, and the agreement between repeated tests is worse, which reflects the greater differences between the test conditions shown in Table II.
Fig. 6 Average turbine rotational velocity fluctuation per wave period (torque control cases only) a) fluctuation range b) average maximum and minimum turbine rotational velocity per wave period
0 20 40 60
0 20 40 60 80 100 120
R
o
to
r
v
el
o
ci
ty
r
an
g
e
(R
P
M
)
Average rotor velocity (RPM) Torque control, Wreg
Torque control, Wirr
a)
0 40 80 120 160
0 20 40 60 80 100 120
R
o
to
r
v
el
o
ci
ty
(
R
P
M
)
Average rotor vlocity (RPM) Torque control, max rpm, Wreg
Torque control, min rpm, Wreg Torque control, max rpm, Wirr Torque control, min rpm, Wirr
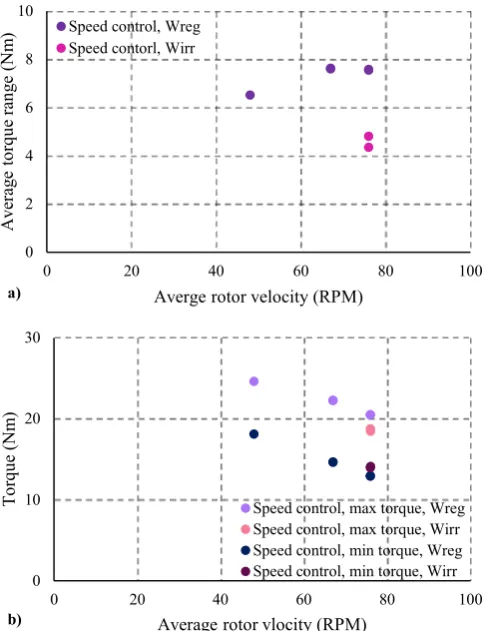
Fig. 7 Average torque fluctuation per wave period (speed control cases only) a) fluctuation range b) average maximum and minimum torque per wave period
In Figure 7 the fluctuations in the torque signals are presented. This relates to the speed controlled wave cases only. There is a modest increase in the torque fluctuation range with rotational velocity (Figure 7a)), with a fluctuation range of up to 45% of the mean torque value in regular waves. This reduces to 30% in the irregular wave case. Note that these Figures are specific to the cases tested, and may in fact ultimately be higher if a greater range of rotational velocities had been tested, but in any case these values give an indication of the substantial loading fluctuations caused by waves.
Figure 8 shows the fluctuations with respect to the rotor thrust signals. This enables both torque and speed control cases to be plotted together. It is clear that the torque control cases induce much larger fluctuations in the thrust than under speed control. The maximum fluctuation size shown in torque control mode is 64% of the mean thrust, and the largest fluctuation size in speed control mode is 29% of the mean. However, these do not occur at the same values of RPM, and it is anticipated that larger fluctuations would occur in speed control mode if higher rotational velocities were tested.
When comparing torque and speed control cases at approximately equal average rotor speeds, the maximum difference between the fluctuation sizes for the test cases shown is 37% compared to the mean thrust at this rotor speed. This demonstrates the significance of the control mode on turbine
behaviour and this will directly impact the design loads and fatigue response of the blades and rotor components.
While speed control causes fluctuations in torque and thrust, and torque control results in fluctuations in rotational velocity and thrust, from Figures 6-8, it appears that the torque control mode results in greater peak thrust values compared to the mean, than the speed control mode causes in terms of the peak torque values compared to mean torque. Therefore, it can be concluded that while power smoothing is desirable, i.e. by reducing torque fluctuations, employing a constant torque control mode will significantly increase the design loads and the size of the dynamic thrust fluctuations that the blades, driveshaft components and support structure must withstand.
[image:6.595.44.287.62.378.2]Also of interest in Figure 8a) is the relationship between thrust fluctuations and RPM, with fluctuation size increasing with RPM in speed control mode, but decreasing with RPM in torque control mode. When considering Figure 8b), the decreasing fluctuation size in torque control mode appears to be a result of increasing minimum thrust values only, with the maximum thrust values staying approximately constant with increasing average rotor speed.
Fig. 8 Average thrust fluctuation per wave period (speed and torque control cases) a) fluctuation range b) average maximum and minimum thrust per wave period
0 2 4 6 8 10
0 20 40 60 80 100
A
v
er
ag
e
to
rq
u
e
ra
n
g
e
(N
m
)
Averge rotor velocity (RPM) Speed control, Wreg
Speed contorl, Wirr
a)
0 10 20 30
0 20 40 60 80 100
T
o
rq
u
e
(N
m
)
Average rotor vlocity (RPM)
Speed control, max torque, Wreg Speed control, max torque, Wirr Speed control, min torque, Wreg Speed control, min torque, Wirr
b)
0 40 80 120 160 200
0 20 40 60 80 100 120
A
v
er
ag
e
th
ru
st
r
an
g
e
(N
)
Average rotor velocity (RPM) Speed control, Wreg
Speed contorl, Wirr Torque control, Wreg Torque control, Wirr
a)
0 100 200 300 400 500
0 20 40 60 80 100 120
T
h
ru
st
(
N
)
Average rotor velocity (RPM) Speed control, max thrust, Wreg
Speed control, min thrust, Wreg Torque control, max thrust, Wreg Torque control, min thrust, Wreg Speed control, max thrust, Wirr Speed control, min thrust, Wirr Torque control, max thrust, Wirr Torque control, min thrust, Wirr
[image:6.595.307.550.303.633.2]Fig. 9 Average thrust fluctuation per wave period versus average wave height, regular versus irregular waves under the same speed or torque set point
In Figure 9, the effect of the difference in average wave height between the irregular and regular wave cases is investigated, by plotting torque control cases with the same torque set point for irregular and regular waves together, and similarly plotting the speed controlled regular and irregular wave cases together with the same speed set point. There appears to be a clear correlation between wave height and thrust range, with fluctuation size increasing with average wave height. This indicates that using average wave height in the irregular cases may provide a good description in terms of characterising at least the average loading fluctuation range.
C. Phasing of loading patterns
To aid in gaining a more fundamental understanding of the relationship between the wave conditions and turbine loads the time histories of the signals were investigated, enabling comparison of the synchronisation of the various signals through time as well as similarities and differences in the dynamic changes.
While the measurements of blade root bending moment, rotor thrust, torque and velocity demonstrated agreement in terms of their phasing, a distinct phase difference between these and the water surface elevation measured in-line with the rotor was evident.
In Figure 10 this phase difference is plotted for regular waves under speed and torque control modes. To provide consistency between these two cases, the thrust signal was compared with the surface elevation to provide an estimate of phase difference.
Due to the variability in these signals, each was phase averaged, and the phase averaged signals were compared to provide an average phase difference from each test. This approach was valid as the phasing did not shift through time over a test run.
In Figure 10 the phase difference between the water surface elevation and thrust signals appears to increase with rotor speed, and there is a distinct change to the phase difference when switching between the torque and speed control modes. There is approximately a 10 degree smaller phase difference when operating with constant torque and variable speed.
The phase difference shown in Figure 10 means that each
80 degrees before the peak in the surface elevation signal, depending on RPM and control mode, which represents a significant lag between the two. This is important to take into account when designing control strategies to reduce loading fluctuations.
Fig. 10 Average phase difference between rotor thrust and water surface elevation signals
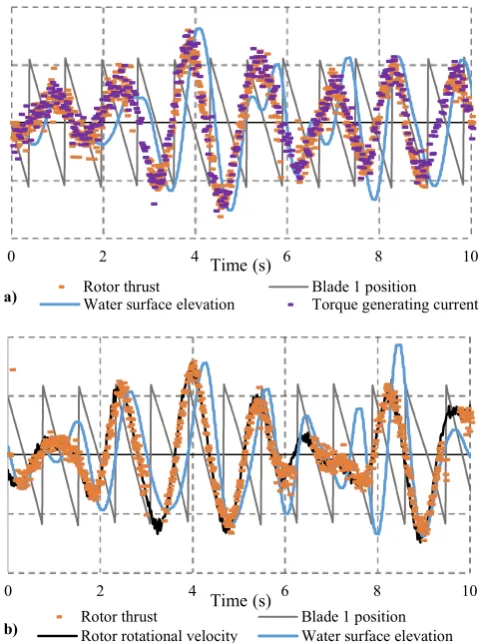
Fig. 11 Comparison of water surface elevation, blade 1 position, rotor thrust, rotor torque (speed control only) and rotational velocity (torque control only) signals in irregular waves a) speed control b) torque control
In terms of the irregular wave cases, these could not be phase averaged due to the variability in wave period through the signal. Instead, the difference in the signals can be investigated
0 40 80 120 160
0 0.05 0.1 0.15 0.2 0.25
A
v
er
ag
e
th
ru
st
r
an
g
e
(N
)
Average wave height (m) Speed control, 76 rpm, Wreg
Speed control, 76 rpm, Wirr Torque control, 15 Nm, Wreg Torque control, 15 Nm, Wirr
0 20 40 60 80 100
0 20 40 60 80 100 120
S
u
rf
ac
e
el
ev
at
io
n
-th
ru
st
p
h
as
e
d
if
fe
re
n
ce
(
d
eg
re
es
)
Average rotor velocity (RPM)
Torque control, Wreg Speed control, Wreg
0 2 4 6 8 10
Time (s)
Rotor thrust Blade 1 position Water surface elevation Torque generating current a)
0 2 4 6 8 10
Time (s)
[image:7.595.308.549.118.267.2] [image:7.595.309.549.310.632.2]by plotting the signals side by side, see Figure 11. Note that each signal has been translated so that its mean is equal to zero, and scaled to provide easier comparison of the peaks.
The phasing between the surface elevation and thrust signals is similar to that in the equivalent regular wave case i.e. speed or torque control, so that the phasing is slightly closer under torque control.
Also noticeable in Figure 11 is that while the thrust, torque and rotor velocity signals follow very similar shapes, there is a degree of smoothing in the thrust, torque and rotor velocity signals compared to the surface elevation signal. This may be considered as a damping effect, potentially due to the inertia of the turbine, so that small, quick fluctuations in the incoming flow do not affect the speed of rotation, and therefore the thrust and torque recorded at the rotor.
IV.CONCLUSIONS
A laboratory study of a three bladed horizontal axis tidal turbine was undertaken in a wave-tow tank. The turbine was tested under tow, regular wave-tow and irregular wave-tow cases, utilizing both constant speed and constant torque control modes. Rotor thrust was measured with a transducer on the drive shaft, rotor torque was estimated from the motor torque generating current and the bending moment at the root of two blades was measured using a full bridge strain gauge arrangement. The main conclusions from the study are as follows:
• The test set-up and methodology were generally
shown to be a success, with low standard deviations in the controlled parameters, and excellent repeatability of measurements
• The control mode did not affect the rotor thrust,
rotor torque or blade root bending moment when considering average values per test run
• Running regular or irregular waves during tow did
not affect the rotor thrust, rotor torque or blade root bending moment measurements compared to tow alone when considering the average values per test run
• Thrust and torque fluctuations were substantial
under both regular and irregular waves cases, with the average peak loads adding up to 30% to the mean value under the conditions tested
• Torque control resulted in significantly larger thrust
fluctuations per wave period than under speed control, for both regular and irregular waves, with up to a 37% increase in the loading range under the conditions tested compared to the mean thrust
• Regular and irregular waves demonstrated similar
average rotor thrust fluctuation ranges per wave period when accounting for the difference in average wave height
• A phase difference was found between the water
surface elevation measured in-line with the rotor and the rotor thrust, torque and rotational velocity signals which were in-phase. This phase difference increased with average turbine rotational velocity,
and the surface elevation peaks occurred after those in the turbine loading signals
• Torque control resulted in approximately a 10
degree reduction in the phase difference between the rotor thrust and water surface elevation signals
• The irregular wave cases demonstrated some
smoothing of the rotor thrust, torque and rotational velocity signals compared to the incoming water surface elevation signal
Recent developments in the research project include completing a further week of testing in a wave-current flume,
with a 2nd week due to be completed in late June to confirm the
findings of this analysis, and extend these results to consider the effects of grid generated turbulence and further irregular wave cases and control strategies. The results will be presented as part of the DyLoTTA project due for completion in late 2019. The results will inform numerical modelling currently being undertaken as part of this project as well as providing new insights into wave-current loading on tidal turbines.
ACKNOWLEDGMENT
This laboratory study was funded under the MARINET 2 programme as part of the DyLoTTA Supergen UKCMER Grand Challenge Project funded by the EPSRC. The authors’ would like to thank the staff at INSEAN for their expertise and support during the testing period.
REFERENCES
[1] S. Tatum, M. Allmark, C. Frost, D. O’Doherty, A. Mason-Jones, T. O’Doherty, “CFD modelling of a tidal stream turbine subjected to profiled flow and surface gravity waves”, International Journal of Marine Energy, 15 (2016) 156-174.
[2] T. Nevalainen, C. Johnstone, A. Grant, “A sensitivity analysis on tidal stream turbine loads caused by operational, geometric design and inflow parameters”, International Journal of Marine Energy, 16 (2016) 51-64. [3] M.A. Holst, O.G. Dahlhaug, C. Faudot, “CFD Analysis of Wave-Induced Loads on Tidal Turbine Blades”, IEEE Journal of Oceanic Engineering, Institute of Electrical and Electronics Engineers (IEEE), Volume 40, (2015) pp. 506-521.
[4] B. Gaurier, P. Davies, A. Deuff, G. Germain, “Flume tank characterization of marine current turbine blade behavior under current and wave loading”, Renewable Energy, 59 (2013) 1-12.
[5] N. Barltrop, K.S. Varyani, A. Grant, D. Clelland, X.P. Pham, “Investigation into wave-current interactions in marine current turbines”, Proc. IMechE Part A: J. Power and Energy, 221 (2007) 233-242.
[6] T.A. de Jesus Henriques, S.C. Tedds, A. Botsari, G. Najafian, T.S. Hedges, C.J. Sutcliffe, I. Owen, R.J. Poole, “The effects of wave–current interaction on the performance of a model horizontal axis tidal turbine”, International Journal of Marine Energy, 8 (2014) 17-35.
[7] P.W. Galloway, L.E. Myers, A.S. Bahaj, “Studies of a scale tidal turbine in close proximity to waves”, 3rd International Conference on Ocean Energy, Bilbao, Spain, 2010.
[8] S. Ordonez-Sanchez, K. Porter, C. Frost, M. Allmark, C. Johnstone, T. O’Doherty, “Effects of wave-current interactions on the performance of tidal stream turbines”, 3rd Asian Wave and Tidal Energy Conference, Marina Bay Sands, Singapore, 2016.
[9] T.M. Nevalainen, “The effect of unsteady sea conditions on tidal stream turbine loads and durability”, PhD Thesis, University of Strathclyde, 2016.
[11] C. Lloyd, T. O’Doherty, A. Mason-Jones, “Development of a wave-current numerical model using Stokes 2nd order theory”, 4th Asian Wave and Tidal Energy Conference, Tapei, Taiwan, 2018 (submitted). [12] S. Ordonex-Sanchez, K. Porter, M. Allmark, C. Johnstone, T.
O’Doherty, “Blade element momentum theory to predict the effect of wave-current interactions on the performance of tidal stream turbines”, 4th Asian Wave and Tidal Energy Conference, Tapei, Taiwan, 2018 (submitted).
[13] M. Allmark, R. Ellis, K. Porter, T. O’Doherty, C. Johnstone, “The development and testing of a lab-scale tidal stream turbine for the study of dynamic device loading”, 4th Asian Wave and Tidal Energy Conference, Tapei, Taiwan, 2018 (submitted).
[14] M. Allmark, “Condition monitoring and fault diagnosis of tidal stream turbines subjected to rotor imbalance faults”, PhD Thesis, Cardiff University, 2016.
[15] A. Mason-Jones, “Performance assessment of a horizontal axis tidal turbine in a high velocity shear environment”, PhD Thesis, Cardiff University, 2009.
[16] R. Ellis, M. Allmark, T. O’Doherty, A. Mason-Jones, S. Ordonez-Sanchez, K. Johannesen, C. Johnstone, “Design process for a scale horizontal exis tidal turbine blade”, 4th Asian Wave and Tidal Energy Conference, Tapei, Taiwan, 2018 (submitted).