Measuring organisational performance using a mix of OR methods
Sérgio P. Santos1
Faculty of Economics and Center for Advanced Studies in Management and Economics (CEFAGE), University of Algarve
Portugal
Valerie Belton University of Strathclyde Department of Management Science
UK
Susan Howick University of Strathclyde Department of Management Science
UK
Martin Pilkington
Ex-employee of HM Revenue & Customs UK
1Corresponding author.
Address:
University of Algarve Faculty of Economics Campus de Gambelas 8005-139 Faro, Portugal
Abstract
Performance measurement has become an increasingly important issue in recent years. In spite of the remarkable progress that has been achieved in this area of research, many performance measurement initiatives fall short of their potential in supporting decision-making. This paper argues that adopting a multi-method approach to assessing performance has the potential to result in more comprehensive and effective performance measurement systems. To support this assertion, the paper discusses the development of a performance measurement system for a Business Tax Department, which combined the use of several operational research (OR) techniques including qualitative system dynamics, data envelopment analysis and multiple criteria decision analysis. The use of these OR techniques was influential in developing and implementing the performance measurement system and has the potential to be transferred to other contexts.
1 – Introduction
Performance measurement has been of interest to both researchers and practitioners for many years, as a result of which several performance measurement frameworks have been proposed and their use extensively documented. The Balanced Scorecard (Kaplan and Norton, 1992) and Data Envelopment Analysis (Charnes et al., 1978) are among the better known frameworks. Although most publications report successful implementation of the adopted methodology, several authors (e.g. Meekings, 1995; McCunn, 1998; Schneiderman, 1999; Neely and Bourne, 2000; Bourne et al., 2002; Van Camp and Braet, 2016) have also highlighted that many performance measurement initiatives have fallen short of their potential to support decision-making. Factors cited as contributing to failure in the implementation of performance measurement systems, include contextual, processual and content issues (Bourne et al., 2002). Several authors have suggested the integration of different methods as a means of addressing some of these issues and enabling more comprehensive and effective performance measurement systems (e.g. Tsang et al., 1999; Howland and Rowse, 2006; Wang, 2006; García-Valderrama et al., 2009; Ferreira et al., 2011; Amado et al., 2012).
The Operational Research/Management Science (OR/MS) literature encompasses several methodologies which have proved very valuable in promoting organisational learning and in guiding decision makers to a more effective and efficient use of information (see, for example, Mingers and Rosenhead, 2004). We support the view expressed by several OR/MS academics (e.g. Dyson, 2000; Francis and Holloway, 2002; Smith and Goddard, 2002; Ackermann et al., 2005) that such techniques have the potential to enhance the design and implementation of organisational performance measurement systems. However, despite these claims, there are few published accounts of the use in practice and insights gained from adopting a multi-method approach to performance measurement and improvement.
This paper aims to contribute to existing literature in two ways. First and foremost it contributes to the literature on performance measurement practice through an in depth discussion of a multi-method approach to the development of a performance measurement system for the United Kingdom (UK) former Business Services and Taxes (BST) department of Her Majesty’s (HM) Customs and Excise to assist in identifying best practice among 7 regions. The case study illustrates the integrated use of several OR/MS techniques, specifically: oval mapping, qualitative system dynamics (SD), data envelopment analysis (DEA) and multiple criteria decision analysis (MCDA). Secondly, through this case study and a review of the literature on performance measurement practice, it contributes to the growing OR/MS literature on mixing methods.
2 - Mixing OR methods to enhance the performance measurement process
Mixing OR/MS methods to gain a deeper understanding of complex problems has been of interest to both researchers and practitioners for many years, and its benefits are well documented in the literature (e.g. Mingers and Brocklesby, 1997; Jackson, 1999; Mingers, 2000; Mingers, 2003; Howick and Ackermann, 2011; Henao and Franco, 2016). As discussed by Munro and Mingers (2002, 2004), a mixed methods approach has been used in many contexts and has taken multiple forms. A number of authors (e.g. Bennett, 1985; Schultz and Hatch, 1996; Mingers and Brocklesbury, 1997; Pollack, 2009; Morgan et al., 2017) have discussed different ways in which different approaches, which can be viewed at the level of methods, methodologies or paradigms, might be combined in a practical intervention.
The different ways of mixing reflect both the temporal nature of the combination and the nature and extent of the integration. From a temporal perspective different approaches might be used in parallel or sequentially, in either case potentially multiply (Pollack, 2009). Integration can take many forms, ranging from no practical integration of methods, simply a comparison of outcomes (Bennett, 1985) through to the creation of a new approach achieved by partitioning and combining elements of distinct methods (Mingers and Brocklesby, 1997). Strategies for integration lying on a spectrum between these two extremes include: complementarity which integrates through one-directional or mutual re-inforcement (Schultz and Hatch, 1996); the enrichment (Bennett, 1985) or enhancement (Mingers and Brocklesby,1997) of one approach by incorporating elements of another or the embedding of one approach within another (Pidd, 2012); and interplay between two approaches which permits both connections and contrasts (Schultz and Hatch, 1996).
At the same time that integration can take multiple forms, it can also address a multitude of problems in different areas. Organisational performance measurement, the focus of the current research, is one of the areas where a mixed methods approach has been proposed (e.g. Santos et al., 2002; Ferreira et al., 2011; Amado et al., 2012). Two different lines of research and practice can be identified. The first explores the combined use of different OR/MS methodologies which were not primarily conceived to assess organisational performance but which can be used to develop standalone performance measurement systems. The second explores the combined use of well established OR performance assessment frameworks, such as DEA, with other OR/MS techniques in order to develop more effective evaluation systems.
Regarding the first line of research, one of the pioneering works on the use of multiple OR techniques to assist the development and implementation of performance measurement systems is that of Suwignjo et al. (2000). They propose the use of cognitive maps and cause and effect diagrams to identify factors affecting performance and explicitly represent their relationships and then, the use of the Analytic Hierarchy Process (AHP) to help managers quantify the relative effects of these factors on organisational performance.
stakeholders. However, rather than using the AHP they propose the Measuring Attractiveness by a Categorical-Based Evaluation Technique (MACBETH).
Other studies using MCDA as part of a multi-method approach aimed at assessing organisational performance include Yurdakul and Íç (2005), Ertuğrul and Karakaşoğlu (2009), Seçme et al. (2009), Sun (2010) and Joshi et al. (2011). All these studies propose the development of organisational performance measurement models based on the combined use of the AHP and TOPSIS (Technique for Order Performance by Similarity to Ideal Solution) methods, either in their original or fuzzy versions. The AHP is used to determine the relative importance (weights) of the different performance indicators and dimensions, and the TOPSIS method to determine the performance scores and rank the units under assessment. Joshi et al. (2011), however, extends the previous works by proposing the use of the Delphi method to identify, synthesise and prioritise the key performance factors and sub-factors prior to the use of the AHP.
Santos et al. (2002, 2008) have also contributed to this area of research by discussing how the use of SD and MCDA, independently and in an integrated manner, can enhance the process of performance measurement and management. The main departure of their work from others relates to the proposal of the use of SD modelling to assist decision makers identify an appropriate set of performance measures, and the integrated use of these two OR methodologies to analyse the performance results and test improvement alternatives. In doing so, they extend the use of OR/MS techniques from the design and measurement stages to the analysis and improvement stages, closing the performance measurement loop.
The second line of research has focused mostly on the integrated use of DEA with other OR/MS methodologies in order to increase the comprehensiveness and effectiveness of the performance measurement process. In this regard, the DEA technique has been combined with both soft and hard OR methodologies.
the use of Decision Trees to assist decision and policy makers discover reasons behind efficient and inefficient DMUs, assess the impact of certain factors on the efficiency levels, and prioritise improvement initiatives, has been proposed by several researchers in the past decade (e.g. Wu, 2006; Wu et al., 2006; Seol et al., 2007, 2008; Samoilenko and Osei-Bryson, 2008; Emrouznejad and Anouze, 2010; Lee, 2010; Sharma and Yu, 2010).
Multicriteria decision analysis methods have also been combined with DEA in several occasions. The relationship between these two methodologies has long been discussed (e.g. Belton, 1992; Doyle and Green, 1993; Stewart, 1996; Athanassopoulos and Podinovski, 1997; Joro et al., 1998; Bouyssou, 1999, Sarkis, 2000) and their similarities have resulted in synergistic developments in both methods as pointed out by Wallenius et al. (2008), and illustrated by André et al. (2010). For example, MCDA methods can be used to find non-radial targets for the DMUs (Korhonen and Syrjänen, 2004) and to incorporate decision makers’ preferences into DEA (e.g. Halme et al., 1999; Gouveia et al., 2008; Almeida and Dias, 2012). On the other hand, when information regarding the decision makers’ preferences is limited or ambiguous, DEA can provide necessary information to allow multicriteria analyses to be performed (e.g. Mavrotas and Triffilis, 2006). Other studies exploring the combination of MCDA and DEA to develop business performance evaluation models include Athanassoupolos (1998), Chen and Chen (2007), Giokas and Pentzaropoulos (2008), Jyoti et al. (2008), Tseng et al. (2009), Yang et al. (2009), Baležentis and Baležentis (2011), Chitnis and Vaidya (2016), Bagherikahvarin and De Smet (2016).
DEA has been combined with MCDA and, separately, MCDA has been combined with SD in interventions to support the design and implementation of a performance measurement system. However, as far as we are aware, the synergistic use of these three techniques in the context of performance measurement has not been documented before. This research represents, therefore, a novel contribution to the field and is of interest to both policy makers and researchers. Further to this, the paper contributes to the growing OR/MS literature on mixing methods and has wider applications beyond the current context.
3 – Designing the Performance Measurement System
3.1 - Institutional and managerial context
Business Services and Taxes (BST) was one of the two main areas of activity of the former HM Customs and Excise Department. The BST department was responsible for the administration, collection and policy of all business taxes, international movements and trade services. It had four functional areas, two with regional management structures: Regional Business Services (RBS), which was the focus of this case study, and Large Business Groups.
efficient and timely manner. One of the targets allocated to the RBS was to demonstrate how the performance of each region was improving compared to the performance of the best region(s).
Prior to the study, management monitoring and control of regional operations was based on performance information relating to the number of events per staff year and costs per event, where events comprised desk and field audits, site visits, and trader contacts in the form of telephone enquiries. While these measures were important, they were insufficient to provide the RBS unit with an overall and balanced view of the performance of the regions. As a consequence, a more comprehensive performance measurement system was needed and a senior staff of the RBS was instructed by the director of this unit to lead the design of the measurement system. It was felt that the new measurement system should promote benchmarking between regions and contribute, ultimately, to the improvement of business processes and work practices.
The research agenda of the case study was mainly guided by the initial objective of the RBS to use DEA, or a similar approach, to assess the relative efficiency of regions as some staff members were aware of the potential of this technique.
Data envelopment analysis, introduced by Charnes, Cooper and Rhodes in 1978 (Charnes et al., 1978), is a linear programming based technique for measuring the relative efficiency of an homogeneous set of organisational units, usually called decision making units (DMUs), which perform similar tasks, and where the presence of multiple inputs and outputs makes comparisons difficult. Since its advent in 1978, DEA has been extensively applied in many sectors and has been the subject of many methodological developments. A comprehensive review of the DEA technique can be found in Cooper et al. (2004).
The fact that DEA has a good record in addressing the type of issue discussed here (i.e. the identification of best practice) means that this technique could have been used on its own, had there been more DMUs. However, the existence of only 7 DMUs to be compared, together with the fact that the RBS team revealed an interest in exploring the sensitivity of the results in terms of variations to the relative importance of the performance measures, led us to use the framework proposed by Belton and Vickers (1993), which integrates the principles of DEA with MCDA, to complement the ‘traditional’ DEA analysis. An oval mapping workshop and qualitative system dynamics modelling underpinned the development of the DEA models. These methods were used to assist the selection of a comprehensive and appropriate set of performance measures and to improve understanding about the dynamic interdependencies between these measures.
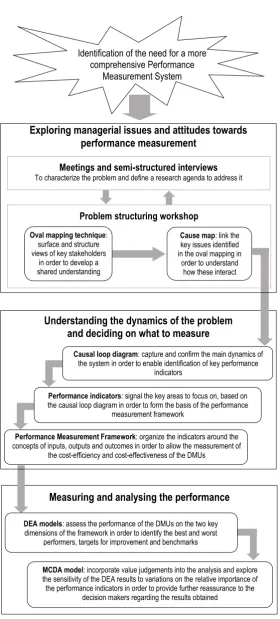
Figure 1 – The performance measurement system design process
Furthermore, due to the extensive experience of the authors in the use of some of these techniques, it was anticipated that their integrated use would provide effective support throughout
Identification of the need for a more comprehensive Performance
Measurement System
Measuring and analysing the performance
DEA models: assess the performance of the DMUs on the two key
dimensions of the framework in order to identify the best and worst performers, targets for improvement and benchmarks
MCDA model: incorporate value judgements into the analysis and explore
the sensitivity of the DEA results to variations on the relative importance of the performance indicators in order to provide further reassurance to the
decision makers regarding the results obtained
Understanding the dynamics of the problem
and deciding on what to measure
Performance Measurement Framework: organize the indicators around the
concepts of inputs, outputs and outcomes in order to allow the measurement of the cost-efficiency and cost-effectiveness of the DMUs
Causal loop diagram: capture and confirm the main dynamics of
the system in order to enable identification of key performance indicators
Performance indicators: signal the key areas to focus on, based on
the causal loop diagram in order to form the basis of the performance measurement framework
Problem structuring workshop Meetings and semi-structured interviews
To characterize the problem and define a research agenda to address it
Oval mapping technique:
surface and structure views of key stakeholders
in order to develop a shared understanding
Cause map: link the
key issues identified in the oval mapping in
order to understand how these interact
the different stages of designing the system and would culminate in an easy to understand approach to performance measurement, especially considering that it would be implemented using visual interactive techniques.
3.2 – Exploring managerial issues and attitudes towards performance measurement
In order to increase our understanding of the system and to define a research agenda to best achieve the objective of evaluating the efficiency and effectiveness of the operations of the 7 regions, we held a series of meetings and semi-structured interviews with members of the BST department. This highlighted the lack of a structured system to measure the performance. Despite the availability of several information systems, the existing measurement efforts in the RBS unit were limited to the collection and reporting of information regarding the number of events per staff year and the activity costs per event. A more comprehensive measurement model was therefore needed to provide the RBS unit with a more holistic and balanced view of the performance of the regions.
The next stage of the research was to explore the broader issue of performance measurement in more detail with the aim of identifying the desirable features of the ‘new’ performance measurement system, including the key performance indicators to monitor. To this purpose it was considered worthwhile to bring together people from each of the regions in a one-day problem structuring workshop. This was attended by 13 participants and all 7 regions were represented. We used the Oval Mapping Technique (OMT) (Eden and Ackermann, 1998) to surface and structure the views of the participants. The morning of the workshop focussed on idea generation and capture, encouraging divergent thinking about the issue, and then initial clustering of ideas according to key issues. The afternoon began with a brief review and examination of the issues which had emerged and then focussed on those areas which were considered to be most important, linking concepts and adding new ideas as these surfaced in discussion. Other areas were tentatively linked by the research team after the workshop.
Figure 2 – Key Concepts
Other maps focusing on specific areas and showing all the relevant details and links to other key issues were also produced. A copy of the maps was sent to all the workshop participants, firstly as a record of the workshop discussion, and secondly to check for correctness and completeness.
The problem structuring process yielded, therefore, valuable information for the BST department regarding attitudes to performance measurement and managerial issues that needed to be recognised in the design and implementation of a performance measurement system.
3.3 – Understanding the dynamics of the problem and deciding what to measure
given that it is the interaction between these loops that determines the dynamics and performance of organisational systems, they can prove very effective in helping to identify appropriate performance indicators and to understand their dynamic relationships (Santos et al., 2002; Santos et al., 2008).
The CLD developed during the case study intervention captured the main dynamics of the problem and highlighted the factors considered instrumental in bringing about change, also known as ‘performance drivers’ or ‘performance levers’. It is important to mention that the problem structuring workshop was not designed with the explicit purpose of developing a qualitative SD model of the performance measurement problem, as this was not a priority of the RBS unit. However, in the belief that such a model could help in the understanding of the issue as feedback seemed to be important, one of the research team members (who observed the workshop) sought to record discussions and to try to understand the basic workings of the system in order to capture these in a CLD. Although there are no specified rules laid down to move from cause maps to causal loop diagrams, the literature discusses some helpful guidelines (e.g. Eden, 1994; Howick et al., 2008) and offers some examples of this transition (e.g. Ackermann et al., 1997; Howick, 2003).
The CLD in Figure 3 depicts the main working dynamics of the RBS unit and some of the major issues that emerged during the workshop and other meetings with staff of the BST department, which had to be taken into consideration in the design of the ‘new’ performance measurement system. The diagram is discussed in what follows.
-Loop 1
-Loop 2
-Loop 4
-Loop 3 Voluntary compliance Well developed tax systems Accuracy of sifting
decisions about who to visit
Local knowledge of what is happening
'on the ground' Tax actually declared/collected
Additional liability found in assurance
events
+
+
Publicity given to the legal prosecution
of tax evaders
Taxpayers' awareness of their rights and obligations
Taxpayers' willingness to comply with tax laws +
+ +
Perception by taxpayers of quality
of service + Staff satisfaction + Clarity and simplicity of administrative systems and procedures + + Assurance events Deterrence of non-compliance + + + + Compliance costs +
Imposition of penalties and/or legal action for
non-compliance
Theoretically correct yield
Tax gap
-+
Taxpayers' perceived risk of detection and
prosecution
+ +
Fairness and efficiency in the delivery of services
Figure 3 – The RBS Unit Causal Loop Diagram
The ultimate goal of the BST department and of its regional management structures was to reduce the tax gap at minimum cost to the Government and to the taxpayers and, in this way, to satisfy the Treasury requirements for effectiveness. The tax gap is defined as the amount of tax that is owed by traders but not voluntarily reported on returns, and its size is estimated by comparing the theoretical tax revenue with the tax actually collected. By theoretical tax revenue (or theoretically correct yield) we mean the amount of revenue that should be collected if there were no tax fraud and no unintentional errors. These concepts, and the way they impact one another, are illustrated in the centre of the CLD in Figure 3.
The measurement of the tax gap, while extremely appealing in theory is, however, very difficult to carry out in practice. Considering that most of the tax gap comes from deliberate tax evasion, to reduce this gap it is necessary to influence traders’ behaviour by encouraging compliance and by deterring and preventing tax evasion. In order to reduce the tax gap it is, therefore, fundamental to increase traders’ willingness to comply with the tax laws.
As illustrated in Figure 3, voluntary compliance can be encouraged by providing information and help to people to make sure that they understand their rights and obligations. It is also the case that high levels of staff satisfaction lead to more professional contacts with taxpayers, increasing the taxpayers perception of the quality of the service, and in turn, enhancing their willingness to comply with the tax laws. However, while traders’ education and staff satisfaction may directly and indirectly influence compliance, there are many other factors that play an important role in taxpayers’ willingness to comply with tax laws. As shown in the CLD, taxpayers’ compliance is promoted not only by awareness of their rights and obligations but also by clear and simple administrative systems and procedures.
When compliance is not achieved voluntarily, the tax authorities must identify and address the risks associated with non-compliance by developing strategies targeted at these risks. These strategies may be of a legislative, educational, or enforcement nature, or any combination of these. Assurance activities within these strategies are fundamental for two major reasons. Firstly, they have a considerable direct effect on the level of compliance, resulting from the additional revenue raised directly from those noncompliant taxpayers brought to account by the assurance practices (see Loop 1 in Figure 3). Secondly, they have a potentially more significant indirect impact on revenue through their preventive and deterrent effects on compliance (see Loop 2 in Figure 3). The preventive effect is defined as the increase in a trader’s declared returns following the assurance action. The deterrent effect, on the other hand, is defined as the increased level of tax declared by traders who are not the direct subject of the assurance.
taxpayers’ perceived risk of detection and prosecution and, ultimately, on the deterrence effect on potentially non-compliant taxpayers (see Loop 4 in Figure 3). It may take time for this deterrent effect to be realised, as there are usually significant delays in the prosecution of tax evaders, and its strength will depend on the publicity given to prosecutions and to their consequences. The appeal of evasion is inversely related to the effectiveness of tax authorities at detecting and pursuing tax evaders.
Coupled with the audit of the traders that are assumed to present a higher risk to the revenue, there is also a greater emphasis on targeted education and advice to newly registered traders in order to assist them to ‘get it right’ the first time, and to encourage them to voluntarily comply with the tax regulations (see Loop 3 in Figure 3). However, as previously suggested, the impact of education can be inhibited by the lack of clear and simple administrative systems and procedures. A well-developed tax system that promotes the dissemination of the tax laws and regulations, and that provides timely and accurate guidance and technical assistance to taxpayers is fundamental to encourage compliance.
It is also important to note that, while tax authorities can improve taxpayers’ compliance by improving their assurance support arrangements (including trader education, and improvements in risk assessment methodologies), there are costs associated with these assurance activities that cannot be neglected. Furthermore, the effectiveness of assurance activities can be affected by factors over which tax authorities have little or no control, such as the clarity of the law, and the ‘leakage’ (time lost) that can occur as a consequence of externally imposed priorities or initiatives, diverting attention from what is done to what should be done.
The increased understanding that the team tasked with developing the performance measurement system (including the staff member of the BST department tasked with its implementation) gained from creating the cause maps and the CLD, proved valuable in making explicit the issues discussed above, and in identifying and selecting the performance measures that would form the basis of the measurement system. The cause maps and the CLD allowed us, among other things, to identify the major performance levers that the regions could control or influence and, at the same time, anticipate the impact that acting on these levers could have on the performance of the organisation. They also allowed us to see how the major factors affecting performance related to each other and provided useful insights about the factors outside the control of the RBS unit that could also influence the performance of the unit.
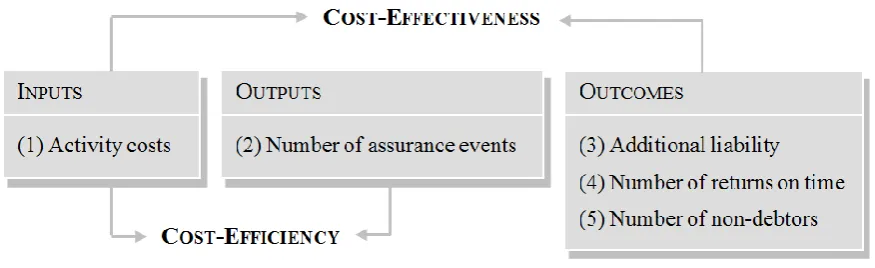
As it was our objective to compare the relative efficiency and effectiveness between the 7 regional management structures of the RBS unit, the performance indicators identified with the CLD were then organised around the concepts of Inputs, Outputs and Outcomes. In what follows we briefly discuss each one of these concepts and the way in which they were combined to derive measures of efficiency and effectiveness.
account the information about input prices. It is important to note that, as illustrated in the CLD, the ultimate goal of the regions was to achieve maximum traders’ compliance at the minimum cost. The inputs are converted into outputs by activities or processes.
The outputs refer to the goods produced or the services provided. Typical output measures in the context of tax administration relate to the workload (e.g., number of traders or tax returns) or to tax control (e.g., number of assurance events). Considering that the number of traders and/or tax returns is almost entirely dependent upon tax legislation, and cannot therefore be significantly influenced by the tax authorities, it was decided that the performance measures related with tax control would provide a more meaningful basis for comparison. Furthermore, as the CLD presented in Figure 3 illustrates, the assurance activities were a major driver of the performance of the regions as they directly and indirectly affected the traders’ compliance levels. In this respect, the number of assurance events carried out by each region was selected as the main output measure.
It is important to note that outputs are seldom ends in themselves, but often means to achieve desired effects. These effects are usually called outcomes. Outcome measures focus on the desired results of actions. They focus on the achievement of the intended objectives. As previously discussed, it is a major objective of any tax authority to increase traders’ compliance and, in this way, reduce the tax gap. Loops 1, 2 and 4 in Figure 3 illustrate how the assurance events act to reduce the tax gap by, directly and indirectly, increasing taxpayers’ compliance. Due to the difficulty of measuring the tax gap, tax authorities usually adopt easier to quantify compliance measures. A typical outcome measure used to assess the direct effect of tax control is the additional revenue resulting from the different types of enforcement activities. The additional liability found in assurance events was therefore regarded as one of the key outcome measures. Other typical outcome measures used to assess voluntary compliance include the number of returns made on time and/or the value of payments made on time. The level of performance achieved in these measures gives an indication of the effectiveness of the assurance activities undertaken by each region, including not only the assurance events but also the targeted education of traders. Due to the difficulty in gathering data regarding the value of payments made on time, the team decided to use the number of returns made on time as another key outcome measure. Additionally, it was also decided to include information about the number of non-debtors as an outcome measure. The assurance activities undertaken by each region influenced the debt amount and/or the number of debtors in two main ways as shown in the CLD. Firstly, the assurance events to ‘debtors’ allowed each region to analyse in detail the debt situation of the traders and to correct eventual mistakes on the part of the tax authorities regarding the debt status of these traders. Secondly, and as previously discussed, the more assurance events carried out by the regions, the higher the additional liability, and consequently the higher the volume of debts and the number of debtors. Although caution needs to be taken when analysing the results regarding this performance indicator, overall, it is expected that the activity of the regional offices would lead to an increase in the number of non-debtor taxpayers’ overtime and, therefore, we decided to include this measure as an outcome measure.
Figure 4 – The performance measurement framework used
3.4 – Measuring the efficiency and the effectiveness of operations
Having identified input, output and outcome measures, the next step was to measure the relative efficiency and effectiveness of the operations of each region. Relative efficiency is defined here as the ratio between outputs and inputs. Using the direct costs of tax control as the input measure, and the number of assurance events as the output measure, we can obtain the unit direct cost for an individual event in each region. A major weakness of this measure of efficiency is that it leaves out important qualitative aspects. Two examples of these qualitative aspects relate to the quality of service delivery and the level of taxpayer satisfaction. These had been very important issues in recent years and the need for their measurement was strongly emphasised by the participants in the workshop. The CLD presented in Figure 3 illustrates these aspects. The quality of the services is important because it increases the taxpayers’ willingness to comply with the tax laws (see bottom-right in Figure 3). Both the quality of the service and the taxpayer satisfaction can be measured, and processes and procedures had been implemented by the BST department to gather information regarding these issues. However, due to some concerns regarding the quality and inter-region comparability of this information, it was decided to exclude these variables from the analysis at the time the study took place.
In addition to relative efficiency, a simple measure was developed of the relative effectiveness of the operations carried out by each of the 7 regions. Following the discussion during the workshop, it was concluded that effectiveness evaluation was concerned with determining whether the assurance activities were achieving their objectives. In this context, the measure evaluates whether the regional offices were encouraging voluntary compliance and, ultimately, reducing the tax gap. Since the measure developed relates outcomes to costs, it is a cost-effectiveness measure.
used as the organisation was interested in identifying not only the best and worst performers, but also in identifying targets for improvement and the benchmarks with which each of the regions could learn. As DEA has had previous success in addressing these types of objectives, and the RBS expressed interest in using this technique, DEA was deemed to be an appropriate method to use.
Considering that the regional offices aimed to deliver the maximum number of services and ensure the maximum compliance with the tax laws, with the available staff and costs, an output-orientation was selected in order to reflect these priorities. Furthermore, a variable returns to scale (VRS) assumption was justified because the regions varied considerably in size, and size was considered an important factor in determining the cost structure of the regional offices. In particular, the discussions that took place during the meetings with the members of the BST department and during the problem structuring workshop with the representatives of the 7 regions suggested that a VRS assumption was more appropriate as it reflects the fact that production technology in the seven regions may exhibit increasing, constant or decreasing returns to scale. A constant returns to scale assumption would have implied that changes in inputs would always lead to proportional changes in outputs in each of the regions, ignoring that economies (or diseconomies) of scale due to size could exist.
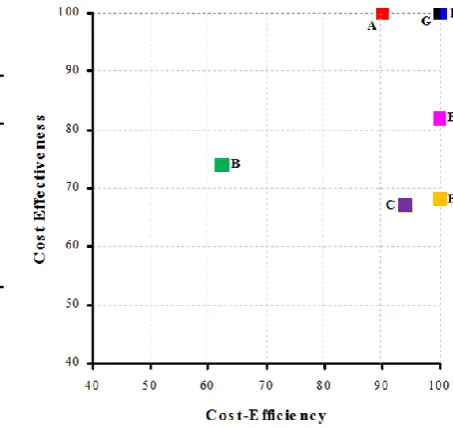
[image:16.595.304.531.434.648.2]The estimated measures of cost-efficiency and cost-effectiveness for the 7 regions using the DEA approach, are shown in Figure 5. The cost-efficient and cost-effective regions are those whose score was 100%, and they were used as benchmarks. Only Regions D and G were simultaneously cost-efficient and cost-effective.
Figure 5 - Cost-Efficiency and Cost-Effectiveness of Regions
One of the advantages of the DEA technique is that it does not impose any assumptions regarding the decision makers’ preferences and value functions. That is, it produces efficiency measures without the need to specify the weights associated with each input and with each output. Specific weights are selected for each region, in order to achieve the highest possible efficiency score. DEA therefore allows total weight flexibility. However, when total flexibility of the weights is allowed it is very common to find that the majority of the performance measures are assigned a close to zero weight. For example, the DEA results show Region G as 100% cost-effective where all the weight was given to the output measure ‘returns on time’. This situation is unsatisfactory, given that the optimal weight associated with the performance measures ‘net additional liability’ and ‘non-debtor traders’ is zero, meaning that these measures were excluded from the cost-effectiveness measurement. However, since effort was put into choosing these performance measures it is inappropriate to allow some of them to be excluded from the performance assessment exercise. Whilst this issue may ultimately not be a problem for the efficient regions, as it is known that the DEA model may yield alternative optimal solutions for the weights of the DMUs classified as efficient (Cooper et al., 2007), it can represent a concern for the inefficient DMUs as alternative optimal solutions for these are rarer. This limitation has long been recognised in the DEA literature and the need to introduce weight restrictions has been proposed by several authors. Allen et al. (1997) provide a good review of the literature regarding the different approaches proposed for the introduction of weight restrictions in DEA. However, as noted by Podinovski (2002), the definition of realistic weight restrictions for a DEA model is not always straightforward and some caution is necessary when interpreting the DEA results obtained from a DEA model with weight restrictions. In addition, it is important to bear in mind that the number of DMUs under analysis is not large enough to allow us to draw robust conclusions with the DEA model. Although there is no optimum number of DMUs to consider, as emphasised by Cooper et al. (2001) a rough rule of thumb which can provide guidance is to choose a value of DMUs n that satisfies n > max {m × s, 3(m + s)} where n is the number of DMUs, m the number of inputs and s the number of outputs.
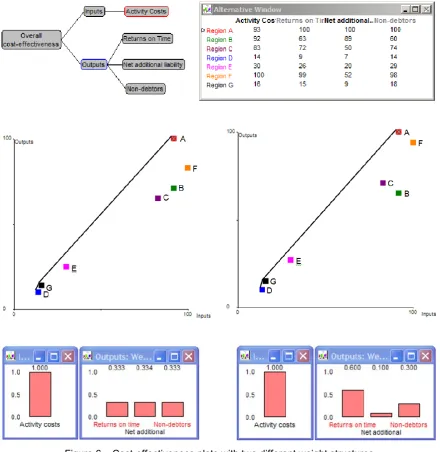
On the basis of the above considerations, and the RBS team’s interest in exploring the sensitivity of the results in terms of variations to the weights, the DEA analysis was complemented by using a MCDA framework as proposed by Belton and Vickers (1993). The framework is based on a simple hierarchical, multiple criteria value function, in which inputs and outputs are decoupled as illustrated in the top-left of Figure 6.It is important to note that the inputs and outputs could be further disaggregated, adding more levels to the hierarchy. In addition, the inputs and outputs are weighted to give the aggregate measures of input and output, which form the basis to the measure of overall performance. Both input and output weights are normalised so that the sum of input and output weights are both 1.
two very different weight structures for Regions D and G. For example, when total flexibility of the weights was allowed, all three outcome measures were used to define the cost-effectiveness score for Region D. However, in the case of Region G all the weight was assigned to the performance measure ‘returns on time’, meaning that the remaining two outcome measures were excluded from the cost-effectiveness measurement. Since the framework adopted to complement the DEA results supports investigation of the impact on a region’s cost-effectiveness of changes in the weight profiles around the optimal solution, we wanted to verify whether ‘more acceptable’ weight distributions from the point of view of the team would still show Region G (and other regions) as a cost-effective region.
Therefore,in order to gather additional evidence regarding the performance of each region and check the robustness of the results to changes in the weights of the performance measures, we developed a MCDA model with one input and three outcomes as used in the DEA analysis. The only input measure considered was the activity costs for each region. The three outcome measures considered were: the number of VAT returns on time, the net additional liability and the number of non-debtors in each region. The Alternative Window at the top right of Figure 6 shows the performance of each region in relation to the selected measures during the financial year analysed. To preserve confidentiality of the regions, the raw data has been transformed to a 0 to 100 scale where zero equates to no activity (e.g. returns on time) and 100 to the highest level of activity (e.g. returns on time) observed in the year.
Initially equal weights were allocated to each of the three outcomes as can be seen in the bar chart at the bottom left of Figure 6. Furthermore, because there was only one input measure, all the input weight was allocated to this measure. The scatter plot, which we refer to as the cost-effectiveness plot, shows aggregate outcome calculated using the displayed weights, plotted against the aggregated input. Cost-effective regions are those which appear on the ‘north-west frontier’ of the plot, that is, those regions which have the highest aggregate outcome for a given aggregate input. If equal weights are attributed to all outcomes, regions A, D and G are classified as cost-effective regions, which supports the DEA results as indicated in Figure 5, suggesting that Region G has a robust performance score as it is a cost-effective region even when all outcome measures are taken into consideration. These results are obtained under the assumption that each of the outcome measures is equally important to the decision makers (i.e. that a unit improvement on each scale is equally valued, where 100 units are defined here by the best performing region on each criterion). However, this assumption is restrictive in the sense that it does not reflect the real value system of the main decision makers. In particular, it had been previously discussed and agreed that the number of returns on time is the most important measure to assess traders’ voluntary compliance, and therefore, this measure should have a higher weight than the other performance measures.
Figure 6 – Cost-effectiveness plots with two different weight structures
all the weight was assigned to the performance measure in which each of these regions performed better when compared to the other regions, they still remained outside the efficient frontier.
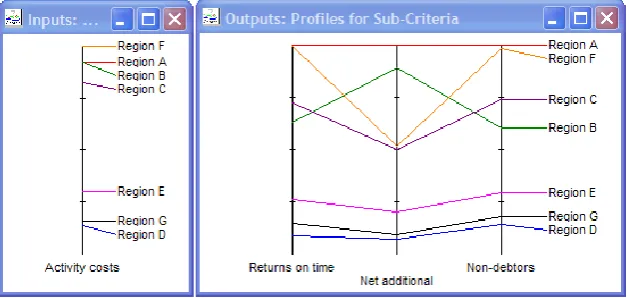
[image:20.595.162.477.227.376.2]Figure 7 shows an input and output profile diagram for the 7 regions. By comparing the performance of Region C with the cost-effective regions closest to C which had similar levels of inputs, we can see that although Region A had higher activity costs than Region C, it generated considerably higher outputs/outcomes. This becomes even clearer when we compare Regions A and B. Region A generated considerably higher outcomes for a ‘similar’ input, which means that whatever the weight distribution, region B would be shown as a cost-ineffective region.
Figure 7 – Input and output profiles
By providing additional evidence regarding the performance status of each region and testing the robustness of the results, the use of the MCDA framework provided further reassurance to the decision makers regarding the results obtained in the previous stages of the intervention. The opportunity to interactively ‘play’ with the model and the visual display of information, were also regarded as major strengths of the framework.
4 - Discussion and Conclusions
Mixing OR/MS methodologies to solve complex management problems has gained prominence in recent years. One of the areas where the multi-method approach has shown considerable potential is that of performance measurement and management. Whilst several studies have documented the mixing of different OR/MS methods to develop performance measurement systems, as far as we know no study has explored the combined use of qualitative system dynamics, data envelopment analysis and multiple criteria decision analysis in this context. This paper shows, through a case study, that by mixing these methods decision makers can develop more comprehensive and effective measurement systems.
both by the objectives and available resources of the organisation: time constraints meant that it was only possible to hold one workshop involving all the regional offices which limited the opportunity for discussion and the lack of data to capture some of the performance measures meant that the models used were very simple. In spite of this, the case study provided a valuable opportunity to test the applicability of the combined use of cause maps, qualitative SD, DEA and MCDA in supporting the RBS unit to develop a performance measurement system and in measuring the performance of its 7 regional management offices.
The performance measurement system design process was broadly carried out in two main stages. Firstly, a problem-structuring workshop was organised to explore the issue of performance measurement in detail. In particular, a mapping process was carried out to capture the key factors driving organisational performance, to promote understanding about their relationships and, ultimately, to help identify an appropriate set of performance measures. Secondly, an evaluation process was developed to compare the performance of the 7 regions by means of the framework described in the previous sections. The results of this and lessons learned were discussed with the BST project leader for the performance measurement study. The use of cause maps, SD, DEA and MCDA was sequential and linear in format, with cause maps and SD being used initially in the problem-structuring stage to capture the main dynamics of the system and to identify the key performance drivers. DEA and MCDA were used at a later stage to compare the performance of the 7 regions.
The process used to design the measurement system was considered useful for several reasons. Firstly, the maps produced during the problem-structuring workshop allowed the team tasked with developing the measurement system to capture the views of all the participants in an easy to understand format. Secondly, the maps enabled the participants to see their own statements and perspectives in the context of those of other participants, and to learn about their interconnectedness. This also provided an effective way of capturing relevant information for future reference. Thirdly, the mapping process increased the team’s understanding about the main workings of the system, which were later captured in a CLD. Cause and effect, feedback loops, and delays were captured by means of the CLD, allowing the members of the working group to improve their understanding about the main processes that determine the organisation’s performance and the dynamics of the system. This was valuable to identify the performance measures that would form the basis of the measurement system and also to gain insights about factors that, although not included in the performance measurement system, could also play an important role in explaining the levels of performance observed.
Both the cause maps and the CLD were valuable in enhancing the group’s shared understanding of the situation, and were, therefore, useful learning tools. They allowed the participants in the workshop and the team tasked with developing the measurement system, to increase their understanding about the mutual dependence of the factors, both inside and outside the control of the regions, which could affect their performance. It is also important to emphasise that the involvement of the participants in the process of developing the performance measurement system promoted their ownership and commitment to the system, increasing their trust in the results obtained. This is fundamental for a successful implementation of a performance measurement system because a genuine commitment to and ownership of the system increases its legitimacy as a decision-supporting tool. In summary, we can conclude that the use of the cause maps and of the CLD was influential at the conceptual level in informing the ‘debate’ on performance measurement.
The performance evaluation process was, in itself, also a valuable learning exercise. The use of the MCDA framework described in the previous sections allowed the working group to easily compare the performance of the 7 regions in a simple and relatively transparent way. The easy to understand graphical performance representations provided by the software, and the possibility to interact with the model, were considered major strengths of the framework. It was felt, however, that it could be advantageous if the user could specify upper and lower bounds on individual weights interactively, which was not possible with the software that was used. A major weakness of the framework was the absence of a measure of efficiency. One of the objectives of the RBS unit was to identify the extent to which individual regions were improving their performance over time towards the best performing region(s), therefore, it was felt by the working group that the DEA technique strengthened the analysis by providing information regarding efficiency/effectiveness scores and efficiency/effectiveness targets.
design and implementation of the performance measurement system. It is well known that promoting managers’ ownership of and commitment to a performance measurement system is fundamental for its successful implementation. Management is ultimately responsible for developing, implementing and using performance measurement systems and this research suggests a framework that can assist them in these tasks. In addition to promoting ownership and commitment, the framework proposed in this research provides in depth support to improve understanding regarding the key interlinkages between the different factors that drive organisational performance and helps decision makers identify an appropriate set of performance indicators. Rather than viewing these as independent, stand-alone elements, the proposed approach allows decision makers to identify the relationships between indicators and the need for co-ordination between the different parts of the system assessed. This exercise can prove highly effective in communicating and explaining to others the key performance drivers that appear to be critical to the success of operations, and the need for their monitoring. Further to helping decision makers define what to measure and why, the proposed framework also offers a structured way to: synthesise the available performance information into a few key indicators of performance and/or into a single indicator of overall performance; highlight areas of performance strength and weakness that can form the basis for improvement initiatives; and explore the robustness of the results to changes in the relative importance of the performance indicators. Overall, the integrated used of the OR/MS techniques proposed may prove invaluable to increase the legitimacy of the performance measurement system as a decision-supporting tool, and consequently, to ensure its successful implementation.
It is important to note, however, that the use of these techniques to support the measurement of performance is not without its own limitations and weaknesses. Firstly, the modelling demands to develop appropriate cause maps, cause and loop diagrams, DEA and MCDA models in terms of data, time and effort should not be underestimated. Furthermore, it is important to consider that the lack of expertise in the techniques discussed within organisations can be a major impediment to their use. This suggests that the engagement of a facilitator/analyst who is knowledgeable about these techniques and skilled in managing group processes can be critical for a successful use of the framework proposed. It also suggests that the framework proposed is most appropriate when performance measurement systems are developed for strategic planning and organisational learning. Secondly, the subjective nature of some of the activities to be performed, for example, the choice of appropriate performance indicators to use in the DEA and MCDA models, is also an issue that needs to be dealt with carefully as it may lead to dispute over the nature of specific results. Although this is an important limitation, it is important to mention that all decision-making is subjective, and therefore, the ability of the techniques we propose to make this subjectivity explicit and to integrate it in a transparent way with objective, measurable data, can be valuable. Furthermore, the possibility of analysing the robustness of the results to changes in the parameters of the models, through a sensitivity analysis, can also help to shed light on the impact of this subjectivity.
time the case study took place. Firstly, it was felt that the inclusion of information regarding the quality of the services provided and the customer satisfaction would have enhanced the quality of the performance measurement system. However, difficulties related with the inter-region comparability of the data collected for these measures prevented their use. Secondly, some of the performance measures were only available on an annual basis and others were difficult to interpret in a time period less than one year. This significantly reduced the potential of the models to evaluate the performance on a regular basis, other than annually. Although the first limitation could be easily overcome by standardising the data collection procedures in each region and by expanding the performance measurement system to include the new performance measures, the second was considerably more difficult.
Overall, while limitations and implementation challenges existed the combined use of the OR/MS techniques discussed was considered very valuable and the BST department was considering the possibility of developing a similar type of framework to measure the performance of local offices. Furthermore, other functional areas within the Customs and Excise department also showed interest in the framework developed.
In future research studies, it is important to explore the applicability of the framework in other settings as the success of the intervention and the insights gained suggest that the combined use of cause maps, qualitative SD, DEA and MCDA proposed in this paper has the potential to inform the development of performance measurement systems and the assessment of performance in many other contexts. Furthermore, considering that the integration of these methods can take multiple forms, other strategies for integration can also be explored and compared to identify which ones provide more valuable in the context of performance measurement.
Acknowledgements
The first author is pleased to acknowledge financial support from Fundação para a Ciência e a Tecnologia (Grant UID/ECO/04007/2013) and FEDER/COMPETE (POCI-01-0145-FEDER- 007659). Acknowledgement is also due to the staff at the former Business Services and Taxes department of Her Majesty’s Customs and Excise that participated in this study for their time and commitment, without which this study would not have been possible. The authors are also grateful to the three anonymous reviewers for their insightful comments and helpful suggestions.
References
Ackermann, F., Belton, V., Shafti, S., Wisniewski, M., 2005. Building a balanced scorecard the OR way. Paper presented at IFORS 2005, Hawaii, USA.
Ackermann, F., Eden, C., Williams, T., 1997. Modeling for Litigation: Mixing Qualitative and Quantitative Approaches. Interfaces 27(2), 48-65.
Allen, R., Athanassopoulos, A., Dyson, R.G., Thanassoulis, E., 1997. Weight restrictions and value judgements in data envelopment analysis: evolution, development and future directions. Annals of Operations Research 73, 13-34.
Amado, C.A., Santos, S.P., Marques, P., 2012. Integrating the data envelopment analysis and the balanced scorecard approaches for enhanced performance assessment. Omega 40, 390-403. André, F.J., Herrero, I., Riesgo, L., 2010. A modified DEA model to estimate the importance of
objectives with an application to agricultural economics. Omega 38, 371–382.
Athanassopoulos, A.D., 1998. Decision support for target-based resource allocation of public services in multiunit and multilevel systems. Management Science 44(2), 173-187.
Athanassopoulos, A.D., Podinovski, V.V., 1997. Dominance and potential optimality multiple criteria models decision analysis with imprecise information. Journal of the Operational Research
Society48, 142–150.
Bagherikahvarin, M., De Smet, Y. (2016). A ranking method based on DEA and PROMETHEE II. Measurement 89, 333-342.
Baležentis, A., Baležentis, T., 2011. Assessing the efficiency of Lithuanian transport sector by applying the methods of MULTIMOORA and Data Envelopment Analysis. Transport 26(3), 263– 270.
Banker, R.D., Charnes, A., Cooper, W.W., 1984. Some models for estimating technical and scale inefficiencies in data envelopment analysis. Management Science 30(9),1078–1092.
Belton, V., 1992. Integrating data envelopment analysis with multiple criteria decision analysis. A. Goicoechea, L. Duckstein, S. Zionts, eds. Proc. IXth Internat. Conf. Multiple Criteria Decision Making. Springer, Berlin, 71–79.
Belton, V., Vickers, S., 1993. Demystifying DEA - A Visual Interactive Approach Based on Multiple Criteria Analysis. Journal of the Operational Research Society 44(9), 883-896.
Bennett, P.G., 1985. On linking approaches to decision aiding: Issues and prospects. Journal of the Operational Research Society 36 (7), 659–669.
Bourne, M., Neely, A., Platts, K., Mills, J., 2002. The success and failutre of performance measurement initiatives - Perceptions of participating managers. International Journal of Operations and Production Management 22(11), 1288-1310.
Bouyssou, D. 1999. Using DEA as a tool for MCDM: Some remarks. Journal of the Operational Research Society 50, 974–978.
Casu, B., Shaw, D., Thanassoulis, E., 2005. Using a group support system to aid input–output identification in DEA. Journal of the Operational Research Society 56(12), 1363–1372.
Charnes, A., Cooper, W.W., Rhodes, E., 1978. Measuring the efficiency of decision making units. European Journal of Operational Research 2(6), 429-444.
Chen, T.Y., Chen, L.H., 2007. DEA performance evaluation based on BSC indicators incorporated: the case of semiconductors industry. International Journal of Productivity and Performance Management 56(4), 335-357.
Chitnis, A., Vaidya, O.S., 2016. Efficiency ranking method using DEA and TOPSIS (ERM-DT): case of an Indian bank. Benchmarking-an International Journal 23(1), 165-182.
Cooper, W.W., Li, S., Seiford, L.M., Tone, K., Thrall, R.M., Zhu, J., 2001. Sensitivity and Stability Analysis in DEA: Some Recent Developments. Journal of Productivity Analysis 15(3), 217-246. Cooper, W., Ruiz, J., Sirvent, I., 2007. Choosing weights from alternative optimal solutions of dual
multiplier models in DEA. European journal of Operational Research 180(1), 443–458.
Cooper, W.W., Seiford, L., Zhu, J., 2004. Handbook on data envelopment analysis. Massachusetts: Kluwer Academic Publishers.
Coyle, R.G., 1996. System Dynamics Modelling: A Practical Approach. London: Chapman & Hall.
Doyle, R.H., Green, J.R., 1993. DEA and MCDM. Omega 6, 713–715.
Eden, C., Ackermann, F., 1998. Making Strategy: The Journey of Strategic Management, Sage, London, pp. 303-320.
Emrouznejad, A., Anouze, A.L., 2010. Data envelopment analysis with classification and regression tree – a case of banking efficiency. Expert Systems – the Journal of Knowledge Engineering 27(4), 231-246.
Ertuğrul, I., Karakaşoğlu, N., 2009. Performance evaluation of Turkish cement firms with fuzzy analytic hierarchy process and TOPSIS methods. Expert Systems with Applications 36, 702-715.
Ferreira, F.A.F., Santos, S.P., Rodrigues, P.M.M., 2011. Adding value to bank branch performance evaluation using cognitive maps and MCDA: a case study. Journal of the Operational Research Society 62, 1320-1333.
Ferreira, F.A.F., Santos, S.P., Rodrigues, P.M.M., Spahr, R.W., 2014a. Evaluating retail banking service quality and convenience with MCDA techniques: a case study at the bank branch level. Journal of Business Economics and Management 15(1), 1-21.
Ferreira, F.A.F., Santos, S.P., Rodrigues, P.M.M., Spahr, R.W., 2014b. How to create indices for bank branch financial performance measurement using MCDA techniques: An illustrative example. Journal of Business Economics and Management 15(4), 708-728.
Ferreira, F.A.F., Spahr, R.W., Santos, S.P., Rodrigues, P.M.M., 2012. A multiple criteria framework to evaluate bank branch potential attractiveness. International Journal of Strategic Property Management 16(3), 254–276.
Francis, G., Holloway, J., 2002. Beyond comparisons—the role for the operational researcher in benchmarking. Journal of the Operational Research Society 53(3), 283–291.
García-Valderrama, T., Muleno-Mendigirri, E., Revuelta-Bordoy, D., 2009. Relating the perspectives of the Balanced Scorecard for R&D by means of DEA. European Journal of Operational Research 196, 1177–1189.
Giokas, D.I., Pentzaropoulos, G.C., 2008. Efficiency ranking of the OECD member states in the area of telecommunications: a composite AHP/DEA study. Telecommunications Policy 32, 672–685. Gouveia, M.C., Dias, L.C., Antunes, C.H., 2008. Additive DEA based on MCDA with imprecise
Information. Journal of the Operational Research Society 59(1), 54—63.
Greasley, A., 2005. Using DEA and simulation in guiding operating units to improved performance. Journal of the Operational Research Society 56, 727–731.
Halme, M., Joro, T., Korhonen, P., Salo, S., wallenius, J., 1999. A value efficiency approach to
incorporating preference information in data envelopment analysis. Management Science45,
103–115.
Henao, F., Franco, L.A., 2016. Unpacking multimethodology: Impacts of a community development intervention. European Journal of Operational Research 253(3), 681-696.
Howick, S., 2003. Using system dynamics to analyse disruption and delay in complex projects for litigation: can the modeling purposes be met?. Journal of the Operational Research Society 54, 222–229.
Howick, S., Ackermann, F., 2011. Mixing OR methods in practice: Past, present and future directions. European Journal of Operational Research 215: 503-511.
Howick, S., Eden, C., Ackermann, F., Williams, T.M., 2008. Building confidence in models for multiple audiences: the modelling cascade. European Journal of Operational Research 186(3),1068-1083.
Howland, M., Rowse, J., 2006. Measuring bank branch efficiency using data envelopment analysis: managerial and implementation issues. INFOR 44(1), 49-63.
Jackson, M.C., 1999. Towards coherent pluralism in management science. Journal of Operational Research Society 50(1), 12–23.
Joro, T., Korhonen, P., Wallenius, J., 1998. Structural comparison of data envelopment analysis and
Joshi, R., Banwet, D.K., Shankar, R., 2011. A Delphi-AHP-TOPSIS based benchmarking framework for performance improvement of a cold chain. Expert Systems with Applications 38, 10170– 10182.
Jyoti, Banwet, D.K., Deshmukh, S.G., 2008. Evaluating performance of national R&D organizations using integrated DEA-AHP technique. International Journal of Productivity and Performance Management 57(5), 370–388.
Kaplan, R.S., Norton, D.P., 1992. The balanced scorecard measures that drive performance. Harvard Business Review January-February, 71-79.
Korhonen, P., Syrjänen, M., 2004. Resource allocation based on efficiency analysis. Management
Science50, 1134–1144.
Lee, S., 2010. Using data envelopment analysis and decision trees for efficiency analysis and recommendation of B2C controls. Decision Support Systems 49, 486–497.
Mavrotas, G., Trifillis, P., 2006. Multicriteria decision analysis with minimum information: combining DEA with MAVT. Computers & Operations Research 33, 2083–2098.
McCunn, P., 1998. The balanced scorecard: the eleventh commandment. Management Accounting December, 34–36.
McMullen, P.R., Frazier, G.V., 1998. Using simulation and data envelopment analysis to compare assembly line balancing solutions. Journal of Productivity Analysis 11, 149–168.
Meekings, A., 1995. Unlocking the potential of performance measurement: a guide to practical implementation. Public Money and Management October–December, 1–8.
Mingers, J., 2000. Variety is the spice of life: Combining soft and hard OR/MS methods. International Transactions in Operational Research 7, 673–691.
Mingers, J., 2003. A classification of the philosophical assumptions of management science methods. Journal of the Operational Research Society 54, 559–570.
Mingers, J., Brocklesby, J., 1997. Multimethodology: Towards a framework for mixing methodologies. Omega 25(5), 489–509.
Mingers, J., Liu, W., Meng, W., 2009. Using SSM to structure the identification of inputs and outputs in DEA. Journal of the Operational Research Society 60, 168 -179.
Mingers, J., Rosenhead, J., 2004. Problem structuring methods in action. European Journal of Operational Research 152(3), 530-554.
Morgan, J.S., Howick, S., Belton, V., 2017, A toolkit of designs for mixing Discrete Event Simulation and System Dynamics. European Journal of Operational Research 257: 907–918.
Munro, I., Mingers, J., 2002. The use of multimethodology in practice – Results of a survey of practitioners. Journal of the Operational Research Society 53, 369–378.
Munro, I., Mingers, J., 2004. Viewpoint: The practice of UK OR practitioners. Journal of the Operational Research Society 55, 90–93.
Neely, A., Bourne, M., 2000. Why measurement initiatives fail. Measuring Business Excellence 4, 3-6.
Pidd, M., 2012. Mixing other methods with simulation is no big deal. In C. Laroque, J. Himmelspach, R. Pasupathy, O. Rose, & A. M. Uhrmacher (Eds.), Proceedings of the 44th winter simulation conference, Berlin, Germany .
Podinovski, V., 2002. Weight restrictions and radial measures of efficiency. Warwick Business School Research Paper, No. 352, 2002.
Pollack, J., 2009. Multimethodology in series and parallel: strategic planning using hard and soft OR. Journal of the Operational Research Society 60(2), 156-167.
Richardson, G.P., 1986. Problems with causal-loop diagrams. System Dynamics Review2(2), 158–
Samoilenko, S., Osei-Bryson, K., 2008. Increasing the discriminatory power of DEA in the presence of the sample heterogeneity with cluster analysis and decision trees. Expert Systems with Applications 34, 1568–1581.
Santos, S.P., Belton, V., Howick, S., 2002. Adding value to performance measurement by using systems dynamics and multicriteria analysis. International journal of Operations and Production Management 22, 1246–1272.
Santos, S.P., Belton, V., Howick, S., 2008. Enhanced performance measuring using OR: A case study. Journal of the Operational Research Society 59, 762–775.
Sarkis, J., 2000. A comparative analysis of DEA as a discrete alternative multiple criteria decision tool. European Journal of Operational Research 123, 543–557.
Scheel, H., 2000. EMS: Efficiency Measurement System User’s Manual Version 1.3. Universitat Dortmund: Dortmund, Germany.
Schneiderman, A.M., 1998. Why balanced scorecards fail. Journal of Strategic Performance Measurement January, 6-11.
Schultz, M., Hatch, M.J., 1996. Living with multiple paradigms: The case of paradigm interplay in organisational culture studies. Academy of Management Review 21 (2), 529–557.
Seçme, N.Y., Bayrakdaroğlu, A., Kahraman, C., 2009. Fuzzy performance evaluation in Turkish Banking Sector using Analytic Hierarchy Process and TOPSIS. Expert Systems with Applications 36, 11699-11709.
Seol, H., Choi, J., Park, G., Park, Y., 2007. A framework for benchmarking service process using data envelopment analysis and decision tree. Expert Systems with Applications 32, 432-440. Seol, H., Lee, H., Kim, S., Park, Y., 2008. The impact of information technology on organizational
efficiency in public services: a DEA-based DT approach. Journal of the Operational Research Society 59(2), 231-238.
Sharma, M.J., Yu, S.J., 2010. Benchmark optimization and attribute identification for improvement of container terminals. European Journal of Operational Research 201, 568–580.
Smith, P.C., Goddard, M., 2002. Performance management and Operational Research: a marriage made in heaven?. Journal of the Operational Research Society 53(3), 247-255.
Sterman, J.D., 2000. Business Dynamics Systems Thinking and Modeling for a Complex World. London: McGraw-Hill.
Stewart, T.J., 1996. Relationships between data envelopment analysis and multiple criteria decision analysis. Journal of the Operational Research Society47, 654–665.
Sun, C., 2010. A performance evaluation model by integrating fuzzy AHP and fuzzy TOPSIS methods. Expert Systems with Applications 37, 7745–7754.
Suwignjo, P., Bititci, U.S., Carrie, A.S., 2000. Quantitative models for performance measurement system. International journal of Production Economics 64, 231–241.
Tsang, A.H.C., Jardine, A.K.S., Kolodny, H., 1999. Measuring maintenance performance: a holistic approach. International Journal of Operations and Production Management 19(7), 691–715. Tseng, F.M., Chiu, Y.J., Chen, J.S., 2009. Measuring business performance in the high-tech
manufacturing industry: a case study of Taiwan’s large-sized TFT-LCD panel companies.
Omega 37(3) 686-697.
Van Camp, J., Braet, J., 2016. Taxonomizing performance measurement systems’ failures, International Journal of Productivity and Performance Management 65(5) 672 – 693.
Wallenius, J., Dyer, J.S., Fishburn, P.C., Steuer, R.E., Zionts, S., Deb, K., 2008. Multiple Criteria Decision Making, Multiattribute Utility Theory: Recent Accomplishments and What Lies Ahead. Management Science 54(7), 1336–1349.
Wu, D., 2006. Detecting information technology impact on firm performance using DEA and decision tree. International Journal of Information Technology and Management 5, 162–174.
Wu, D., Yang, Z., Liang, L., 2006. Using DEA-neural network approach to evaluate branch efficiency of a large Canadian bank. Expert Systems with Applications 31(1), 108–115.
Yang, J.B., Wong, B.Y., Xu, D.L., Stewart, T.J., 2009. Integrating DEA-oriented performance assessment and target setting using interactive MOLP methods. European Journal of Operations Research 195, 205–222