City, University of London Institutional Repository
Citation
:
Zhu, R., Zhou, F., Yang, W. and Xue, J-H. (2018). On Hypothesis Testing for
Comparing Image Quality Assessment Metrics [Tips & Tricks]. IEEE Signal Processing
Magazine, 35(4), pp. 133-136. doi: 10.1109/MSP.2018.2829209
This is the accepted version of the paper.
This version of the publication may differ from the final published
version.
Permanent repository link:
http://openaccess.city.ac.uk/20448/
Link to published version
:
http://dx.doi.org/10.1109/MSP.2018.2829209
Copyright and reuse:
City Research Online aims to make research
outputs of City, University of London available to a wider audience.
Copyright and Moral Rights remain with the author(s) and/or copyright
holders. URLs from City Research Online may be freely distributed and
linked to.
On Hypothesis Testing for Comparing Image Quality Assessment Metrics
Rui Zhu, Fei Zhou, Wenming Yang and Jing-Hao Xue
In developing novel image quality assessment (IQA) met-rics, researchers should compare their proposed metrics with state-of-the-art metrics. A commonly adopted approach is by comparing two residuals between the nonlinearly mapped scores of two IQA metrics and the difference mean opinion score, which are assumed from Gaussian distributions with zero means. An F-test is then used to test the equality of variances of the two sets of residuals. If the variances are significantly different, then we conclude that the residuals are from different Gaussian distributions and that the two IQA metrics are significantly different. TheF-test assumes that the two sets of residuals are independent. However, given that the IQA metrics are calculated on the same database, the two sets of residuals are paired and may be correlated. We note this improper usage of theF-test by practitioners, which can result in misleading comparison results of two IQA metrics. To solve this practical problem, we introduce the Pitman test to investigate the equality of variances for two sets of corre-lated residuals. Experiments on the LIVE database show that the two tests can provide different conclusions.
Introduction
Image quality assessment (IQA) is a popular research topic in image processing. Several widely used IQA metrics, such as noise quality measure (NQM) [1], structural similar-ity index (SSIM) [2], multiscale structural similarsimilar-ity (MS-SSIM) [3], visual information fidelity [4], feature similarity index (FSIM) [5] and gradient similarity (GSM) [6], have been proposed in the last several decades.
Researchers should compare their proposed IQA metrics with state-of-the-art metric to validate the superiority of their metrics. Such comparisons are typically performed following the procedures proposed in [7].
To test whether two IQA metrics are significantly differ-ent, Sheikh et al. [7] used the hypothesis test on two sets of residuals between the nonlinearly mapped scores calculated from each of the two IQA metrics and the difference mean opinion score (DMOS). In [7], one assumption is that the two sets of residuals are samples from Gaussian distributions with zero means. Therefore, to test whether the two sets of residuals are from the same distribution, we only need to test whether the two sets of residuals present the same variance. Sheikh et al. [7] adopted a simpleF-test to investigate the equality of variances of two sets of residuals.
The F-test assumes that the two samples are indepen-dent [8]. However, we note that the two sets of residuals in IQA can be correlated, thereby invalidating the independence assumption in theF-test. In particular, when comparing two IQA metrics, we apply the metrics to the same database, re-sulting in paired scores calculated from the two IQA metrics, with one residual in the first IQA metric uniquely matched with one residual in the second IQA metric on the same im-age. The paired scores of the two IQA metrics are correlated; for example, as degradation on an image increases, the scores from the two IQA metrics can both decrease. Thus, the two residuals between the DMOS and the two nonlinearly mapped scores may also be correlated.
When the two samples are correlated, theF-test cannot provide reliable results on the equality of variances. There-fore, the conclusion whether the two IQA metrics are statisti-cally different based on theF-test is not reliable.
Pitman and Morgan [9, 10] developed a test to examine the equality of variances for two correlated samples. In the Pitman test statistic, the Pearson correlation coefficient is in-volved to consider the effect of the correlation between sam-ples. Instead of using theF-test, we introduce the Pitman test to examine the equality of variances for comparing two IQA metrics.
Using theF-test to compare IQA metrics
Supposing that the aim is to compare the scoresxandy cal-culated from two IQA algorithms (after the nonlinear map-ping) on the same database withx = [x1, x2, . . . , xN]T ∈
RN×1 and y = [y1, y2, . . . , yN]T ∈ RN×1, where N is
the number of images in the database and supposing that the DMOS for the images in the database is denoted as z = [z1, z2, . . . , zN]T ∈ RN×1, then the two residuals between
the DMOS and the two nonlinearly mapped scores aredx =
z−xanddy =z−y.
Sheikh et al. [7] assumed thatdx= [dx1, dx2, . . . , dxN]T ∈
RN×1anddy = [dy1, dy2, . . . , dyN]T ∈RN×1are the
sam-ples drawn from Gaussian distributions with zero means. Therefore, testing whether dx and dy are from the same
Gaussian distribution becomes testing whether their popula-tion variancesσx2andσy2are the same.
The F-test is adopted in [7] to test the equality of vari-ances. The null hypothesisH0 isσx2/σ2y = 1 and the
samplesdxanddy, theF-test statistic is calculated as
F= s
2
x
s2
y
, (1)
wheres2
x=
1
N−1
PN
i=1(dxi−d¯x)2ands2y =
1
N−1
PN
i=1(dyi− ¯
dy)2 are the sample variances, andd¯x = N1 P N
i=1dxi and ¯
dy = N1 PNi=1dyiare the sample means. TheF-test statistic
has an F distribution with N −1 and N −1 degrees of freedom.
Therefore, the test conclusion is drawn by comparing the value ofF in (1) with the critical values of anF distribution withN−1andN−1degrees of freedom. Given the signifi-cance levelα(which usually takes values of 1%, 5% or 10%), the null hypothesis is rejectedF > F1−α/2,N−1,N−1orF <
Fα/2,N−1,N−1, whereF1−α/2,N−1,N−1 andFα/2,N−1,N−1
are the critical values. Then, we conclude thatdx and dy
are from different Gaussian distributions. Otherwise, if
Fα/2,N−1,N−1 ≤ F ≤ F1−α/2,N−1,N−1, we do not
re-ject the null hypothesis, and the conclusion is thatdxanddy
are from the same Gaussian distribution.
Why theF-test is unsuitable for comparing IQA metrics?
TheF-test assumes thatdxanddyare two independent
sam-ples from Gaussian populations. However,dx anddy may
be correlated because the samples are paired; one sampledxi
indxis uniquely paired with one sampledyiindy because
they are calculated on the sameith image. Such samples are called paired samples in statistics. If the two IQA metrics are both well designed, their scores both decrease as the degree of degradation increases in the same image. Such correla-tions between scores may also render the residualsdxanddy
as correlated. Empirical evidence of the correlation between residuals is provided later in experimental results. Therefore, the conclusion drawn from theF-test of whetherdxanddy
are from the same distribution can be unreliable.
The Pitman test as a solution
In statistics, a hypothesis test for paired samples is usually different from that for independent samples. For example, the
t-test is used to test the equality of means for independent samples, whereas the pairedt-test is used for paired samples. For evaluating the equality of variances, the Pitman test is designed for correlated samples [9, 11, 12].
Here, we introduce the Pitman test to examine the equality of variances for the residuals of two IQA metrics. The null hypothesisH0isσ2x=σ
2
y, and the alternative hypothesisH1
isσ2x6=σ2y. The Pitman test statistic is calculated as
t=(1−s
2
x/s2y)
√ N−2 q
4(1−r2)(s2
x/s2y)
, (2)
where
r=
PN
i=1(dxi−d¯x)(dyi−d¯y)
q PN
i=1(dxi−d¯x)2P N
i=1(dyi−d¯y)2
(3)
is the Pearson correlation coefficient between the two sets of samplesdx anddy. It is clear that in (2) the correlation r
is considered in the test statistic. The Pitman test statistic exhibits a Student’stdistribution withN−2degrees of free-dom.
Similar to that in theF-test, the test conclusion is drawn by comparing the value oftin (2) with the critical values of a
tdistribution withN−2degrees of freedom.
TheF-test versus the Pitman test
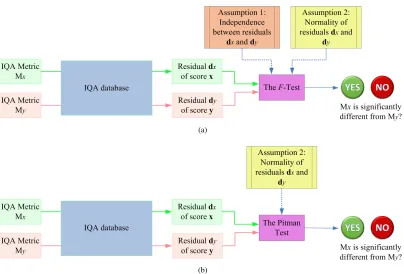
In Fig. 1, we illustrate the use of theF-test and the Pitman test in comparing IQA metrics. Two IQA metricsMxandMyare
applied to the same IQA database, providing two residualsdx
anddy, respectively. In the comparison ofdxanddyby
us-ing theF-test, two assumptions are applied: 1) independence betweendxanddyand 2) normality ofdxanddy, as shown
in Fig. 1(a). By contrast, when the Pitman test is used, the only assumption is the normality ofdxanddy, as shown in
Fig. 1(b). Given thatdxanddyare paired and correlated, the
Pitman test is more appropriate to test the equality of vari-ances than theF-test.
Experimental results
In the following experiments, we aim to test whetherdxand
dy are from Gaussian distributions with the same variances
on the LIVE database. We show that different conclusions can be drawn from theF-test and the Pitman test.
Following the experiments in [7], all experiments are performed on five types of degradations (JPEG2000, JPEG, Gaussian noise, Gaussian blur and fast-fading wireless) sepa-rately and then on the overall database.
We compare the scores of the following seven IQA metrics: FSIM [5], GSM [6], most apparent distortion (MAD) [13], MS-SSIM [3], NQM [1], peak signal to noise ratio (PSNR) and SSIM [2]. All scores and their nonlinearly mapped scores are obtained from http://sse.tongji. edu.cn/linzhang/IQA/IQA.htm.
The significance levels of theF-test and the Pitman test are both set to 5%.
Are two conclusions different?
(a)
(b)
Fig. 1. Illustrations of the use of (a) theF-test and (b) the Pitman test in the comparison of IQA metrics.
Table 1. Differences between the conclusions drawn from theF-test and the Pitman test for the overall database and Gaussian
noises.
Same conclusions
Different conclusions
Total Pitman:MxandMyare different Pitman:MxandMyare the same
F:MxandMyare the same F:MxandMyare different
Overall database 19 2 0 21
Gaussian noises 18 3 0 21
show two examples on the overall database and the Gaussian noises in Table 1.
A total of 21 pairs of IQA metrics are compared in the experiments. For the overall database, we obtain 19 same conclusions and 2 different conclusions from the two tests. The two pairs of IQA metrics with different conclusions are (PSNR, GSM) and (PSNR, MS-SSIM). Similar results are ob-tained for the Gaussian noises, that is, 18 same conclusions and 3 different conclusions on (PSNR, FSIM), (PSNR, MS-SSIM) and (NQM, MS-MS-SSIM). In addition, all different con-clusions present the same pattern: the Pitman test concludes thatMxandMyare different, whereas theF-test concludes
thatMxandMyare the same. For example, the well-known
MS-SSIM is empirically superior to PSNR. However, theF -test cannot tell their difference, whereas the Pitman -test can statistically distinguish between the pair.
We can formulate two observations from the above re-sults. First, theF-test and the Pitman test can provide the same conclusions for most comparisons of IQA metrics.
However, different conclusions exist for certain cases. Sec-ond, the Pitman test can detect more statistically significantly unequal IQA metrics than the F-test for correlated samples. This finding is reasonable because a high correlationrresults in increased absolute value oftin (2), given the fixeds2xand
s2
y. Thus, with a larger absolute value oft, the Pitman test is
more likely to reject the null hypothesis, compared with the
F-test.
Are two residuals correlated?
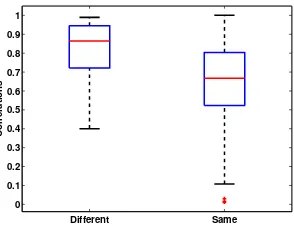
The Pearson correlation coefficients between the two sets of residuals for all tests with different conclusions and the same conclusions are plotted in Fig. 2. From these two box-plots, we can observe the following patterns.
First, almost all correlations are nonzeros, with the excep-tion of several outliers. This finding empirically demonstrates our argument that the two sets of residuals from the two IQA metrics may be correlated.
[image:4.612.104.508.66.340.2]Different Same 0 0.1 0.2 0.3 0.4 0.5 0.6 0.7 0.8 0.9 1 Correlations
Fig. 2. Correlations between the pairs of residuals for IQA
metrics with different conclusions (the left boxplot) and the same conclusions (the right boxplot) between theF-test and the Pitman test.
is close to 0.9 and is markedly higher than that in the right boxplot. This finding suggests that with a high correlation between the two sets of residuals, the two statistical hypothe-sis tests tend to provide different conclusions.
Recommendations for practitioners
On the basis of experimental results, we offer the following suggestions for the comparison of IQA metrics.
When the correlation between two scores (or particularly residuals) is low, the Pitman test and theF-test can provide the same comparison result. However, with a high correla-tion, the Pitman test and theF-test tend to provide different answers. In this case, we trust the results of the Pitman test, which is specifically designed for correlated samples. There-fore, to obtain reliable results for all cases, we suggest for practitioners to use the Pitman test to evaluate the equality of variances for comparing two IQA metrics. With the Pitman test, several methods that were reported to be statistically in-distinguishable in the literature can be determined to be sta-tistically significantly different.
Summary
In this article, we introduce the Pitman test to address the problem of using theF-test in comparing IQA metrics when the independence assumption is invalidated. However, if the normality assumption is also violated, then the power of the Pitman test also decreases. In this case, nonparametric tests without the normality assumption may provide superior solu-tions.
Authors
Rui Zhu (r.zhu@kent.ac.uk) received her Ph.D. degree in statistics from University College London in 2017. She is a lecturer in the School of Mathematics, Statistics & Ac-tuarial Science, University of Kent. Her research interests
include spectral data analysis, hyperspectral image analy-sis, subspace-based classification methods and image quality assessment.
Fei Zhou (flying.zhou@163.com, corresponding author) received his Ph.D. degree from the Department of Electronic Engineering, Tsinghua University in 2013. He is currently a visiting scholar of the Department of Statistical Science, Uni-versity College London. His research interests include ap-plications of image processing and pattern recognition tech-niques in video surveillance, image super-resolution, image interpolation, image quality assessment and object tracking.
Wenming Yang(yangelwm@163.com) received his Ph.D. degree in electronic engineering from Zhejiang University in 2006. He is an associate professor in the Department of Elec-tronic Engineering, Graduate School at Shenzhen, Tsinghua University. His research interests include image process-ing, pattern recognition, computer vision, biometrics, video surveillance and image super-resolution.
Jing-Hao Xue (jinghao.xue@ucl.ac.uk) received his
Dr.Eng. degree in signal and information processing from Tsinghua University in 1998 and Ph.D. degree in statistics from the University of Glasgow in 2008. He is a senior lecturer in the Department of Statistical Science, University College London. His research interests include statistical machine learning, high-dimensional data analysis, pattern recognition and image analysis.
References
[1] Niranjan Damera-Venkata, Thomas D Kite, Wilson S Geisler, Brian L Evans, and Alan C Bovik, “Image quality assessment based on a degradation model,” IEEE Transactions on Image Processing, vol. 9, no. 4, pp. 636–650, 2000.
[2] Zhou Wang, Alan C Bovik, Hamid R Sheikh, and Eero P Si-moncelli, “Image quality assessment: from error visibility to structural similarity,”IEEE Transactions on Image Processing, vol. 13, no. 4, pp. 600–612, 2004.
[3] Zhou Wang, Eero P Simoncelli, and Alan C Bovik, “Multiscale structural similarity for image quality assessment,” in Sig-nals, Systems and Computers, 2004. Conference Record of the Thirty-Seventh Asilomar Conference on. IEEE, 2003, vol. 2, pp. 1398–1402.
[4] Hamid R Sheikh and Alan C Bovik, “Image information and visual quality,” IEEE Transactions on Image Processing, vol. 15, no. 2, pp. 430–444, 2006.
[5] Lin Zhang, Lei Zhang, Xuanqin Mou, and David Zhang, “FSIM: A feature similarity index for image quality assess-ment,”IEEE Transactions on Image Processing, vol. 20, no. 8, pp. 2378–2386, 2011.
[6] Anmin Liu, Weisi Lin, and Manish Narwaria, “Image quality assessment based on gradient similarity,” IEEE Transactions on Image Processing, vol. 21, no. 4, pp. 1500–1512, 2012.
[image:5.612.105.252.70.183.2]as-sessment algorithms,” IEEE Transactions on Image Process-ing, vol. 15, no. 11, pp. 3440–3451, 2006.
[8] Robert L Mason, Richard F Gunst, and James L Hess, Statis-tical design and analysis of experiments: with applications to engineering and science, vol. 474, John Wiley & Sons, 2003.
[9] EJG Pitman, “A note on normal correlation,”Biometrika, vol. 31, no. 1/2, pp. 9–12, 1939.
[10] WA Morgan, “A test for the significance of the difference be-tween the two variances in a sample from a normal bivariate population,”Biometrika, vol. 31, no. 1/2, pp. 13–19, 1939.
[11] William G Cochran, “Testing two correlated variances,” Tech-nometrics, vol. 7, no. 3, pp. 447–449, 1965.
[12] James Lee, “Comparison of variance between correlated sam-ples,”Bioinformatics, vol. 8, no. 4, pp. 405–406, 1992.