City, University of London Institutional Repository
Citation:
Smith-Creasey, M. & Rajarajan, M. (2017). Adaptive threshold scheme for
touchscreen gesture continuous authentication using sensor trust. 2017 IEEE
Trustcom/BigDataSE/ICESS, pp. 554-561. doi:
10.1109/Trustcom/BigDataSE/ICESS.2017.284
This is the accepted version of the paper.
This version of the publication may differ from the final published
version.
Permanent repository link:
http://openaccess.city.ac.uk/18631/
Link to published version:
http://dx.doi.org/10.1109/Trustcom/BigDataSE/ICESS.2017.284
Copyright and reuse: City Research Online aims to make research
outputs of City, University of London available to a wider audience.
Copyright and Moral Rights remain with the author(s) and/or copyright
holders. URLs from City Research Online may be freely distributed and
linked to.
City Research Online:
http://openaccess.city.ac.uk/
[email protected]
Adaptive Threshold Scheme for Touch Gesture
Continuous Authentication using Sensor Trust
Max Smith-Creasey
School of Mathematics, Computer Science and Engineering City, University of London
London, United Kingdom [email protected]
Muttukrishnan Rajarajan
School of Mathematics, Computer Science and Engineering City, University of London
London, United Kingdom [email protected]
Abstract—In this study we produce a continuous
authentication scheme that adjusts an adaptive threshold for touchscreen interaction based on trust in passively collected sensor data. Our framework unobtrusively compares real-time sensor data of a user to historic data and adjusts a trust parameter based on the similarity. We show that the trust parameter can be used to adjust an adaptive threshold in continuous authentication schemes. The framework passively models temporal, spatial and activity scenarios using sensor data such as location, surrounding devices, wifi networks, ambient noise, movements, user activity, ambient light, proximity to objects and ambient pressure from study participants. Deviations from the models increases the level of threat the device perceives from the scenario. We also model the user touch-screen interactions. The touch-screen interactions are authenticated against a threshold that is continually adjusted based on the perceived trust. This scheme provides greater nuance between security and usability, enabling more refined decisions. We present our novel framework and threshold adjustment criteria and validate our framework on two state-of-the-art sensor datasets. Our framework achieves up to a 20.38% increase in accuracy compared to the static threshold system.
Index Terms—Continuous authentication, intrusion detection,
trust, biometrics
I. INTRODUCTION
Mobile devices have become one of the most prevalent and widely used technologies of our time. Most mobile applications require and store private information about the user that could be used for malicious and fraudulent behavior if obtained by impostors. Modern devices present the option of a security mechanism such as a PIN, password or pattern but recent research has shown that such security mechanisms can be bypassed through a variety of forgery attacks, such as the smudge attack [1]. Furthermore, whilst these mechanisms provide a layer of device security, they do not persist for the duration of device usage meaning that once a device has been logged in there are typically no other security checks. Lastly, research has suggested that many users see a security mechanism as an inconvenience and disable the functionality entirely [].
To address the issues with current mobile security mechanisms, studies propose continuous authentication (also known as active authentication) techniques [2]. Most mobile techniques for continuous authentication typically collect biometric data from the device during usage and use it to profile a user such that future data collected may be compared to the profile. The success of individual biometric modalities has resulted in studies successfully combining them to obtain improved accuracy [3]. In most schemes, data is collected either as explicit interaction occurs (e.g.: each touchscreen swipe) or
passively in the background (e.g.: location at each time interval).
Thresholds chosen in continuous authentication schemes are often based on an EER (equal error rate), the threshold at which the FAR (false acceptance rate) is equal to the FRR (false rejection rate) [2]. Several schemes do, however, present a thresholds that can dynamically update but don’t update in real-time [4] or lack nuance [5]. The use of passive sensor data for trust has been of interest to industry recently, with Google
incorporating Smart Lock [30] into Android. As with similar
studies, however, their approach lacks nuance and requires use interaction. Current research has focused very little on unobtrusively adapting the trade-off of usability and security.
In this paper the main focus is on providing a continuous authentication scheme that addresses the need for different levels of usability and security at different times. We hypothesize that by leveraging passively collected data (such as location [6]) to dictate thresholds for interaction data (such as touch [2]), we can dynamically adapt the confidence required from interactive continuous authentication techniques. We posit that the passive and interactive biometrics can work together in our scheme to provide more refined and nuanced decisions by adapting to the most appropriate usability and security for the specific scenario. We show our adaptive threshold technique improves on the state-of-the-art touchscreen authentication methods. The main contributions of this paper are:
• A novel proof-of-concept trust framework for a system
employing collected passive sensor data to adapt the threshold used for authenticating interaction data providing refined usability and security. We show this can improve on the current state-of-the-art schemes.
• We propose new criteria for threshold adaption based on
passively collected sensor data. We show how we adjust the threshold for interactive authentication based on the trust of sensor data. We show the performance enhancement and the compromise between security and usability.
• We show the robustness of our scheme against different
attackers due to the unique combination of interactive and passive biometric data.
II. RELATED WORK
Continuous authentication research on mobile devices has produced a variety of different schemes. Collected modalities include biometrics that require interaction (e.g.: touch-gestures) and modalities that collect data passively (e.g.: accelerometer readings). The consideration between usability and security is a recognised but little focused on research area.
Interactive biometrics were used by researchers in Touchalytics [2]; they presented one of the first continuous authentication schemes using touchscreen gestures. They used strokes from 41 different users and achieved an EER of 0% to 4% depending on the scenario. In [3] and [7] a continuous authentication scheme is presented that records touch and face biometrics during interaction. The authors in [3] use different classifiers in a stacked scheme achieving an EER of 3.77%.
In [8] the researchers of the study introduce a continuous authentication scheme based on touchscreen gesture interactions using the notion of trust. Scores for a touchscreen gesture are used to adapt a trust score. The study shows this technique can add more nuance to systems that previously averaged a window of scores [2]. The thresholds in these schemes are static and don’t factor in the environmental context which reduces the compromise between usability and security. Passive biometrics build on the notion that humans are creatures of habit [9]. Such biometrics are gathered from device sensors in the background with no interaction necessary. In [31], the idea was to utilize user behavior patterns for authentication. They use time since the user last checked email and GPS location as behavioural biometrics for their study. The scores were combined and compared with a pre-defined threshold to determine whether to permit the user access.
Several studies use passively collected sensor to make decisions on what explicit authentication is required and when. In [10] the authors propose a scheme that uses continuous biometrics to decide when user authentication is necessary. The system uses biometric data to form a trust score that is used to provide a level of access to the device. The study shows a 42% decrease in the number of times a user is required to explicitly authenticate. This scheme, does, however require off-device processing and does still have noticeable impact on usability. The authors of [11] authors propose CASA, a probabilistic framework that provides context-aware authentication. The scheme selects appropriate explicit authentication based on passive factors rather than authenticating users on these factors. They construct a Naïve Bayes classifier that assesses collected location and application usage patterns. The study found that they can reduce up to 68% of explicit authentications.
In [12] the authors use a publicly available dataset containing passively collected GPS data, wi-fi and Bluetooth data to build a context profiling framework. The familiarity of the wi-fi and Bluetooth devices at a location are used to estimate the safety of the context. The trust in the context may be used to change the lockout time and login mechanism. The study creates algorithms to assess new context samples and reevaluate the safety of the context every 5 minutes. In their best-case scenario, the authors show that they can identify safe and unsafe contexts with an accuracy of ~85%. In [13] the authors propose a multi-faceted authentication scheme that aims to enhance the user-friendliness of authentication schemes by using passive sensor data to assess what level of access should be permitted.
The scheme collects gait, location and proximity data from mobile device sensors. The data from each modality is weighted accordingly. One-class SVM learning techniques are trained on the sensor data and fused to provide a dynamic trust score on future samples.
Passively collected sensor data has also been used as a standalone method of authentication. The researchers in [4] collected a dataset of wi-fi, application, cell, CPU load, light, noise, magnetic field and rotation data from 7 different users. Their scheme builds profiles using probability density functions. The scheme updates the threshold for the sensor data daily. The imposter detection accuracy ranges from 53.21% to 99.44% depending on similarity with the genuine user behaviour. The study only tests their adversary experimentation using a single user, however, and the threshold adaption is too infrequent to adapt in real-time. The authentication scheme in [5] models data collected from user behavior event behavior to determine a level of trust on the current user. The scheme uses SMS, call, browser and Wi-Fi data. It is one of the first schemes to experiment with an adaptive threshold. The adaptive threshold is computed using a function based on past the EPWA (exponentially weighted average) of previous scores. The authors in [6] use location information as the only modality to authenticate users. The study proposes a Hidden Markov Model with a marginal smoothing technique as a novel algorithm for location authentication. The results show that an EER of 20.73% can be achieved with the proposed method, however, knowledge of the genuine user routine can it is vulnerable to attack.
Some studies have combined interactive and passive biometrics such as [14]. The authors in this study use passive and interactive biometrics including Stylometry, Application Usage, Web Browsing, and GPS Location. The scores are combined periodically taking into account their contribution to the final score. In SenGaurd [15] the authors propose using interactive and passive biometrics including touchscreen gestures, microphone, GPS, cellular tower, and motion sensors.
Whilst some of these discussed studies assess the security and efficiency tradeoffs very few discuss the importance of usability and security as in [16]. We find few continuous authentication schemes present an adaptive compromise between usability and security.
III. ADAPTIVE THRESHOLD FRAMEWORK
In this section, we describe the novel framework that forms our continuous authentication system with adaptive thresholds based on passive sensor trust. We describe the general concept, our custom data capture application, how we model the different data collected, the classification setup we construct for our approach and our method for threshold selection.
A. General Idea
This study introduces an extendable and novel framework for continuous authentication that adapts the threshold required from touch-gesture interactions based on passive sensor trust. We hypothesize that adapting a threshold based on sensor data can adjust the usability and security based on the context and therefore yield more accurate and meaningful authentication scores as a result.
Our proposed framework continuously collects readings
gestures performed. The sensor readings are used to form a set of anchors. Anchors, introduced in [4], describe a specific scenario (e.g.: an hour of the day) and defines the characteristics of it. Each anchor contains probabilistic models for each sensor, other than the sensor used to define the anchor. These anchors create a user profile for a user over a training phase. Touch interactions during the training phase are used to train a classifier. After the training phase is complete, future collected
readings from the sensors for each time period p are compared
to the corresponding models within the appropriate anchors. This yields a score for each of the sensors for the readings collected during that time period. We use a period of 1 minute of sensor readings in our study. Each score represents the likelihood of the sensor readings belonging to the genuine user. The scores obtained from the sensors are then combined using to form a single score that represents the trust T at time tn.
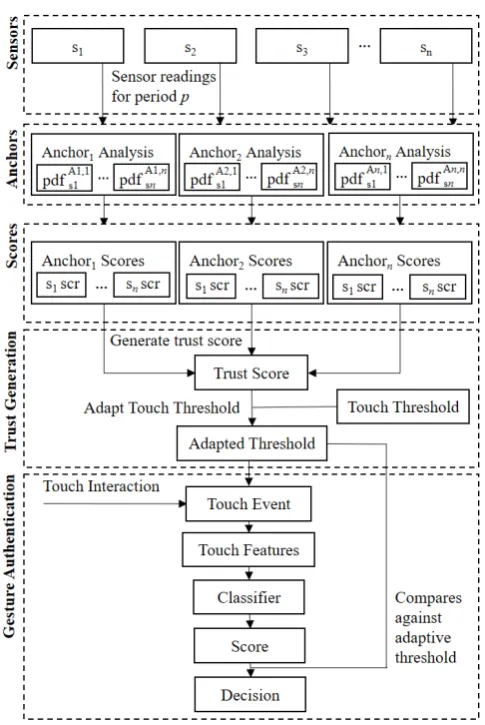
Every time the trust score is updated it is used to adapt a base threshold within computed boundaries and used for authenticating touchscreen interaction scores. High trust scores imply lower perceived threat and therefore the threshold is lowered resulting in greater usability. Low trust scores imply higher perceived threat and therefore the threshold is heightened resulting in greater security. Each subsequent touchscreen interaction after the training phase has features extracted and passed to a classifier. The classifier produces a score that is compared to the current adapted threshold. We show the process of our proposed framework in Figure 1. B. Data Capture
To collect the data required for authentication we design an application for the Android mobile platform. We use Android in our study because it is a widely used mobile operating system and also provides considerable freedom to access device features and functionality (such as sensor readings) through APIs. Our application is set to start immediately on boot and collect data passively in the background with no user interaction required. Collected sensor data is written to the internal device storage.
Our application collects data readings from the accelerometer, gyroscope, magnetometer, proximity, ambient lighting, gravity, and pressure sensors every 50 milliseconds. Wi-fi, Bluetooth, cellular, user activity and GPS readings are also captured when available each minute. We construct a touch-gesture collection module that runs alongside our sensor collection processes. This module runs in the background passively recording all features of all touchscreen gestures made on the device. Each touchscreen gesture is comprised of individual touch points that denote a change in the x or y of the touchscreen gesture. We make it clear that our application can collect data in all scenarios and does not need interaction with a custom application like in [2]. As in [17], we interact with the Linux kernel to record touch data due to Android security limitations.
C. User Profiles
We use data collected over a training period to build models that describe the user. In our experimental framework, we use 10 days of previously collected data as we find this to be detailed enough for convergence between days. As the sensor readings are collected during the training period they contribute toward building a set of probability density functions for each different sensor for each of the current anchors. We use temporal and spatial anchors represented by each hour and each cell tower reading, respectively (as in [4]) as well as an activity
anchor that we introduce to allow a probability density function to describe expected sensor readings when the user is carrying out an identifiable activity (e.g.: walking).
Separate probability density functions are constructed for each attribute of a sensor with multiple attributes (e.g.: x, y and
z axes for accelerometer). Probability density functions are
created using histograms for discrete data and kernel density functions for continuous data. The benefits of such probability density functions include the low computational cost of updating them, allowing for adaptability. Scores obtained from sensor readings using this scheme are combined to form the trust score T using Equation 1.
𝑇𝑇
=
∑ �∑ 𝑠𝑠𝑠𝑠𝑠𝑠𝐴𝐴𝑗𝑗𝑠𝑠𝑖𝑖
𝑛𝑛 𝑖𝑖=1
𝑛𝑛 � 𝑚𝑚
𝑗𝑗=1
𝑚𝑚 (1)
We use 5-fold cross validation on the sensor training data to calculate a set of genuine scores for each sensor in each anchor for a user. We use these genuine scores to compute an
appropriate minimum expected score, exp, for each sensor, a
factor below the mean as in Equation 2.
𝑒𝑒𝑒𝑒𝑒𝑒=�1𝑛𝑛 � 𝑠𝑠𝑠𝑠𝑠𝑠𝑖𝑖
𝑛𝑛
𝑖𝑖=1
� − �𝑠𝑠 ×�𝑛𝑛 � 𝑠𝑠𝑠𝑠𝑠𝑠1 𝑖𝑖
𝑛𝑛
𝑖𝑖=1
[image:4.595.311.554.54.417.2]��
Figure 1: The framework for our proposed adaptive threshold scheme. The symbol pdf represents a probability density
function which scores sensor sn readings for an anchor An,n
producing a score snsrc.
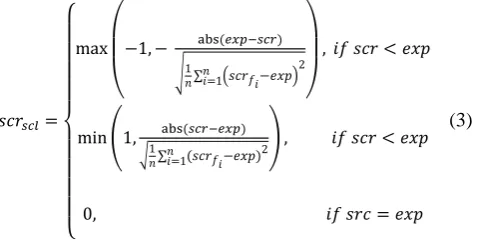
Deviations above or below this score from subsequent
sensor readings are scaled such that they provide a score scrscl
between -1 and 1. This is for used increasing or decreasing the touchscreen gesture threshold. We use the expected minimum
score exp as well as the average deviation of the folded scores
scrf in our computation. We show our method for this in
Equation 3.
𝑠𝑠𝑠𝑠𝑠𝑠𝑠𝑠𝑠𝑠𝑠𝑠=
⎩ ⎪ ⎪ ⎪ ⎪ ⎨ ⎪ ⎪ ⎪ ⎪ ⎧ max ⎝ ⎜ ⎛
−1,− abs(𝑒𝑒𝑒𝑒𝑒𝑒−𝑠𝑠𝑠𝑠𝑠𝑠)
�1
𝑛𝑛 ∑𝑛𝑛𝑖𝑖=1�𝑠𝑠𝑠𝑠𝑠𝑠𝑓𝑓𝑖𝑖−𝑒𝑒𝑒𝑒𝑒𝑒�2
⎠ ⎟ ⎞
, 𝑖𝑖𝑓𝑓 𝑠𝑠𝑠𝑠𝑠𝑠<𝑒𝑒𝑒𝑒𝑒𝑒
min�1, abs(𝑠𝑠𝑠𝑠𝑠𝑠−𝑒𝑒𝑒𝑒𝑒𝑒)
�1𝑛𝑛 ∑𝑛𝑛𝑖𝑖=1(𝑠𝑠𝑠𝑠𝑠𝑠𝑓𝑓𝑖𝑖−𝑒𝑒𝑒𝑒𝑒𝑒)2�, 𝑖𝑖𝑓𝑓 𝑠𝑠𝑠𝑠𝑠𝑠<𝑒𝑒𝑒𝑒𝑒𝑒
0, 𝑖𝑖𝑓𝑓 𝑠𝑠𝑠𝑠𝑠𝑠=𝑒𝑒𝑒𝑒𝑒𝑒
(3)
The touchscreen gestures captured over the training period for each user are pre-processed to generate a well-known feature set [2]. To collect more detailed data from a touch event we discard any touch-gesture less than 8 touch points. The gestures for the users are used to train a continuous touch-gesture classification scheme, following state-of-the-art approaches.
D. Threshold Adaption
One of the key novelties of our scheme compared to other approaches that use passive and interactive biometrics [14] is that we use the passive sensor biometrics to adapt a threshold for the interactive biometrics rather than simply averaging the scores. We compute a base threshold by using 5-fold cross validation to generate scores for the touch-gesture training data
such that we can find the threshold, thr, at the EER (when
FAR=FRR). We compute upper, u, and lower, l, boundaries that
govern the maximum and minimum values the threshold can take. These are calculated based on the deviation of the cross-validated scores from the threshold obtained at the EER, as in Equations 4 and 5.
𝑙𝑙= max�0,𝑡𝑡ℎ𝑠𝑠 − �𝑛𝑛1∑𝑛𝑛𝑖𝑖=1(𝑒𝑒𝑖𝑖− 𝑡𝑡ℎ𝑠𝑠)2� (4)
𝑢𝑢= min�1,𝑡𝑡ℎ𝑠𝑠+�𝑛𝑛1∑𝑛𝑛𝑖𝑖=1(𝑒𝑒𝑖𝑖− 𝑡𝑡ℎ𝑠𝑠)2� (5)
As defined, the sensor trust is represented as a value between -1 and 1 (where 1 is the highest trust). This used to create an adapted threshold from sensor readings periodically.
Equation 6 calculates the adapted threshold, adpt:
𝑎𝑎𝑎𝑎𝑒𝑒𝑡𝑡=�
𝑡𝑡ℎ𝑠𝑠 − �𝑇𝑇×𝑎𝑎𝑎𝑎𝑠𝑠(𝑙𝑙 − 𝑡𝑡ℎ𝑠𝑠)�, 𝑖𝑖𝑓𝑓 𝑇𝑇> 0
𝑡𝑡ℎ𝑠𝑠 − �𝑇𝑇×𝑎𝑎𝑎𝑎𝑠𝑠(𝑢𝑢 − 𝑡𝑡ℎ𝑠𝑠)�, 𝑖𝑖𝑓𝑓 𝑇𝑇< 0
𝑡𝑡ℎ𝑠𝑠 , 𝑖𝑖𝑓𝑓 𝑇𝑇= 0
(6)
Such an equation ensures that when the trust level is negative due to mistrust the threshold is increased (enhancing security) and is decreased when the trust level is positive due to trust (enhancing usability).
IV. EXPERIMENTAL RESULTS AND DISCUSSION
In this section, we evaluate the performance of our adaptive framework through experimentation. We discuss the datasets we used in our study and the pre-processing techniques we use to extract discernable features for system users. We then discuss the experiments we perform with on our system to assess the accuracy, robustness and efficiency
A. Datasets
To test our hypothesis and verify the validity of our results, we use two different datasets. Each dataset comprises of information from a variety of mobile device sensors.
MSC (Mobile Sensor Collection) Dataset: To model
passive sensor data in this study we produce and use our own MSC dataset. We produced this dataset because we feel it uniquely combines all sensors that have been show to previously yield identifying information. The dataset contains sensor readings from 6 different participants. Each participant used a Nexus 4 device installed with our custom data collection application as their main device for a minimum of 14 days. Our dataset provides passively collected sensor readings from the accelerometer, Bluetooth, GPS, gravity, gyroscope, light, magnetometer, noise, cellular, proximity, wifi and pressure sensors. The dataset also includes all touchscreen interactions performed by the participants. The information collected from each sensor is detailed in Table 1. Our dataset is uniquely detailed in that it contains more than 10GB of sensor data and more than 3,000 touch-gestures for each user.
GCU (Glasgow Caledonian University) Dataset: The
GCU dataset [4] contains sensor data from their staff and
Modality MSC Dataset GCU Dataset
Accelerometer Event time, X, Y, Z Event time, X, Y, Z Bluetooth Event time, List of
Device IDs & Strength
N/A
GPS Event time, Lat., Lon. N/A Gravity Event time, X, Y, Z N/A Gyroscope Event time, X, Y, Z Event time, X, Y, Z
Ambient Light Event time, Light value Event time, Light value Magnetometer Event time, X, Y, Z Event time, X, Y, Z Ambient Noise Event time, average noise
value
Event time, min. noise value, average noise value, max. noise value Cellular Event time, List of Cell
IDs
Event time, Connected Cell ID Proximity Event time, Proximity
value
N/A
Wifi Networks Event time, List of Wifi Networks & Strengths
Event time, List of Wifi Networks Pressure Event time, Pressure
value
N/A
Activity Event time, List of Activities (walking, driving, cycling, still, vehicle, running, tilting, unknown) & Probabilities
N/A
Touch Gesture Event time, List of touch points (each with: time,
X, Y, area, pressure)
N/A
System Usage N/A Event time, System CPU load, Use CPU load App Usage N/A Event time, Current open
[image:5.595.52.292.159.279.2]apps
students. The dataset was collected via their custom Android app and comprises of sensor readings from light, wi-fi, application usage, cellular, noise and system stats. The data is collected from each user for a minimum of 14 days. The publicly available dataset that is used in this study contains data from 4 users. The information collected from each sensor is detailed in Table 1. The dataset contains between 190MB and 670MB for each participant depending on the duration of the data collection period.
B. Pre-processing
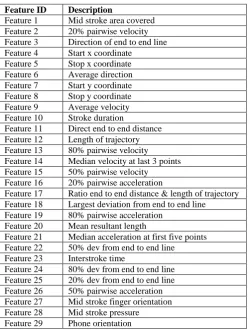
We extract all strokes with a length of 8 touch points or above for each user from the touch data. In [1], a set of identifying features were successfully extracted from the raw data. We adopt and compute 29 of these features for each stroke. Descriptions of the features extracted are provided in Table 1.
We process the sensor files for each user, reducing the sample rate of continuously updated sensors to 500ms rather than 50ms. We do this because our tests found little improvement when comparing the two sampling rates due to the system taking an average of values over a time period to obtain a score. The decrease in sampling improves in efficiency. C. Evaluation Metrics
As is common in biometric studies, we assess the effectiveness of our system by using the following metrics:
i) False Acceptance Rate (FAR): This is the rate that an
impostor is wrongly classified as the genuine user.
ii) False Rejection Rate (FRR): This is the rate that the
genuine user is wrongly classified as an impostor.
iii)Equal Error Rate (EER): This is the rate at which FAR and
FRR are equal to each other. FAR and FRR sets are usually obtained as an acceptance threshold is adjusted. FAR and FRR pairs are correlated such that if one increases the other decreases. In our experiments EER=(FAR+FRR)/2 for the FAR and FRR with the smallest difference.
D. Accuracy, Usability and Security
In this experiment, we evaluate the improved accuracy of our adaptive framework system compared to a state-of-the-art continuous authentication method. We perform these experiments on both sensor dataset and include all of the participants in each experiment.
For both the MSC dataset and the GCU dataset we build user profiles using sensor data over a 10-day training phase. We construct the KDEs and histograms for temporal and spatial anchors discussed in Section III. We then build the touchscreen gesture classification part of our scheme. We base our approach on the single classifier scheme in in [3]. We therefore use a Random Forest [18] classifier from the Weka API [19] because it was shown to yield the best results for gesture classification. We train the classifier on 10 days of touchscreen gestures. The positive dataset contains the genuine user gestures and the negative dataset contains the gestures of every other user. The GCU dataset does not contain touchscreen gestures. We therefore randomly assign each user in the GCU dataset with a touchscreen gesture collection from our dataset so we can use it in our scheme. We compute a static threshold by using 5-fold cross validation on the training data and selecting the threshold at the EER.
Each trained profile from a dataset is then tested by processing the next 4 remaining days of sensor and touchscreen gesture data of the genuine user and each impostor user in the current dataset. This results in our framework producing a score for each of the touch gestures observed in the test set that is measured against an adapting threshold at the time the interaction was performed. In the GCU dataset the touchscreen gestures do not correspond to a specific score at a time in the
Static Threshold Scheme
Adaptive Threshold Scheme
FRR FAR FRR FAR
[image:6.595.39.290.50.381.2]User 1 8.62 9.30 5.60 1.64 User 2 17.23 17.63 8.07 4.93 User 3 37.89 13.89 24.21 7.34 User 4 16.66 21.13 8.79 5.35 User 5 10.20 13.46 7.95 6.24 User 6 6.46 13.02 4.10 5.44 Average 16.18 14.74 9.79 5.16 User 1 5.58 29.52 2.87 7.02 User 2 14.30 33.62 8.72 15.26 User 3 31.86 33.13 16.48 10.26 User4 19.45 29.32 10.51 11.65 Average 17.80 31.40 9.65 11.02
Table 3: The FARs and FRRs of the static threshold system compared to the FARs and FRRs achieved when using our adaptive threshold scheme.
Feature ID Description
Feature 1 Mid stroke area covered Feature 2 20% pairwise velocity Feature 3 Direction of end to end line Feature 4 Start x coordinate
Feature 5 Stop x coordinate Feature 6 Average direction Feature 7 Start y coordinate Feature 8 Stop y coordinate Feature 9 Average velocity Feature 10 Stroke duration
Feature 11 Direct end to end distance Feature 12 Length of trajectory Feature 13 80% pairwise velocity Feature 14 Median velocity at last 3 points Feature 15 50% pairwise velocity Feature 16 20% pairwise acceleration
Feature 17 Ratio end to end distance & length of trajectory Feature 18 Largest deviation from end to end line
Feature 19 80% pairwise acceleration Feature 20 Mean resultant length
Feature 21 Median acceleration at first five points Feature 22 50% dev from end to end line Feature 23 Interstroke time
Feature 24 80% dev from end to end line Feature 25 20% dev from end to end line Feature 26 50% pairwise acceleration Feature 27 Mid stroke finger orientation Feature 28 Mid stroke pressure Feature 29 Phone orientation
[image:6.595.313.557.543.708.2]dataset because they were not collected together, unlike the MSC dataset, so we therefore select an adapting threshold at a random time for the touchscreen gesture. We perform the same experiment without our adaptive threshold scheme such that the classifier scores are matched against the static threshold obtained at the point of EER.
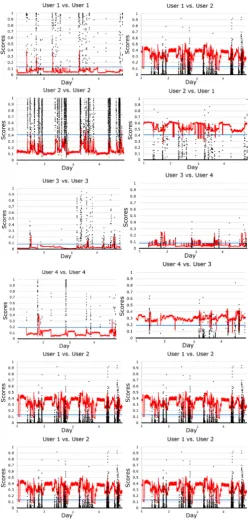
For each user, we record the number of falsely accepted and falsely rejected touchscreen gestures such that we can compute FAR and FRR values. We present the results of this experiment in Table 3. We find that for our adaptive classification scheme we achieve consistently lower false acceptance and false rejection. We show the effectiveness of our scheme in Figure 2. The adaptive nature of the threshold can clearly be seen to decrease the threshold increasing usability in known environments and increase the threshold increasing security in unknown environments.
E. Activity as an Anchor
We experiment with using the detected activity of a user as an anchor. Sensor readings taken during a specific activity (e.g.: walking) are compared to the probabilistic models for that activity anchor. We repeat the previous experiment, this time including the activity of a user as an anchor. We only perform this experiment using the MSC dataset because the GCU dataset does not include activity.
We find that scores from activity anchors for continuous sensors (such as accelerometer) prove unreliable and sporadic. We explain this due to the limited number of activities and therefore a saturation of different sensor readings for each. This experiment therefore uses only GPS, Bluetooth, wi-fi and celluar tower sensor data. We show the results of this experiment in Table 4. Comparing these results to the results in Table 3 that were achieved with only temporal and spatial
anchors, we find that the addition of an activity ….
F. Attack Scenarios
In this experiment, we show how our system can achieve results improving on state-of-the-art techniques that make decisions solely on passive sensor data. We explore attacks carried out by informed and uninformed attackers [20].
The uninformed attacker is the most common class of attacker. This attacker represents an individual that has no knowledge of the authentication scheme on the device or the way in which the genuine user uses the device; they can be thieves who take a device from a user and begin using it with no additional security concern. We model this user by taking a
device from 3 users in our study and attempting to gain access
using impostor touchscreen gestures. We find XXXXXX.
[image:7.595.308.558.53.579.2]An informed attacker is difficult to detect because they have familiarity with the environment in which the genuine user uses the device and the way in which they use it. To perform this attack on our system, we train our model for each user in the MSC dataset. We then test the trained scheme on genuine user sensor data and touchscreen gesture from all other users to model impostors using the device in a known environment. This tells us the robustness of the system if an impostor intentionally Figure 2: Graphs when a trained adaptive threshold scheme is tested on a genuine and impostor users. The graphs depict the scores of touchscreen gestures as black dots, the dynamic threshold as a red line, and the static threshold as a blue line. Adaptive Threshold Scheme with Activity Anchor
FRR FAR
User 1 User 2 User 3 User 4 User 5 User 6 Average
[image:7.595.38.288.620.722.2]uses the device in a genuine user environment to attempt to
bypass the authentication scheme. We find XXXXXX.
V. CONCLUSION
In this paper, we have presented a novel mobile continuous authentication framework that compromises between usability and security for touchscreen gestures based on passively collected sensor readings. We describe our framework and the techniques for threshold adaption. We collected our own experimental dataset for the study consisting of detailed sensor and touchscreen gesture data. We show that our framework can improve on the state-of-the-art static threshold schemes when authenticating different users. We show that our scheme can offer additional robustness when detecting impostor users that have stolen the device. We argue that our scheme provides a better compromise between usability and security than other state-of-the-art continuous authentication schemes.
VI. FUTURE WORK
The future work of this research will concentrate on furthering this framework by addressing its current limitations. Firstly, we will explore how to better combine the sensor scores and anchors. We will endeavor to investigate the contributions of each sensor and each anchor toward the final trust score. This will enable us to apply weightings to each sensor and anchor such that they contribute to the final score in the most effective and reliable way. Using the sensor data collected we will also investigate more refined classification approaches for each sensor as [21] does for their 3 sensor datasets. We could, for example, apply techniques that look beyond noise levels but into types of noises or voices as in [22].
The second area we intend to look into is the ability to continually update the biometric profile seamlessly over time. The issue of concept drift [23] results in biometrics drifting from the profile over time and therefore weakening the
accuracy of the biometric authentication system. We will explore techniques suitable for updating the both the passive and interactive biometric profiles of a user efficiently on mobile devices. Methods to alleviate concept drift in continuous authentication schemes is a little researched area.
Finally, our future work will look into additional biometric modalities that we could add as part of this adaptive threshold scheme. We will primarily investigate what other forms of interaction we can include in our scheme in addition to touchscreen gestures. Additional interactive biometrics would allow us authenticate the user more regularly and improve the security of the scheme.
ACKNOWLEDGEMENT
This research work is carried out as part of a research studentship funded by British Telecommunications, UK.
REFERENCES
[1] A. J. Aviv, K. Gibson, E. Mossop, M. Blaze, and J. M. Smith, “Smudge Attacks on Smartphone Touch Screens,” USENIX Conf.
Offensive Technol., pp. 1–7, 2010.
[2] M. Frank, R. Biedert, E. Ma, I. Martinovic, and D. Song, “Touchalytics: On the applicability of touchscreen input as a behavioral biometric for continuous authentication,” IEEE Trans.
Inf. Forensics Secur., vol. 8, no. 1, pp. 136–148, 2013.
[3] M. Smith-Creasey and M. Rajarajan, “A Continuous User Authentication Scheme for Mobile Devices,” in 14th International
Conference on Privacy, Security and Trust 2016, 2016.
[4] H. Kayacık, M. Just, L. Baillie, D. Aspinall, and N. Micallef, “Data Driven Authentication: On the Effectiveness of User Behaviour Modelling with Mobile Device Sensors,” Proc. IEEE Secur. Priv.
Work. Mob. Secur. Technol., 2014.
[5] F. Yao, S. Y. Yerima, B. Kang, and S. Sezer, “Event-Driven Implicit Authentication for Mobile Access Control,” 2015 9th Int.
Conf. Next Gener. Mob. Appl. Serv. Technol., no. Ngmast, pp. 248–
255, 2015.
[6] U. Mahbub and R. Chellappa, “PATH: Person Authentication using Trace Histories,” 2016.
[7] H. Zhang, V. M. Patel, and R. Chellappa, “Robust multimodal recognition via multitask multivariate low-rank representations,”
2015 11th IEEE Int. Conf. Work. Autom. Face Gesture Recognition,
FG 2015, 2015.
[8] P. Bours, “Swipe Gesture based Continuous Authentication for Mobile Devices,” no. MAY, pp. 458–465, 2015. [9] D. Gordon, J. Czerny, and M. Beigl, “Activity recognition for
creatures of habit,” Pers. Ubiquitous Comput., vol. 18, no. 1, pp. 205–221, 2014.
[10] O. Riva, C. Qin, and K. Strauss, “Progressive authentication: deciding when to authenticate on amobile phones,” Proc. 21 st …,
pp. 1–16, 2011.
[11] E. Hayashi, S. Das, S. Amini, J. Hong, and I. Oakley, “CASA: Context-aware Scalable Authentication,” SOUPS ’13 Proc. Ninth
Symp. Usable Priv. Secur., p. 3:1--3:10, 2013.
[12] A. Gupta, M. Miettinen, and N. Asokan, “Intuitive security policy configuration in mobile devices using context profiling,” in 2012 International Conference on Privacy, Security, Risk and Trust and
2012 International Confernece on Social Computing, 2012.
[13] D. M. Shila, K. Srivastava, P. O. Neill, K. Reddy, and V. Sritapan, “A multi-faceted approach to user authentication for mobile devices
- using human movement , usage , and location patterns,” in IEEE
Homeland Security Conference, 2016.
[14] L. Fridman, S. Weber, R. Greenstadt, and M. Kam, “Active Authentication on Mobile Devices via Stylometry, Application
Usage, Web Browsing, and GPS Location,” pp. 1–10, 2015. [15] W. Shi, J. Yang, Y. Jiang, F. Yang, and Y. Xiong, “SenGuard:
Passive user identification on smartphones using multiple sensors,”
Int. Conf. Wirel. Mob. Comput. Netw. Commun., pp. 141–148, 2011.
[16] W. Lee and R. B. Lee, “Multi-sensor authentication to improve smartphone security,” Conf. Inf. Syst. Secur. Priv., no. JANUARY
2015, 2015.
[17] L. Li, X. Zhao, and G. Xue, “Unobservable Re-authentication for Smartphones,” 2011.
[18] L. Breiman, “Randomforest2001,” pp. 1–33, 2001. [19] M. Hall, E. Frank, G. Holmes, B. Pfahringer, P. Reutemann, and I.
H. Witten, “The WEKA data mining software,” SIGKDD Explor.
Newsl., vol. 11, no. 1, p. 10, 2009.
[20] E. Shi, Y. Niu, M. Jakobsson, and R. Chow, “Implicit authentication through learning user behavior,” Lect. Notes Comput. Sci. (including
Subser. Lect. Notes Artif. Intell. Lect. Notes Bioinformatics), vol.
6531 LNCS, pp. 99–113, 2011.
[21] G. J. Nalepa and S. Bobek, “Rule-based solution for context-aware
reasoning on mobile devices,” Comput. Sci. Inf. Syst., vol. 11, no. 1, pp. 171–193, 2014.
[22] H. Lu, W. Pan, N. Lane, T. Choudhury, and A. Campbell, “SoundSense: scalable sound sensing for people-centric applications
on mobile phones,” Proc. 7th Int. Conf. Mob. Syst. Appl. Serv., pp. 165–178, 2009.
[23] A. Tsymbal, “The problem of concept drift: definitions and related work,” Comput. Sci. Dep. Trinity Coll. Dublin, vol. 4, no. C, pp.