Template version 8.0d, 22 August 2017. IEEE will put copyright information in this area See http://www.ieee.org/publications_standards/publications/rights/index.html for more information.
Comparison of Levelized Cost of Energy of
super-conducting direct drive generators for a 10 MW
off-shore wind turbine
A. B. Abrahamsen, D. Liu, N. Magnusson, A. Thomas, Z. Azar, E. Stehouwer, B. Hendriks, Gerrit-Jan Van
Zinderen, F. Deng, Z. Chen, D. Karwatzki, A. Mertens, M. Parker, S. Finney and H. Polinder
Abstract—A method for comparing the Levelized Cost of Energy (LCoE) of different superconducting drive trains is introduced. The properties of a 10 MW MgB2 superconducting direct drive genera-tor and the cost break down of the nacelle components are presented and scaled up to a turbine with a rotor diameter of up to 280 m. The partial load efficiency of the generator is evaluated for a constant cooling power of 0, 50 kW and 100 kW and the annual energy pro-duction is used to determine the impact on Levelized Cost of Energy.
Index Terms— Generators, Levelized Cost of Energy (LCoE), Superconductor, Wind Energy.
I. INTRODUCTION
uperconducting generators have been proposed as an ena-bling technology for large offshore wind turbines, because the torque density of the superconducting generator can offer more compact and lightweight machines [1]. This hypothesis has been investigated as a part of the INNWIND.EU project, where 10-20 MW offshore turbines, targeting 50 m water depths in the North Sea, are designed [2]. These designs involve the development of turbine rotors with diameters of up to 280 m, drive trains, and both fixed and floating offshore foun-dations, all with a 25 year design lifetime. To compare different concepts, the Levelized Cost of Energy (LCoE) is determined from the capital and operational expenditure (CAPEX and OPEX) of the equipment divided by the annual energy produc-tion summed over the lifetime.
Manuscript receipt and acceptance dates will be inserted here. The research leading to these results has received funding from the European Community’s Seventh Framework Programme FP7-ENERGY-2012-1-2STAGE under grant agreement No. 308974 (INNWIND.EU). (Corresponding author: Asger Bech Abrahamsen, [email protected] )
A. B. Abrahamsen is with the Department of Wind Energy , Technical Univer-sity of Denmark, Frederiksborgvej 399, 4000 Roskilde, Denmark (e-mail: [email protected]).
D. Liu and H. Polinder are with the Department of Electrical Sustainable En-ergy, Delft University of Technology, NL-2628 CD Delft, Netherlands
([email protected] and [email protected] ).
N. Magnusson is with the SINTEF Energy Research, Trondheim, Norway (
A. Thomas and Z. Azar are with Siemens Wind Power limited, Sheffield S3 7HQ, United Kingdom ([email protected] and [email protected] ).
E. Stehouwer and G.-J. Van Zinderen are with the Turbine Engineering DNV GL – Energy, Energieweg 17, 9743 AN Groningen, The Netherlands
([email protected] and [email protected] ).
This paper presents the final design of the INNWIND.EU 10 MW MgB2 based superconducting direct drive generator as illustrated in fig. 1 . The determination of the LCoE of the gen-erator is compared with a 10 MW high temperature supercon-ducting direct drive generator [3] and magnetic Pseudo Direct Drive (PDD) generator [4] of the INNWIND.EU project.
B. Hendriks is with the Knowledge Centre WMC, 1770 AA Wieringerwerf, The Netherlands ([email protected] ).
F. Deng and Z. Chen are with the Department of Energy Technology, Aalborg University, Pontoppidanstraede 111, 9220 Aalborg East, Denmark ([email protected] and [email protected] ).
D. Karwatzki and A. Mertens are with the Institute for Drive Systems and Power Electronics, Leibniz Universität Hannover, Welfengarten 1, 30167 Hanno-ver, Germany ([email protected] and [email protected] ).
M. Parker is with the Institute for Energy and Environment, University of Strathclyde, 204 George Street, Glasgow G1 1XW, United Kingdom ( [email protected]).
S. Finney is with the School of engineering, The university of Edinburgh, May-field Road, Edinburgh, United Kingdom ([email protected] ).
Color versions of one or more of the figures in this paper are available online at http://ieeexplore.ieee.org.
Digital Object Identifier will be inserted here upon acceptance.
S
[image:1.612.317.561.297.464.2]II. LEVELIZED COST OF ENERGY (LCOE)
A. Definition of LCoE with focus on generator
A method for comparing different energy producing technol-ogies at the end of plant-life is to calculate the cost of the energy produced CoE by adding up all the costs C and divide with the total energy produced E, whereby CoE = C/E [€/MWh].
One would however often like to compare technologies be-fore they are constructed to determine which of them that will be the best investment [5]. This can be done by asking how much money should be reserved for a cost at the decision time (t = 0) c0,i in order to pay for the cost after i years ci. The initial
amount is smaller, because alternative investments with an in-terest rate of w has to be considered until the year of payment, whereby ci = c0,i(1+w)i. The energy Ei produced during the
years will result in an income ii being proportional to the energy
sales price si, but the income from producing the energy Ei in
year i is worth less at the beginning of the investment i0,i,
be-cause it takes time before it can be reinvested. Thus i0,i = Eisi
1/(1+w)i. The ratio between all the costs and the income
recal-culated to the beginning of the investment then becomes
𝐶
𝐼=
∑ 𝑐𝑖 1
(1+𝑤)𝑖 𝐿𝑇 𝑖=0
∑𝐿𝑇𝑖=0𝐸𝑖𝑠𝑖(1+𝑤)𝑖1
= 1
𝑠𝑖,𝑐
∑ 𝑐𝑖 1
(1+𝑤)𝑖 𝐿𝑇 𝑖=0
∑𝐿𝑇𝑖=0𝐸𝑖(1+𝑤)𝑖1
= 1
𝑠𝑖,𝑐𝐿𝐶𝑜𝐸 (1)
where LT is the design life time, ci is the cost in year i, w is
the interest rate, Ei is the energy production in year i, si is the
energy sales price in year i, si,c is the energy price (assumed
constant for all the years), and finally the Levelized Cost of En-ergy is denoted LCoE. If different energy technologies are in the same market then si,c can be assumed to be the same,
whereby the technology with the lowest LCoE is the most fa-vorable.
The above method can be used to compare the LCoE of su-perconducting wind turbine generators with other drive train technologies by making some simplifying assumptions. First the cost terms are split into the CAPital EXpediture (CAPEX) and the OPerational EXpenditure (OPEX), which will be de-noted Ci and Oi for the cost of the equipment and running cost
in year i. The cost of the equipment is specified as the cost of the drive train CD and the cost of the rest CR of the turbine and
foundation in case of an offshore turbine. These costs are paid at the beginning, whereas the operation cost oi are assumed
con-stant for every year and split into a drive train oD,c and rest of
the turbine part oR,c. The LCoE can then be written as
LCoE = 𝐶𝐷+𝐶𝑅
∑𝐿𝑇𝑖=0𝐸𝑖(1+𝑤)𝑖1
+
∑𝐿𝑇𝑖=0𝑜𝑖(1+𝑤)𝑖1
∑𝐿𝑇𝑖=0𝐸𝑖(1+𝑤)𝑖1
= 𝐶𝐷+𝐶𝑅
𝑎∙𝐸𝑖,𝑐∙LT+
𝑜𝐷,𝑐+𝑜𝑅,𝑐
𝐸𝑖,𝑐 (2)
where the Annual Energy Production (AEP) Ei,c is assumed
constant every year and the levelizing factor a is introduced as
𝑎 = 1
𝐿𝑇∑
1
(1+𝑤)𝑖
𝐿𝑇
𝑖=0 (3)
The two terms in equation (2) can be considered the CAPEX and the OPEX contributions to LCoE.
An interest rate w = 5.75 % and a design life time LT = 25 years can be considered as constants resulting in a = 0.55. The Annual Energy Production will depend on the wind resource
characterized by a Weibull distribution and the losses of the drive trains. The cost of the drive train CD can be found from
the materials used in the design, but the operation expenditures are hard to determine before full scale demonstration of the su-perconducting generators have been evaluated. Thus the opera-tional expenditures are assumed to be similar to other previous offshore wind turbines O/Ei,C = 24 €/MWh [11].
B. Sensitivity of LCoE to generator and turbine properties
One can determine the sensitivity of LCoE due to the param-eters of eq. (2) by introducing variations
∆𝐿𝐶𝑜𝐸
𝐿𝐶𝑜𝐸0 = −
∆𝐸𝑖,𝑐 𝐸𝑖,𝑐0
+𝐿𝐶𝑜𝐸𝐶𝐴𝑃𝐸𝑋
𝐿𝐶𝑜𝐸0 (
∆𝐶𝐷
𝐶𝐷,0+ 𝐶𝑅,0+
∆𝐶𝑅
𝐶𝐷,0+ 𝐶𝑅,0−
∆𝑎
𝑎0 −
∆𝐿𝑇
𝐿𝑇0)
+𝐿𝐶𝑜𝐸𝑂𝑃𝐸𝑋
𝐿𝐶𝑜𝐸0 (
∆𝑂𝐷,𝐶
𝑂𝐷,𝐶0+𝑂𝑅,𝐶0+
∆𝑂𝑅,𝐶
𝑂𝐷,𝐶0+𝑂𝑅,𝐶0) (4)
where the ΔEi,c/Ei,c0 is the relative change of the annual energy
production and similar for the other parameters. The ratios LCoECapex/LCoE0 and LCoEOpex/LCoE0 are estimated to be 0.72 and 0.28 respectively by using the cost of the 10 MW INN-WIND.EU reference turbine and foundations being CR ~ 27 M€ [6, 7, 11].
III. 10MWMGB2 GENERATOR
A. Generator topology
A series of different MgB2 based superconducting generator topologies have been investigated by defining the different ac-tive materials of the pole and then varying the dimensions to obtain the torque of the 10 MW INNWIND.EU reference tur-bine and to optimize for the lowest LCoE [6,7]. The costs of the generators are calculated based on the assumed unit cost of the active materials, being 3 mm x 0.7 mm MgB2 tape with a copper strip from Columbus Superconductors [8] at a cost of 4 €/m , copper armature windings (15 €/kg), magnetic steel laminates (3 €/kg), and glass fiber (15 €/kg). These unit costs represent the cost of the active material in the final generator and include the profit of the manufacturing companies [9]. The conclusion from the investigations of [6,7] is that it is much easier to obtain the torque and low cost from the fully iron-cored MgB2 gener-ator with the current properties of the MgB2 tapes, but at the expense of a higher active mass. In the INNWIND.EU project it was investigated if a cost reduction of the tower and founda-tions could be gained from a possible weight reduction of the superconducting generator, but it was found that reducing the tower top mass would shift a critical resonance of the tower and foundation closer to the blade passing excitation frequency, and thereby reduce the life time of the foundation [10]. Thus, the design philosophy for the INNWIND.EU MgB2 generator was changed from “light weight and not too expensive” to “cheap and not too heavy”. In terms of (2) this means that the cost of the rest of the structure CR is not expected to change much with
B. Front mounted generator in nacelle
The optimized distribution and usage of active materials of the MgB2 generators using the method of [6,7] where used to determine an appropriate aspect ratio of the 10 MW generator to be able to integrate the generator into a nacelle, where the generator is mounted in front of the turbine blades as shown in Fig. 1. This configuration has been denoted the kingpin con-cept, because a static pin is going through the hub that is holding the 3 blades and is supported on both sides by roller bearings. It has been found that a D = 8.4 m and L = 1.3 m MgB2 generator seems to match the dimensions of the kingpin nacelle and the resulting weight of the generator is 286 tons.
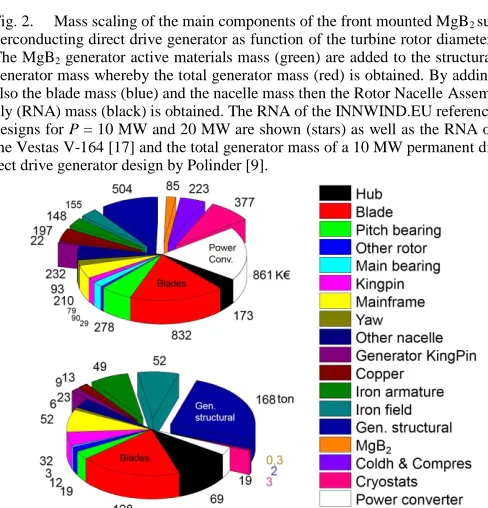
Table I shows the main properties of the 10 MW MgB2 gen-erator [11] and Fig. 2 shows the expected mass scaling of the generator, blade and nacelle as function of the turbine rotor di-ameter approaching Dturbine = 280 m by using the scaling
prin-ciples of [12]. The unit cost of the structural steel used for the nacelle is 3-4 €/kg.
C. Cryostats and cooling system
The choice of the iron-cored topology of the INNWIND.EU 10 MW MgB2 generator calls for a cryostat concept, where warm magnetic steel laminated poles go through the MgB2
racetrack coils. This concept has been investigated in the Su-prapower project [13] and has been projected onto the INN-WIND.EU generator by assuming that a similar heat load will be present. This has been used to estimate the cryocooler cold-heads and compressors demand, whereby the cost of the cryo-genics system has been determined [11]. It is found that about 15 coldheads will be needed to provide the cooling and a loss of 104 kW, corresponding to 1 % of the full rated power of the turbine, is needed to run the compressors. Fig. 3 shows the cost and mass break down of the nacelle components of the 10 MW MgB2 generator layout, including the cryostat and compressor cost [11].
TABLEI
PROPERTIES OF MGB2 DIRECT DRIVE GENERATORS
Power [MW] 10 20
Turbine rotor diameter [m] 178 252
Rated Speed [RPM] 9.65 7.13
Rated line-to-line voltage [V] 3300 6600 Specific electrical loading [kA/m] 75 75 Field current density in coil (20 K) [A/mm2] 111 115 Field current density in tape (20 K) [A/mm2] 178 184
Stator outer diameter Ds [m] 8.4 10.8
Number of phases m 3 3
Slots per pole per phase q 5 5
Pole pitch τp [mm] 471 471
Number of pole pairs p 28 36
Frequency fe [Hz] 4.5 4.2
Axial stack length Ls [m] 1.31 2.25
Shear stress σt [kPa] 72.3 71.6
Normal stress σr [kPa] 486 469
Ds2Ls [m3] 92.4 262.4
Air gap length g [mm] 8.4 10.8
MgB2 field winding ( incl. end ) [ton] 0.32 0.52
Rotor iron mass [ton] 51.8 111.5
Cryostat mass [ton] 3.4 8.9
Stator iron mass [ton] 49.4 106.8
Copper mass ( incl- end ) [ton] 13.1 24.3
Total rotor mass [ton] 55.5 120.4
Total stator mass [ton] 62.4 131.0
Total active mass [ton] 118 251
Structural mass [ton] 168 437
Total generator mass [ton] 286 688
Fig. 2. Mass scaling of the main components of the front mounted MgB2 su-perconducting direct drive generator as function of the turbine rotor diameter. The MgB2 generator active materials mass (green) are added to the structural generator mass whereby the total generator mass (red) is obtained. By adding also the blade mass (blue) and the nacelle mass then the Rotor Nacelle Assem-bly (RNA) mass (black) is obtained. The RNA of the INNWIND.EU reference designs for P = 10 MW and 20 MW are shown (stars) as well as the RNA of the Vestas V-164 [17] and the total generator mass of a 10 MW permanent di-rect drive generator design by Polinder [9].
[image:3.612.57.314.88.420.2] [image:3.612.317.561.250.504.2]D. Efficiency of superconducting generator
The efficiency of the 10 MW MgB2 superconducting gener-ator has been determined from the joule losses in the armature windings, and the hysteresis and eddy-current losses of the magnetic steel laminates as a function of the wind speed of the 10 MW INNWIND.EU reference turbine [6,7]. Power convert-ers for the 10 MW generators have been investigated [14] and the efficiency of the power converter is included in the partial load efficiency shown in fig. 4. The design Weibull wind distri-bution corresponding to an IEC class Ia wind resource having a mean wind speed of vave = 10.0 m/s and a shape parameter of k
= 2 [15] is used. The annual energy production of the turbine can be calculated by integrating the mechanical power curve of the rotor blades Pmech(v) [15] multiplied by the partial load
effi-ciency ε(v) over the wind speed distribution
𝐸𝑖,𝐶= ∫ 𝑃𝑚𝑒𝑐ℎ(𝑣)𝜀(𝑣)𝑃𝑊𝑒𝑖𝑏𝑢𝑙𝑙(𝑣)𝑑𝑣
𝑣𝑐𝑢𝑡−𝑜𝑢𝑡
𝑣𝑐𝑢𝑡−𝑖𝑛 (5)
where vcut-in = 4 m/s and vcutout = 25 m/s is giving the operational
wind speed range.
IV. COMPARISON OF LCOE
Fig 4. shows the partial load efficiency of the 10 MW MgB2 generator when including a constant cooling power of 0, 50 or 100 kW, as well as the 10 MW RBCO based direct drive and a magnetic Pseudo Direct Drive (PDD) [16]. The annual energy production of the different drive trains has been evaluated using (5) and the impact on LCoE from (4) is shown in table II. The pure annual energy production with no losses have been used as the baseline and the increase of LCoE is therefore with re-spect to a loss free drive train.
V. DISCUSSION
The LCoE analysis of table II is showing that the Pseudo Di-rect Drive (PDD) provides the most efficient drive train to the 10 MW INNWIND.EU turbine and jacket foundation with a LCoE about 1.3 % above the loss free reference drive train. The
superconducting MgB2 generator provides a range of LCoE from 1.9 % to 3.1 % depending on the cooling compressor power. The efficiency of the high temperature RBCO supercon-ductor direct drive generator including cryogenic cooling has not been estimated, since the wire cost was concluded to be too high to compete with permanent magnet direct drive (PMDD) generators [3]. Further analysis of the INNWIND.EU reference drive trains in the form of a two stage gear box combined with a medium speed generator and PMDD generator with a shear force density of 40 kN/m2 have revealed that the LCoE is lifted to 3.8 % and 2.3 % respectively [16]. This is indicating that the superconducting direct drive proposals are not orders of magni-tude from being competitive, but the 10 MW generator mass of 286 tons in table I must be compared to a PDD, PMDD and two stage gearbox +gen mass of 150 tons, 237 tons and 178 tons respectively. Reducing the cost of the MgB2 wire and increas-ing the infield critical current density are seen as a way to in-crease the amount of superconducting wire and reduce the amount of magnetic steel and thereby the generator mass. How-ever the MgB2 superconductor contributes less that the cost of the cryostats and the cryogenics in fig 3. Thus industrialization of these components seems to be the primary target of further LCoE reductions.
By summing the drive train costs in Fig. 3 to CD ~ 2.6 M€
including the power converter, one can estimate the LCoE of the 10 MW MgB2 generator using (2) to be
LCoE = 2.6 M€+27 M€
0.55∙48.3GWhy ∙25y+ 24
€
MWh= 69
€
𝑀𝑊ℎ (6)
This estimate is however considerably higher than most recent LCoE levels for offshore wind around 40 €/MWh [18]. The dif-ference is believe to arise from a water depth lower than 50 m, the interest rate w used in the sector has decreased due to higher competition and finally the design life time is increased to 30 years. If the cost of the 10 MW MgB2 generator is decreased by 25 % then the LCoE is expected to decrease by about 1.6 % and can not provide large changes in LCoE towards the 40 €/MWh.
VI. CONCLUSION
The levelized cost of energy of different superconducting drive trains has shown the current MgB2 and RBCO supercon-ductors can still not compete with the traditional drive trains mainly due to the low cost of permanent magnets. Improving the cost and properties of the superconductors will be benefi-cial, but industrialization of the cryostat and cooling system seems to hold the largest potential for further LCoE reductions. Fig. 4. Efficiency of the 10 MW MgB2 generator with a constant power
con-sumption of the cryogenic cooling system of 0, 50 kW and 100 kW [11] , a 10 MW coated conductor RBCO based generator [3] without cryogenic cooling consumption and the magnetic Pseudo Direct Drive (PDD) generator [4] inves-tigated in the INNWIND.EU project. The Weibull wind distribution is shown on the right hand axis.
TABLEII
ANNUAL ENERGY PRODUCTION EI OF DRIVE TRAINS.REPRODUCED FROM [16].
Drive train
Ei [GWh/year]
ΔLCoE/ LCoE0 [%]
[image:4.612.51.294.509.684.2]
REFERENCES
[1] Gregory Snitchler, Bruce Gamble, Christopher King and Peter Winn, “10 MW Class Superconductor Wind Turbine Generators”, IEEE TRANS-ACTIONS ON APPLIED SUPERCONDUCTIVITY, VOL. 21, NO. 3,
1089 (2011).
[2] INNWIND.EU project we site, www.innwind.eu. Accessed on: Sep. 20, 2017.
[3] INWIND.EU deliverable report D3.12, “Investigation of Super-Conduct-ing Direct Drive Generators”. Link: http://www.innwind.eu/publica-tions/deliverable-reports
[4] INNWIND.EU deliverable report D3.21, “Design and PI of PDD genera-tor”. Link: http://www.innwind.eu/publications/deliverable-reports [5] W. Short, D. J. Packey and T. Holt, “A Manual for the Economic
Evalu-ation of Energy Efficiency and Renewable Energy Technologies”, NREL report NREL/TP-462-5173 (1995).
[6] Dong Liu, Henk Polinder, Asger Bech Abrahamsen and Jan A. Ferreira, Fellow, “Topology Comparison of Superconducting Generators for 10-MW Direct-Drive Wind Turbines: Cost of Energy Based”, IEEE TRANS-ACTIONS ON APPLIED SUPERCONDUCTIVITY, VOL. 27, NO. 4, 5202007 (2017).
[7] Dong Liu, “INCREASING THE FEASIBILITY OF SUPERCONDUCT-ING GENERATORS FOR 10 MW DIRECT-DRIVE WIND TUR-BINES”, PhD Thesis, Delft University of Technology 2017. Available at http://repository.tudelft.nl/.
[8] Columbus Superconductors web site:
http://www.columbussuperconduc-tors.com/ . Accessed on: Sep. 20, 2017.
[9] H. Polinder, D. Bang R.P.J.O.M. van Rooij A.S. McDonald, M.A. Mueller, ”10 MW Wind Turbine Direct-Drive Generator Design with Pitch or Active Speed Stall Control”, Electric Machines & Drives Con-ference, 2007. IEMDC '07. IEEE International, p. 1319 (2007). [10] INWIND.EU deliverable report D4.34, “Innovative Design of a 10 MW
Steel-Type Jacket”. Link: http://www.innwind.eu/publications/delivera-ble-reports
[11] INNWIND.EU deliverable report D3.11, “Direct drive superconducting generators for INNWIND.EU wind turbines”. Link:
http://www.inn-wind.eu/publications/deliverable-reports
[12] INNWIND.EU deliverable report D3.41, “Conceptual nacelle designs of 10-20 MW wind turbines ”. Link: http://www.innwind.eu/publica-tions/deliverable-reports
[13] Suprapower website: www.suprapower.eu
[14] INNWIND.EU deliverable report D3.31, “Converter designs tailored to SC and PDD concepts”. Link: http://www.innwind.eu/publications/deliv-erable-reports
[15] INNWIND.EU deliverable report D1.21, “Reference Wind Turbine Re-port”. Link: http://www.innwind.eu/publications/deliverable-reports [16] INNWIND.EU deliverable report D3.44, “Final assessment of
supercon-ducting (SC) and Pseudo Direct Drive (PDD) generator performance in-dicators (PI’s)”. Link: http://www.innwind.eu/publications/deliverable-reports
[17] E. de Vries, ”Close up - Vestas V164-8.0 nacelle and hub”. Wind Power Mountly September 9 (2013)
![Fig. 1. Cross section view of the INNWIND.EU nacelle with the 10 MW MgB2 generator mounted in front of the turbine blades [12]](https://thumb-us.123doks.com/thumbv2/123dok_us/1360233.89484/1.612.317.561.297.464/cross-section-innwind-nacelle-generator-mounted-turbine-blades.webp)
![Fig. 4. Efficiency of the 10 MW MgB 2 generator with a constant power con-sumption of the cryogenic cooling system of 0, 50 kW and 100 kW [11] , a 10 MW coated conductor RBCO based generator [3] without cryogenic cooling consumption and the magnetic Pseudo](https://thumb-us.123doks.com/thumbv2/123dok_us/1360233.89484/4.612.51.294.509.684/efficiency-generator-cryogenic-conductor-generator-cryogenic-consumption-magnetic.webp)