Contents lists available atScienceDirect
Applied
Ocean
Research
journal homepage:www.elsevier.com/locate/apor
Predicting
the
effect
of
biofouling
on
ship
resistance
using
CFD
Yigit
Kemal
Demirel
∗,
Osman
Turan,
Atilla
Incecik
DepartmentofNavalArchitecture,OceanandMarineEngineering,UniversityofStrathclyde,HenryDyerBuilding,100MontroseStreet,Glasgow,G40LZ,UK
a
r
t
i
c
l
e
i
n
f
o
Articlehistory: Received27June2016
Receivedinrevisedform1December2016 Accepted6December2016
Keywords: Biofouling Shipresistance
Computationalfluiddynamics Hullroughness
a
b
s
t
r
a
c
t
ThispaperproposesaComputationalFluidDynamics(CFD)basedunsteadyRANSmodelwhichenables thepredictionoftheeffectofmarinecoatingsandbiofoulingonshipresistanceandpresentsCFD simula-tionsoftheroughnesseffectsontheresistanceandeffectivepowerofthefull-scale3DKRISOContainer Ship(KCS)hull.
Initially,aroughnessfunctionmodelrepresentingatypicalcoatinganddifferentfoulingconditionswas developedbyusingtheroughnessfunctionsgivenintheliterature.Thismodelthenwasemployedin thewall-functionoftheCFDsoftwareandtheeffectsofatypicalasappliedcoatinganddifferentfouling conditionsonthefrictionalresistanceofflatplatesrepresentingtheKCSwerepredictedforadesign speedof24knotsandaslowsteamingspeedof19knotsusingtheproposedCFDmodel.Theroughness effectsofsuchconditionsontheresistancecomponentsandeffectivepowerofthefull-scale3DKCS modelwerethenpredictedatthesamespeeds.Theresultingfrictionalresistancevaluesofthepresent studywerethencomparedwitheachotherandwithresultsobtainedusingthesimilaritylawanalysis. Theincreaseintheeffectivepowerofthefull-scaleKCShullwaspredictedtobe18.1%foradeteriorated coatingorlightslimewhereasthatduetoheavyslimewaspredictedtobe38%atashipspeedof24 knots.Inaddition,itwasobservedthatthewaveresistanceandwavesystemsaresignificantlyaffected bythehullroughnessandhenceviscosity.
©2016TheAuthors.PublishedbyElsevierLtd.ThisisanopenaccessarticleundertheCCBYlicense (http://creativecommons.org/licenses/by/4.0/).
1. Introduction
Shippinghasbeen,andstillis,oneofthemostimportant meth-odsoftransport, withmorerelianceandimportancenowbeing placedonthismodeoftransportasaconsequenceofadvancesin shippingtechnologyandtheabilityofshipstostoreandtransport increasingcapacitiesofgoods.However,theseimprovementsbring someproblemstotheindustryduetoanincreaseinfuel consump-tion,whichisdetrimentaltotheenvironmentandwhicherodes companyrevenues.Althoughotherformsoffuelpowerexist,such aswindenergyandsolarpower,carbon-basedfueliscurrentlythe onlywayforshipstoruneffectively.Forthisreason,minimising fuelconsumptioniscrucialforshippingcompanies.Such compa-nieshavethereforeattemptedtodeterminetheoptimumoperation andmaintenanceapproachestoeitherdecreasethecostof opera-tionsortoincreasetheprofitofthecompany.Thereleaseofharmful gasesduetotheuseofcarbon-basedfuelisanotherreasonthat shippingcompaniesshouldaimtoreducethefuelconsumptionof theirships.Someregulations,suchastheEnergyEfficiencyDesign
∗Correspondingauthor.
E-mailaddress:[email protected](Y.K.Demirel).
Index(EEDI)[1]andtheShipEnergyEfficiencyManagementPlan (SEEMP)[2],andrecommendedpracticessuchastheEnergy Effi-ciencyOperationalIndicator(EEOI)[3]have beenimplemented inrecenttimestolimit thequantitiesofharmfulgasesthatare releasedintotheenvironmentasaresultofthefuelconsumedby ships.
Althoughshippingismarginallymoreenvironmentallyfriendly thanotherformsoftransportation,suchasaviationandland,it wasreportedthatshipsreleased870milliontonsofCO2in2007,
whichisequivalentto2.7%ofthetotalCO2emissionsthatyear[4].
TheInternationalMaritimeOrganization(IMO)hasthereforebeen forced,dueinparttoanincreaseinpublicawareness,todevise andimplementenergyefficiencyandGHGregulations.As95%of theworld’scargoistransportedbysea[5],ameansofreducingthe frictionalresistanceofshipswoulddramaticallyreducetheirfuel consumption,leadingtoreducedcarbonemissionsworldwide.The bestmethodtoreducefrictionalresistanceistoapplyatreatment toaship’shull,tominimiseitsphysicalandbiologicalroughness. Physicalroughnesscanbeminimisedbyapplyingsome preventa-tivemeasures,butbiologicalroughness(fouling)ismoredifficult tocontrol.
Marinebiofoulingisanincreasingproblemfrombotheconomic andenvironmentalpointsofviewintermsofincreasedresistance,
http://dx.doi.org/10.1016/j.apor.2016.12.003
Nomenclature
ks Equivalentsandgrainroughnessheight
Rt50 Averagehullroughness
ı Boundarylayerthickness u frictionvelocityFrictionvelocity
U+ Roughnessfunction
k+ RoughnessReynoldsnumber
vonKarmanconstant
y+ Non-dimensionalwalldistance
B Smoothwalllog-lawintercept
Density
¯
ui AveragedCartesiancomponentsofthevelocity vec-tor
uiuj Reynoldsstresses p Meanpressure ¯
ij Meanviscousstresstensorcomponents
Dynamicviscosity
t Timestep V Shipspeed U Axialvelocity L Shiplength
LBP Lengthbetweentheperpendiculars
LWL Lengthofwaterline
BWL Beamatwaterline
D Depth
T Designdraft S Wettedsurfacearea
Displacement CB Blockcoefficient
1+k Formfactor Fr Froudenumber Re Reynoldsnumber RT Totalresistance RF Frictionalresistance RR Residuaryresistance
RW Waveresistance
RVP Viscouspressureresistance PE Effectivepower
CT Totalresistancecoefficient
CF Frictionalresistancecoefficient
CR Residuaryresistancecoefficient
CW Waveresistancecoefficient
CVP Viscouspressureresistancecoefficient
CT,smooth Totalresistancecoefficientinsmoothcondition
CT,rough Totalresistancecoefficientinroughcondition
CT Increaseintotalresistancecoefficientduetosurface
roughness
CF Addedresistancecoefficientduetosurface
rough-ness
PE Increaseineffectivepowerduetosurfaceroughness
D(%) Relativedifference pa Apparentorder r,r21,r32 Gridrefinementfactors
k Keyvariableonthekthgrid
21
ext Extrapolatedvalue
e21
a Napproximaterelativeerror
e21
ext Extrapolatedrelativeerror
GCI21fine Fine-gridconvergenceindex
increasedfuelconsumption,increasedGHGemissionsand trans-portationofharmfulnon-indigenousspecies(NIS).Itshouldbekept inmindthatevenasmallamountoffoulingmayleadtoasignificant
increaseinfuelconsumption.Inparticular,hard-shelledfoulingcan causeaconsiderableriseinshipfrictionalresistance,andhencea ship’sfuelconsumption.Hard-shelledbarnaclescanalso deterio-ratethepaintandcauseotherproblemssuchascorrosion.Itshould benotedthattheimpactoffoulingonshipperformanceisgreatly dependentonthetypeandcoverageoffouling[6].
Duetoitsnegativeeffects onship efficiencyandthemarine environment,itisverydesirabletomitigatetheaccumulationof biofoulingonshiphulls.Marinecoatingsareprevalentlyusedto smoothhullsurfacesandifappliedwithapropercathodic pro-tectionsystemalsopreventscorrosion[7].Anidealmarinecoating shouldbesmoothenoughtoimprovethesurfacepropertiesofahull intheasappliedconditionandshouldbeeffectiveagainstmarine biofoulingwhichoccursovertime.
While improving the energy efficiency of existing ships retrofittedwithnewantifouling(AF)paints,itisequally impor-tanttoaccuratelymodelthepotentialeffectsofbiofoulingonship resistanceandtodemonstratetheimportanceofthemitigation of sucheffects by carrying out scientific research. However,at present,thereisnocompletemethodavailabletopredicttheeffect ofbiofoulingonshipfrictionalresistance.TheITTC[8]therefore rec-ommendsresearcherstodevelopnewformulaeormethods,using experimentaldata,forthepredictionoftheeffectsofcoatingsand biofoulingonshipresistance
Granville [9,10] proposeda similarity lawscaling procedure forthepredictionoftheeffectsofaparticularroughnessonthe frictionalresistanceofanyarbitrarybodycoveredwiththesame roughness,utilisingtheexperimentallyobtainedroughness func-tionsofsuchsurfaces.Theonlyrealassumptionofthemethodis thattheouterlayersimilarityholdsinthemeanvelocityprofilesfor smoothandrough-wallboundarylayers.Thatistosay,the velocity-defectprofilescollapsetoasinglecurveintheouterlayer.Some examplesoftheuseofthismethodaregivenbyLoebetal.[11], HaslbeckandBohlander[12],Schultz[6,13–15],Shapiro[16],Flack andSchultz[17]andSchultz,Bendick[18].Recently,Walkeretal. [19]conductedexperimentsusingboth antifoulingand fouling-releasehullcoatingsandscaleduptheresultstopredicttheeffects ofthesecoatingsonamid-sizednavalship.Grigson[20]proposed amethodwhichispartlyexperimentalandpartlytheoretical,just liketheonesproposedbyGranville[9,10].Somenumerical meth-odswerealsoproposedforgeneralroughsurfacesratherthanhull roughness,suchasChristophandPletcher[21],Lakehal[22]and Gre´ıgoireetal.[23].
WhenitcomestoCFD-basedmodels,therearefewerstudies investigatingtheroughnesseffectsofcoatingsandbiofoulingon shipresistance.Patel[24]mentionedthatthemostcomplex prob-lemsforCFDarefullscaleReynoldsnumberflowsandsimulating surfaceroughness.Currently,physicalmodellingoftheroughness sources,suchascoatingsorbiofouling,inCFDispractically impos-sibleduetotheircomplexgeometries.However,oncetherelation ofU+=f(k+)isknown,itcanbeemployedinthewall-function
or theturbulence modelsof theCFD software,as discussedby Patel[24].TheuseofCFD-basedunsteadyRANSmodelsisofvital importance,sincethephenomenoncanbesimulatedbymeansof afullynon-linearmethod.Forinstance,oneparticularroughness Reynoldsnumbervalue,k+,androughnessfunctionvalue,U+,are
takenintoconsiderationwhenapredictionismadeforaspecific conditioninthesimilaritylawscalingprocedureofGranville[9]. However,thek+vs.U+valueisnotuniformevenonaflatplate
duetodifferencesinthefrictionvelocity,u,distribution.Thatisto say,uvariesalongtheflatplate.Thiseffect,however,canbe sim-ulatedusingCFD-basedmodelsasuisdynamicallycomputedfor eachdiscretisedcell.Therefore,theresultingfrictionalresistance canbemoreaccuratelycomputedusingCFDmethods.
eitherusingwall-functions(e.g.Sugaet al.[25],Apsley[26])or usingnear-wallresolution (e.g.Krogstad[27],Aupoix[28]).Ec¸a andHoekstra[29]showedthattheeffectofuniformsand-grain roughnessonthefrictionalresistanceofflatplatesoffull-scaleship lengthsatfull-scaleshipspeedscanbeaccuratelysimulatedusing eitherwall-functionsor near-wallresolution. Dateand Turnock [30]demonstratedtherequiredtechniquestopredicttheskin fric-tionofflatplatesusing RANSsolvers andalsoshowedthatthe effectofsurfaceroughnessonskinfrictioncanbepredictedusing CFDsoftware.Theymodifiedthewall-functionsofapieceof com-mercialCFDsoftwarebymodifyingthewallfunction-coefficient (log-layerconstant).Nevertheless,thismethoddoesnotdirectly reflecttheroughnesseffectonthefrictionalresistanceanddoes notcomputetheseeffectsdynamically.Leer-Andersenand Lars-son[31],ontheotherhand,employedroughnessfunctionsin a commercialCFDcodeandpredictedtheskinfrictionoffullscale ships.However,theyusedaspecificmoduleofthesoftware,which incorporatesthin boundarylayermethodswithapotentialflow solver,andthestudydoesnotincludeunsteadyRANScalculations. Izaguirre-Alzaet al.[32] usedthe CFDsoftware package STAR-CCM+tosimulatetheirexperimentsandvalidatetheroughness featureofthesoftware.Althoughthecomparison showsa very goodagreementbetweentheexperimentaldataand the evalu-atedresults,thereisnoevidenceoftheuseofaspecificroughness functionmodel,ratherthanthebuilt-inroughnessfunction.Khor andXiao[33]investigatedtheeffectsoffoulingandtwo antifoul-ingcoatingsonthedragofafoilandasubmarinebyemployinga CFDmethod.Theyusedtheequivalentsandgrainroughnessheight andthebuilt-inwall-functionwhichconsiderstheuniform sand-grainroughnessfunctionmodelproposedbyCebeciandBradshaw [34],basedonNikuradse’sdata[35].Currently,theITTC[36]isstill questioningthevalidity oftheroughnessmodelandequivalent sandgrainroughnessusedinCFDapplicationsforhullroughness, sinceit isknownthat thebuilt-inroughness functionmodel is basedonuniform, closely packedsand roughness,whereas the roughnessfunctionsofrealengineeringsurfacesdonotshowthis behaviour.Castro,Carrica[37]carriedoutunsteadyRANSCFD sim-ulationsofafull-scaleKCSmodelwithhullcoatingroughnessusing wall-functions.However,theyusedaconstantroughnessfunction andtheroughnessallowanceformulationproposedbytheITTC [38].Theydidnot attempttoemploya newtypeof roughness functionmodelwhichismoreappropriateforrealengineering sur-faces,especiallyforfouledsurfaces.Recently,Demireletal.[39] proposedaCFDmodelforthefrictionalresistancepredictionof antifoulingcoatings.Haaseetal.[40]showedtheapplicabilityof theCFDapproachtopredictthesandgrainroughnesseffectson thefrictionalresistanceofflatplatesaswellasontheresistanceof catamarans.
Asdiscussedabove,currentnumericalmethodsforthe predic-tionoftheeffectofbiofoulingonfrictionalresistancearelimited bytheuseofboundarylayersimilaritylawanalysis.Thismethod canonlycalculatetheeffectofagivensurfaceroughnessonthe frictionalresistanceofaflatplateofshiplength.Althoughthiscan beseenasareasonableassumption,sincethesurfaceroughness isnotexpectedtosignificantlyaffectthepressuredrag,itisstill worthinvestigatingthephenomenonbymeansofafullynonlinear method,suchasCFD,toinvestigatetheroughnesseffectof biofoul-ingontheresistancecomponentsofashipindetail.Inaddition, atypicalCFDworkcouldtaketheeffectofspatialdistributionof foulingonthetotaldragofthehullintoconsideration.
Tothebestofthisauthor’sknowledge,nospecificCFDmodel existstopredicttheroughnesseffectofbiofoulingonship resis-tance.Theaimofthepresentpaperisthereforetofillthisgapby employingamodifiedwall-functionintheCFDsoftwarepackage andtoinvestigatetheroughnesseffectofbiofoulingonthe resis-tancecomponents.Theproposedapproachenablestheprediction
oftheresistancecoefficientsoffull-scale3Dshiphullsbearinga typicalcoatingandarangeoffoulingconditions.
Themainadvantageoftheproposedmodelisthatitenablesthe useofasimpleroughnesslengthscaletopredicttheeffectof bio-foulingonfrictionalresistanceofaflatplateofshiplength,similar tothatofDemireletal.[39]aswellasontheresistancecomponents andeffectivepowerofafull-scaleship.
Inthisstudy,theexperimentaldataofSchultzandFlack[41] wereusedtoestablisha suitable roughnessfunctionmodel for differentfoulingconditions.Correspondingroughnessheightsof Schultz[6]representingdifferentfoulingconditionswereusedto modelthedifferentsurfaces.Thisroughnessfunctionmodelwas thenemployedinthewall-functionoftheCFDsoftwarepackage STAR-CCM+.
Followingthis,atypicalcasestudywasperformedthroughCFD simulationsoftowingtestsinvolvingaflatplateoflength232.5m, representingtheKrisoContainerShip(KCS),withdifferentsurface conditionsatdifferentservicespeeds.Frictionalresistance coeffi-cientswerecomputedandtheincreasesinthefrictionalresistance oftheflatplaterepresentingKCSduetosuchfoulingconditions werepredicted.
UnsteadyRANS CFDsimulations of the roughness effects of marinecoatingsandbiofoulingonthefull-scale3DKCSwerethen performedusingthe sameCFDmodel. Afull-scale 3DKCS hull appendedwitharudderwasusedduetotheexistenceofavailable experimentaldataforcomparisonpurposes,andinordertoenable areasonablecomparison. Themodelwasfirsttowed insmooth conditionsatadesign speedof24knotsandtheresultingtotal resistancecoefficientwascomparedandvalidatedwiththetotal resistancecoefficientextrapolated usingtheexperimentaldata. Followingthis, typical parametriccase studies wereperformed atadesign speedof 24knotsandaslowsteamingspeed of19 knots.Theseinvolvedchangingthesurfaceconditionsby employ-ingtheroughnessfunctionmodeland correspondingroughness lengthscalesproposed,torepresentatypicalcoatingandarange offoulingconditions,whileholdingtheotherparametersconstant. Frictional,residuary and total resistancecoefficientsof theKCS weredirectlycomputedwhereasthewaveresistancecoefficients werecalculatedusingtheformfactoroftheKCS.Theeffectofhull roughnessonthewavesystemswerealsoinvestigated.Moreover, theincreasesintheeffectivepoweroftheKCSduetosuchsurface conditionswerepredictedusingthepresentresults.
Thepresentresults,obtainedusingflat-plateCFDsimulations and using full-scale 3D KCS model were compared with each otherandwiththoseobtainedusingthesimilaritylawanalysisof Granville[3].
Thispaperisorganisedasfollows:Theroughnessfunctionsused torepresentarangeofbiofoulingconditionsarepresentedin Sec-tion2,while a newwall-function formulation is proposedand detailsofthenumericalsetuparecoveredinSection3.InSection4, theCFDresultsobtainedusingflat-plateandfull-scale3Dapproach werepresentedtogetherwiththeresultsobtainedusingthe sim-ilaritylawanalysis.Finally,theresultsofthestudyarediscussed inSection5,alongwithrecommendationsforfutureavenuesof research.
2. Roughnessfunctions
Thevelocityprofileinthelog-lawregionoftheturbulent bound-arylayercanbedefinedby
U+= 1ln(y+)+B−U+ (1)
inwhichisthevonKarmanconstant,y+isthenon-dimensional
Fig.1.Roughnessfunctionvs.roughnessReynoldsnumbers[6].
canrepresentthechangeinthevelocityprofileduetoroughness usingU+,andthevelocityprofilecanbedefinedbysimply
sub-tractingU+fromthesmoothvelocityprofile.Itshouldbeborne
inmindthatU+simplyvanishesinthecaseofasmooth
condi-tion.U+valuesaretypicallyobtainedexperimentally,sincethere
isnouniversalroughnessfunctionmodelforeverykindof rough-ness.ReferencemaybemadetoJiménez[42]foracomprehensive reviewonroughwallturbulentboundarylayers.
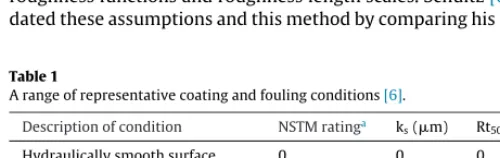
SchultzandFlack[41]determinedtheroughnessfunctionsfor threedimensionalroughsurfacessimilartothoseusedby Shock-lingetal.[43].Schultz[6]proposedthattheroughnessfunction behaviourofarangeoffoulingconditionsfollow theroughness functionsofSchultzandFlack[41]andShocklingetal.[43],based onhispreviousworkpresentedinSchultz[15].Thisisa reason-ableassumption,sincetheroughnessfunctionsofrealsurfacesare expectedtoshowbehaviourthatisbetweenthemonotonic Cole-brookandinflectionalNikuradsetyperoughnessfunctions,suchas thosepresentedbySchultzandFlack[41]andShocklingetal.[43], asshowninFig.1.Inaddition,Schultz[6]presentedtheequivalent sandroughnessheightsforarangeofcoatingandfouling condi-tionstogetherwiththeNSTM(NavalShips’TechnicalManual)[44] ratingandaveragecoatingroughness(Rt50)basedonhisextensive
experimentsincludingSchultz[15](Table1).
Inthispaper’sstudy,theroughnessfunctionvaluesofSchultz andFlack[41]showninFig.1wereusedtodeveloparoughness functionmodeltobeemployedintheCFDsoftwaretorepresent thecoatingandfoulingconditionsgivenbySchultz[6],asshown inTable1.
Thepresentpredictionsweremadebasedontheassumptions that the given fouling conditions can be represented by these roughnessfunctionsandroughnesslengthscales.Schultz[6] vali-datedtheseassumptionsandthismethodbycomparinghisresults
Table1
Arangeofrepresentativecoatingandfoulingconditions[6]. Descriptionofcondition NSTMratinga k
s(m) Rt50(m)
Hydraulicallysmoothsurface 0 0 0
TypicalasappliedAFcoating 0 30 150
Deterioratedcoatingorlightslime 10–20 100 300
Heavyslime 30 300 600
Smallcalcareousfoulingorweed 40–60 1000 1000
Mediumcalcareousfouling 70–80 3000 3000
Heavycalcareousfouling 90–100 10000 10000
aNSTM[44].
withotherstudiessuchasHundleyandTate[45]andHaslbeckand Bohlander[12],documentingtheeffectsofcoatingsandbiofouling onshippoweringthroughfull-scaletrials.
An appropriate roughness function model was fitted to the roughnessfunctionvaluesofSchultzandFlack[41],giveninEq. (5).Thisroughnessfunctionmodelispresentedsuchthatitisin theformofthebuilt-inroughnessfunctionmodelofSTAR-CCM+ forapplicationconvenience.
3. Numericalmodelling
3.1. Mathematicalformulation
An Unsteady Reynolds-Averaged Navier-Stokes (URANS) methodwasusedtosolvethegoverningequationsinthisstudy. Thesemassandmomentumconservationequationsweresolved bythecommercialCFDsoftwareSTAR-CCM+.Theaveraged con-tinuityand momentumequations for incompressible flowsare givenintensornotationandCartesiancoordinatesbyEqs.(2)and (3)
∂
(u¯i)∂
xi =0, (2)∂
(u¯i)∂
t +∂
∂
xju¯iu¯j+uiuj
=−
∂
p¯∂
xi+
∂
¯ij∂
xj(3)
whereisdensity, ¯uiistheaveragedCartesiancomponentsofthe velocityvector,uiujistheReynoldsstressesandpisthemean pressure. ¯ij arethemean viscousstresstensorcomponents,as showninEq.(4)
¯
ij=
∂
u¯i∂
xj+
∂
u¯j∂
xi(4)
inwhichisthedynamicviscosity.
Thesolverusesafinitevolumemethodwhichdiscretisesthe governingequations.Asecondorderconvectionschemewasused forthemomentumequationsandafirstordertemporal discreti-sationwasused.Theflowequationsweresolvedinasegregated manner.The continuity and momentumequations were linked withapredictor-correctorapproach.
TheSST(ShearStressTransport)k-turbulencemodelwasused inordertocompletetheRANSequations,whichblendsthek-
modelnearthewalland thek-modelinthefarfield.For the flat-platesimulations,theCourant-Frederich-Lewis(CFL)number wasalwaysheldatvalueslessthanunitytoensurethe numeri-calstability.ItisofnotethattheITTC[36]recommendtheuseof
t=0.005∼0.01L/V,whereLisshiplengthandVisshipspeed,for theselectionofthetimestep.However,thetimestepsizeofthe simulationsoftheKCShullwassetto∼0.0005LBP/V,whichisten
[image:4.646.42.292.655.734.2]Fig.2.TheproposedCFDroughnessfunctionmodeltogetherwiththeroughness functions.
3.2. Proposedwall-functionapproachforfoulingconditions
Anappropriateroughnessfunctionmodelforarangeof repre-sentativecoatingandfoulingconditionsforuseinSTAR-CCM+is proposedbyEq.(5).
U+=
⎧
⎪
⎪
⎪
⎪
⎪
⎪
⎨
⎪
⎪
⎪
⎪
⎪
⎪
⎩
0→k+<3
1
ln
0.26k+sin
2
log(k+/3) log(5)
→3<k+<15
1
ln
0.26k+
→15<k+(5)
ShownforcomparisoninFig.2istheproposedroughness func-tionmodelgivenby(5)and roughnessfunctionsofSchultzand Flack[41].
Theproposedmodelforarangeofrepresentativecoatingand biofoulingconditionsinthispaperisinasimilarformtothebuilt-in wallfunctionofSTAR-CCM+intermsofflowregimes.Thatistosay, theproposedroughnessfunctionmodelandthewall-lawhave3 flowregimes,namelyahydraulicallysmoothregime,a transition-allyroughregimeandafullyroughregime,whicharesimilarto thoseproposedbyCebeciandBradshaw[34]basedonNikuradse’s data[35].ItisevidentfromFig.2thatanexcellentagreementis achievedinthefullyroughregime whileareasonable matchis obtainedinthetransitionallyroughregime.Generalinformation aboutthewall-functionapproachanddetailsoftheapplicationof roughnessfunctionsthroughwall-functionscanbefoundin[39].
3.3. Geometryandboundaryconditions
ThegeometryoftheplaterepresentingtheKCSisshowninFig.3. Theboundaryconditionsofthesimulationswerechosento repre-senttheplatebeingcompletelysubmergedinaninfinite ocean, withsimilaritytothefullscalepredictionsimulationspresentedin [39].Theboundaryconditionsandthepositioningofthe bound-arieswerethereforechosentobesimilartothosegivenin[39],as showninFig.4.
TheKRISOContainerShip(KCS)appendedwitharudderwas usedinthispaper’sfull-scale3Dsimulationssinceexperimental dataforthishullispubliclyavailableandalargebodyofrelated CFDstudiesexistintheliterature(e.g.Larssonetal.[46],Zhang [47],Castroetal.[37],Carricaetal.[48]andTezdoganetal.[49]).
Fig.3.TheplatesrepresentingtheKCS.
Fig.4.a)profileviewofthedomainandb)topviewofthedomain,showingthe dimensionsandboundaryconditions[39].
Table2
PrincipalparticularsoftheKCS,adaptedfromTezdoganetal.[49]andKimetal. [50].
Lengthbetweentheperpendiculars(LBP) 230.0m
Lengthofwaterline(LWL) 232.5m
Beamatwaterline(BWL) 32.2m
Depth(D) 19.0m
Designdraft(T) 10.8m
Wettedsurfacearea 9498m2
Displacement() 52030m3
Blockcoefficient(CB) 0.6505
DesignSpeed 24knots
Froudenumber(Fr) 0.26
Additionally,theKCShasaverysimilarshapetocommercial con-tainerships,meaningtheresultswillgiveanindicationofhow foulingeffectstheperformanceofrealcommercialcontainerships. Theprincipalparticulars,bodyplansandsideprofilesofthe full-scaleKCSmodelaregiveninTable2(adaptedfromTezdoganetal. [49]andKimetal.[50]),andFig.5[50],respectively.
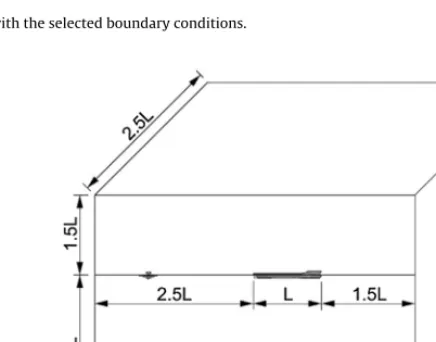
The boundaryconditions of thesimulations were chosento representthefull-scaleKCSmodelbeingtowedinadeepwater condition.Fig.6depictsanoverviewofthedomainwiththeKCS modelandtheselectedboundaryconditions.
[image:5.646.321.532.75.377.2] [image:5.646.33.285.348.423.2] [image:5.646.305.553.448.540.2]Fig.5.BodyplanandsideprofilesoftheKCSmodel[50].
Fig.6. Anoverviewofthedomainwiththeselectedboundaryconditions.
shouldbekeptinmindthattheinitialflowvelocityatallinlet con-ditionswassettothevelocityoftheflatwave,i.e.ashipspeedof 24knots,inthenegativex-direction.Theselectionofthevelocity inletforthetopandsideofthedomainthereforeenablestheflow atthetopandsideofthedomaintobeparalleltotheoutlet bound-ary,whichpreventsreflectionsfromtheseboundaries.Inaddition, therepresentationofthedeepwaterandinfiniteairconditionswas facilitatedbytheuseofavelocityinletboundaryconditionforthe topandbottomboundaries.TheKCShullitselfhasano-sliprough wallconditiontorepresenttheroughnessonthehull.
Anothercriticalselectionisthepositioningoftheboundaries, especiallythedownstreamoutletboundaryandtheupstreaminlet boundary.Theinletisplacedat∼1.5LBPlengthsupstreamandthe
outletboundaryisplacedat∼2.5LBPlengthsdownstream,toensure
boundaryindependentsolutionsareproduced.Similarly,thetop islocatedat∼1.5LBPandthebottomandthesidearepositioned
at∼2.5LBPawayfromtheKCShull.Itisofnotethattheselection
oftheseboundaryconditionsand thepositioningofthe bound-ariesweremadebasedontherecommendationsandapplications reportedinCD-ADAPCO[51].Thelocationsoftheboundariesare showninFig.7.
ItshouldbenotedthattheVOFwavedampingcapabilityofthe softwarewasappliedtotheoutletandallvelocityinletboundaries, namelytheinlet,bottom,topandside,withadampinglengthequal to∼1LBP,topreventreflectionsfromtheseboundaries.
3.4. Meshgeneration
Acut-cellgridwithprismlayermeshonthewallswas gener-atedusingtheautomaticmeshgeneratorinSTAR-CCM+.Additional refinementswereappliedtogivefinergridsinthecriticalregions, suchastheareaimmediatelyaroundtheplate,theareasaround thetrailingand leadingedges,andthetopedgeof theplateas
Fig.7. Thepositionsoftheboundaries.(L:lengthoftheshipbetween perpendicu-lars).
wellastheareaimmediatelyaroundthehullandrudder,thearea wherethebowencountersthefreesurface,theareawherewater breakswiththehullstern,andtheareainthewakegeneratedbythe ship.Themeshgenerationwasachievedusingsimilartechniquesto thoseexplainedin[39].Also,convergencetestswereperformedto ensuregrid-independentmeshconfigurations,aswellastopredict theuncertaintyoftheCFDsimulations.
[image:6.646.146.459.87.362.2] [image:6.646.328.546.394.565.2]Table3
Totalcellnumbersforflatplate.
SurfaceCondition(ks[m]) Cellnumbers
ks=0,ks=30,ks=100,ks=300 5.5×10⁶
ks=1000 5.28×10⁶
ks=3000 4.5×10⁶
ks=10000 4×10⁶
Table4
Totalcellnumbersforthefull-scaleKCShull.
SurfaceCondition(ks[m]) Cellnumbers
ks=0,ks=30,ks=100,ks=300 4.09×10⁶
ks=1000 4.00×10⁶
ks=3000 3.70×10⁶
ks=10000 3.58×10⁶
inTable4forthefull-scalesimulationsoftheKCShull.Near-wall meshgenerationmustbeperformedwithcaresincethisisdirectly relatedtothehullroughnessduetomarinecoatingsandbiofouling. Theprismlayerthicknessandprismlayernumberswere,therefore, determinedsuchthaty+isalwayshigherthan30,andhigherthan
k+,asperCD-ADAPCO[51]’ssuggestion.
Fig.8showscross-sectionsofthemesheddomainwhereasFig.9 showsthevolumemeshontheKCShullandrudder.Itisofnote that,fromthispointonward,thefiguresshowthewholesectionsas ifthereisnosymmetricalboundary,owingtothevisualtransform featureofthesoftware.
Fig.8demonstratesthecross-sectionfromthecentrelineofthe hullandthefreesurfaceandshowsonlyaportionofthe
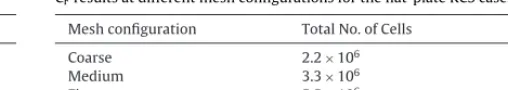
cross-Table5
CFresultsatdifferentmeshconfigurationsfortheflat-plateKCScase.
Meshconfiguration TotalNo.ofCells CF(CFD)
Coarse 2.2×10⁶ 0.0020086
Medium 3.3×10⁶ 0.0020145
Fine 5.5×10⁶ 0.0020222
sectionsforvisualconvenience,sincethedomainisratherlarge. TherefinementstocapturethefreesurfaceandKelvinwakeare clearlyvisibleinFig.8.
Fig.9clearlyshowstheeffectsofadditionalrefinementsonthe KCShullandrudder,especiallytheonesappliedtothefreesurface, bowandsternregions.
4. Results
4.1. Gridsensitivitystudy
Systematicstudieswereperformedusingtheflatplatescovered withheavyslimeandusingtheKCShullappendedwitharudder withasmoothsurfacecondition,inordertocarryoutagrid sensi-tivitystudyandtopredicttheCFDuncertainties.Inordertoobserve theeffectofcellnumbersonthekeyvariable,(CFinflat-platecase
andCTinfull-scaleKCShullcase),thedomainwasdiscretisedin
threedifferentresolutionsandthesimulationswererunforeach configuration.Thegridrefinementfactor,r,waschosentobe√2as usedbyTezdoganetal.[49].
[image:7.646.300.554.74.119.2] [image:7.646.33.283.75.128.2] [image:7.646.111.475.384.727.2]Fig.9.Volumemeshesonthea)bow,b)sternoftheKCShullandrudder.
Table6
CTresultsatdifferentmeshconfigurationsforthefull-scaleKCSat24knots(Relative
Difference,D(%),isbasedontheCTvalueextrapolatedusingtheexperimentaldata
ofKimetal.[50]).
Meshconfiguration TotalNo.ofCells CT(CFD) D(%)
Coarse 1.07×10⁶ 0.002120 2.30
Medium 2.04×10⁶ 0.002113 1.94
Fine 4.09×10⁶ 0.002097 1.17
Thefrictionalresistancecoefficientsforeachmesh configura-tionwerecomputedandaregiveninTable5fortheflat-plateKCS case.
Similarly,thetotalresistancecoefficientsforeachmesh config-urationwerecomputedatadesignspeedof24knotsandaregiven in
Table6forfull-scalesimulationofKCShull.
FromTables5and6itisevidentthatthevariationindragwith a√2refinementratioarebelow∼0.8%andthatthetotalresistance coefficientwasover-predictedby1.17%.Therefore,thefinemesh configurationwasselectedinallsubsequentcomputations.
4.2. Verificationstudy
Averificationstudyshouldbecarriedouttoshowthecapability oftheproposedmodelandthesoftwareforparticularcalculations. TheGridConvergenceIndex (GCI)MethodbasedonRichardson extrapolation[52,53]wasusedinthispaper’sworkfor discretisa-tionerrorestimationasdescribedbyCelik,Ghia[54].
Theapparentorderofthemethod,pa,iscalculatedby
pa= 1 ln(r21)|
ln|ε32/ε21|+q(pa)| (6)
q(pa)=ln
r21pa−s r32pa−s
(7)
s=1·sign
ε32/ε21(8)
wherer21andr32arerefinementfactors,i.e.√2inthisstudy,and
32=3−2,ε21=2−1,kisthekeyvariable,i.e.CFandCTin
thiscase,onthekthgrid.
Theextrapolatedvaluesareobtainedby
21ext=
r21p 1−2/
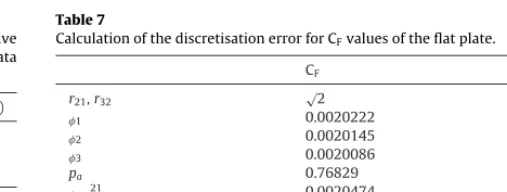
r21p −1 (9)Table7
CalculationofthediscretisationerrorforCFvaluesoftheflatplate.
CF
r21,r32 √2
1 0.0020222
2 0.0020145
3 0.0020086
pa 0.76829
ext21 0.0020474
ea21 0.38077%
eext21 1.2327%
GCIfine21 1.5601%
Table8
CalculationofthediscretisationerrorforCTvaluesofthefull-scaleKCS.
CT
r21,r32 √2
1 0.002097
2 0.002113
3 0.002120
pa 2.3853
ext21 0.0020846
ea21 0.76299%
eext21 0.59698%
GCIfine21 0.7418%
Theapproximateandextrapolatedrelativeerrorsarecalculated usingthefollowingequations,respectively.
e21a =|1−2
1 |
(10)
e21
ext=| 12
ext−1
12
ext
| (11)
Thefine-gridconvergenceindexiscalculatedby
GCIfine21 =1.25e21a
r21p −1 (12)
TherequiredparameterswerecalculatedforCFandCTvalues
andarepresentedinTable7fortheflatplateandinTable8forthe full-scaleKCS.
AscanbeseenfromTables7and8,numericaluncertaintiesof 1.56%,0.74%werecalculatedforthecomputedCFandCT values
[image:8.646.126.486.56.266.2] [image:8.646.311.565.317.413.2] [image:8.646.42.295.335.379.2]Fig.10. WaveprofilealongKCSat24knots.
4.3. Validationstudy
TheavailableexperimentaldatafortheKCSwasusedto val-idatetheCFDapproachusingthesmoothcondition.Duringthe towingtanktestsconductedbyKimetal.[50],theresiduary resis-tancecoefficientfora1/31.6scalemodeloftheKCSwasfoundtobe 7.250×10⁻⁴,atthecorrespondingmodelspeedforthefull-scale
speedof24knots(Fr=0.26).Giventhattheresiduaryresistance is a function of Froude number, the residuary resistance coef-ficient of the full-scale KCS model is assumed tobe the same (CR=7.250×10⁻⁴)andthefull-scale frictionalresistance
coeffi-cient,CF,is calculatedtobe1.347×10−3,usingthe“ITTC1957
model-shipcorrelationline”atthecorrespondingReynolds num-ber.Thetotalresistancecoefficientofthefull-scaleKCSmodelis thereforepredictedtobe2.0725×10−3.Itisofnotethatform
fac-tor,(1+k),wasnottakenintoaccountwhileextrapolating. Table6demonstratesthetotalresistancecoefficientscomputed byCFDandextrapolatedusingtheexperimentaldataofKimetal. [50],atashipspeedof24knots.Ascanbeseenfrom
Table6,thecomputedtotalresistancecoefficient,CT,isin
excel-lentagreementwiththis extrapolateddata,withadifferenceof only∼1.17%.ThisCFDapproachcanthereforebeclaimedtobe val-idatedandcanbeusedforfurtherinvestigations.Thismodelwas thereforeusedthroughoutallthecases.
ShownforcomparisoninFig.10isthecomputedwaveprofile alongthehullsurfaceoftheKCStogetherwiththewaveprofile measuredduringthetowingtanktestsconductedbyKim etal. [50].Fig.16showstheglobalwavepatternaroundthehullsurface oftheKCSwhereasFig.17showsthewaveprofilealongalinewith constanty=0.1509.TheKelvinwakegeneratedbytheshipisclearly visibleinFig.16.
ItisevidentfromFigs.10,16(smoothcondition)andFig.17 (smooth condition) that a very good agreement is achieved betweenthecurrentCFDmodelandtheexperimentaldataofKim etal.[50],aswellastheotherCFDsimulationsperformedbyother researchers(e.g.Carricaetal.[55]andCastroetal.[37]).
4.4. Effectsofhullroughness
Beforeinvestigatingtheeffectsofhullroughnessonthe resis-tancecomponentsofaship,itwouldbetimelytodescribethese componentsindetail.Thetotalresistance(drag)ofaship,RT,is mainlycomposedoftwocomponents;thefrictionalresistance,RF,
andtheresiduaryresistance,RR,asgivenby(13).
RT=RF+RR (13)
Thefrictionalresistancearisesduetoshearstressesonthehull surfacewhiletheresiduaryresistanceisthepressurerelateddrag whichconsistsofthewaveresistance,RW,andviscouspressure
Table9
ComparisonofthecomputedCFvaluesusingdifferentmethodsatfullscaleat24
knots(Re=2.89×10⁹)(RelativeDifference,D(%)isbasedonGranvillemethod).
SurfaceCondition(ks[m]) CF×103
CFD-KCShull Granville CFD-Flatplate
Result D(%) Result D(%)
0 1.421 5.52 1.347 1.351 0.3
30 1.577 7.32 1.469 1.496 1.84
100 1.840 5.01 1.752 1.750 −0.11
300 2.120 3.62 2.046 2.022 −1.17
1000 2.514 2.41 2.455 2.401 −2.20
3000 3.014 2.49 2.941 2.886 −1.87
10000 3.741 2.47 3.651 3.571 −2.20
resistance,RVP,oftheship.Thisrelationcanbeshowninamore explicitwayby(14),
RT=RF+RVP+RW (14) whereitisassumedRVP=kRF.Eq.(14)canbedefinedasfollows:
RT=RF+kRF+RW=(1+k)RF+RW (15) If these resistance components are non-dimensionalised by dividingeachtermbythedynamicpressureandwettedsurface areaoftheshiphull,theresistancecoefficientscanbedefinedas follows:
CT=CF+CR (16)
CT=CF+CVP+CW (17)
CT=(1+k)CF+CW (18) whereCTisthetotalresistancecoefficient,CFisthefrictional
resis-tance coefficient, CR is theresiduary resistance coefficient,CVP
viscouspressureresistancecoefficient,CWisthewaveresistance
coefficient.
4.4.1. Frictionalresistance
Havingperformedpredictionstudiesusingbothflatplates rep-resentingtheKCSandthefull-scaleKCSmodelitself,itwouldbe interestingtoalsocomparethesedifferentmethods.Therefore,the followingsectionaimstocompareanddiscusstheresultsobtained usingthedifferenttechniques.Thesetechniquesarefull-scale3D CFDsimulationsof theKCShull (referredtoas‘CFD-KCShull’), flatplateCFDsimulations(referredtoas‘CFD-Flatplate’)andthe similaritylaw scalingprocedureofGranville [9] (referredtoas ‘Granville’).
[image:9.646.80.509.56.192.2]Table10
ComparisonofthecomputedCFvaluesusingdifferentmethodsatfullscaleat19
knots(Re=2.29×10⁹)(RelativeDifference,D(%)isbasedonGranvillemethod).
Surfacecondition(ks[m]) CF×103
CFD-KCShull Granville CFD-Flatplate
Result D(%) Result D(%)
0 1.452 4.82 1.385 1.386 0.07
30 1.559 5.86 1.473 1.485 0.81
100 1.834 4.57 1.754 1.750 −0.23
300 2.115 3.30 2.047 2.022 −1.22
1000 2.509 2.10 2.457 2.401 −2.28
3000 3.006 2.11 2.944 2.886 −1.97
10000 3.733 2.14 3.655 3.578 −2.10
resultsobtainedusingGranvillemethodarelistedin thetables. SincetheexperimentalCFvaluesarenotavailable,onlytheresults
fromCFDandthesimilaritylawanalysisaregivenforthefrictional dragcoefficientsinthetable.
AsTable9and10jointlyshow,theresultsobtainedusingboth ofthepresentCFDmethodsusedinthispaperagreedwiththe resultsobtainedusingGranville’smethod,withdifferencesofless than∼7%.ThisindicatesthatthepresentCFDmodelstandsasa suitabletechniquewithwhichtopredictroughnesseffectsonthe frictionalresistanceofflatplatesofmodel-scaleandfull-scaleship lengths,andoffull-scale3Dshiphulls.Thephysicaladequacyof theCFDapproach wasthereforedemonstrated. Theresultsand comparisonsofHaaseetal.[40]alsosupporttheapplicabilityof thegeneralCFDapproachtoaccuratelyaccountfortheroughness effectsonthefrictionalresistanceofflatplatesandships.
ItisinterestingtonotethattheallCFvaluesobtainedatship
speedsof 24 knotsand 19 knotsusing “CFD-KCShull”method arehigherthanthoseobtainedusing“CFD-Flatplate”methodand thoseobtainedusing“Granville”method.
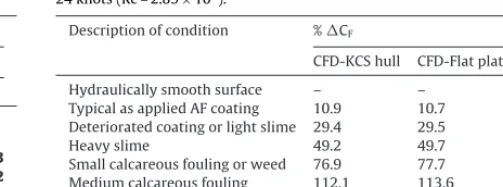
TheincreaseinthefrictionalresistanceoftheKCSdueto dif-ferentsurfaceconditionswithrespecttothoseofahydraulically smooth,predictedusingthedifferenttechniques,aredemonstrated inTable11andFig.11for24knotsandinTable12andFig.12for 19knots.
Table11
Comparisonofthecomputed%CFvaluesusingdifferentmethodsatfullscaleat
24knots(Re=2.89×10⁹).
Descriptionofcondition %CF
CFD-KCShull CFD-Flatplate Granville
Hydraulicallysmoothsurface – – –
TypicalasappliedAFcoating 10.9 10.7 9 Deterioratedcoatingorlightslime 29.4 29.5 30
Heavyslime 49.2 49.7 51.8
Smallcalcareousfoulingorweed 76.9 77.7 82.2 Mediumcalcareousfouling 112.1 113.6 118.3 Heavycalcareousfouling 163.2 164.3 171.0
Table12
Comparisonofthecomputed%CFvaluesusingdifferentmethodsatfullscaleat
19knots(Re=2.29×10⁹).
Descriptionofcondition %CF
CFD-KCShull CFD-Flatplate Granville
Hydraulicallysmoothsurface – – –
TypicalasappliedAFcoating 7.4 7.1 6.3 Deterioratedcoatingorlightslime 26.3 26.2 26.6
Heavyslime 45.6 45.9 47.8
Smallcalcareousfoulingorweed 72.8 73.3 77.4 Mediumcalcareousfouling 107.1 108.2 118.3 Heavycalcareousfouling 157.1 158.2 163.9
TheincreaseintheCFvaluesoftheKCSduetoaheavyslime
con-ditionatashipspeedof24knotswaspredictedtobe∼49%,∼50% and∼52%,byCFD-KCShull,CFD-FlatplateandGranville’smethods respectively,whereasthesevaluesalteredto∼163%,∼164%and ∼171%respectivelyforaheavycalcareousfoulingcondition,ascan beseeninTable11andFig.11.
TheresultspresentedinTable12andFig.12indicatethatthe increaseinCFoftheKCSduetoheavyslimeataslowsteaming
shipspeedof19knotswaspredictedtobe∼46%,∼46%and∼48%, byCFD-KCShull,CFD-FlatplateandGranville’smethods respec-tively,whereasthesevaluesalteredto∼157%,∼158%and∼164% respectivelyforaheavycalcareousfoulingcondition.
[image:10.646.311.563.83.176.2] [image:10.646.43.293.84.190.2] [image:10.646.312.564.220.314.2] [image:10.646.65.544.473.730.2]Fig.12.EstimationofthepercentageincreaseinthefrictionalresistanceoftheKCSduetodifferentsurfaceconditionsat19knots(Re=2.29×10⁹).
Theresultsobtainedusing“CFD-KCShull”methodpresentedin Tables11and12indicatethattheincreaseinCFduetothehull
roughnessofatypicalantifouling(AF)coatingis10.9%at24knots and7.4%at19knots,whereastheincreaseinCFduetobiofoulingis
predictedtobedramatic,whichwouldleadtoadrasticincreasein thefuelconsumptionandhenceCO2emissions.Theincreaseinthe
frictionalresistanceoftheKCSduetoadeterioratedcoatingorlight slimesurfaceconditionwaspredictedtobe29.4%atashipspeedof 24knotsandtobe26.3%atashipspeedof19knots.Thesevalues became49.2%and45.6%whencalculatingtheincreaseinCFdue
toaheavyslimecondition.Calcareousfoulingcausessignificant
increaseinCFvalues,rangingfrom∼77%to∼163%at24knotsand
∼73%to∼157%at19knots,dependingonthetypeofcalcareous foulingandshipspeed.
The resultspresented are in accordance with theresults of Schultz[15].Itshouldbeborneinmindthattheincreasedueto roughnessofdifferentmarinecoatingsarestillofimportancewhen consideringthefuelconsumptionofaship.
4.4.2. Residuaryandwaveresistance
Residuaryresistancecoefficient,CR,valuesofthefull-scaleKCS model weredirectly predictedby thepresent CFDsimulations.
[image:11.646.55.536.57.314.2] [image:11.646.107.477.487.725.2]Fig.14.CWvaluesofthefullscaleKCSfordifferentsurfaceconditionsatshipspeedsof19(Re=2.29×10⁹)and24knots(Re=2.89×10⁹).
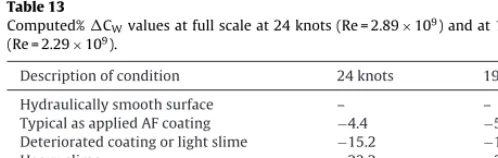
Table13
Computed%CWvaluesatfullscaleat24knots(Re=2.89×10⁹)andat19knots
(Re=2.29×10⁹).
Descriptionofcondition 24knots 19knots
Hydraulicallysmoothsurface – –
TypicalasappliedAFcoating −4.4 −5
Deterioratedcoatingorlightslime −15.2 −17.9
Heavyslime −23.2 −30.1
Smallcalcareousfoulingorweed −32.2 −43.8
Mediumcalcareousfouling −43 −57.9
Heavycalcareousfouling −55.8 −72.3
Fig.13showsthecomputedresiduaryresistancecoefficientsofthe KCShullobtainedfor7differentsurfaceconditionsatshipspeeds of19knots(Re=2.29×10⁹)and24knots(Re=2.89×10⁹).
Surprisingly, theresiduaryresistancecoefficients showedan increasingtrendwithincreasingfoulingratesat19knotswhereas ittendedtodecreasewithincreasingfoulingratesat24knots.This isduetothefactthatresiduaryresistancecomprisesviscous pres-sureresistanceandwaveresistanceasshownbyEq.(14).These differenttrendscanbeattributedtothefactthatthecontribution oftheviscouspressureresistancebecomesmoreimportantthan waveresistanceatlowerspeeds.Inotherwords,athigherspeeds, thewave-makingresistancebecomesdominantduetowave gen-eration.
Sinceviscouspressureresistanceisafunctionoffrictional resis-tance,itisappropriatetodecomposetheresiduaryresistanceand investigatetheeffectofhullroughnessonthewaveresistance,RW,
usingEq.(15)andtakingtheformfactor 1+k=1.1[37].Fig.14 showsthecalculatedwaveresistancecoefficients,CW,oftheKCS hullobtainedfor7differentsurfaceconditionsatshipspeedsof19 knots(Re=2.29×10⁹)and24knots(Re=2.89×10⁹).
AscanbeseenfromFig.14,thewaveresistancecontinuously decreased withincreasing fouling rates. Table 13 and Fig. 15 demonstratethechangeinthewaveresistanceoftheKCSdueto differentsurfaceconditionswithrespecttothesmoothcondition atadesignspeedof24knotsandataslowsteamingspeedof19 knots,respectively.
TheresultspresentedinTable13andFig.15indicatethatthe reductionintheCWoftheKCSduetoatypical,asappliedAFcoating
werepredictedtobe4.4%and5%whereasthoseduetoa deterio-ratedcoatingorlightslimewerecomputedtobe15.2%and17.9% atshipspeedsof24knotsand19knots,respectively.Itwasshown thattheeffectofheavyslimeontheKCShullcausedareductionin theCWof23.2%at24knotsand30.1%at19knots.Thecalcareous
foulingwoulddecreaseCWbyupto55.8%at24knotsand72.3%
at19knots.Aninterestingpointtonoteisthattheeffectofa par-ticularfoulingconditiononthewaveresistanceoftheKCSismore dominantatlowerspeeds.Thiscanbeattributedtothefactthat thecontributionoftheviscouseffectsbecomesmoreimportantat lowerspeeds.
Fig.16comparestheglobalwavepatternsaroundthehull sur-faceoftheKCSinsmoothandheavycalcareousfoulingconditions at24knots,whileFig.17showsthewaveprofilealongalinewith constanty=0.1509.
It isseenfromthecomparisonin Figs.16 and17 thatwave amplitudesappeartobereducedbyroughnesseffects.Thisisan indicationoftheeffectofviscosityonthewavesystems.The result-ingfreesurfaceelevationaroundtheKCShullwasrecordedtorange from −1.406mto3.357mfor smooth condition,and −1.345m to 2.266 for heavy calcareous fouling condition (Fig. 16). This reductionofthewavesystemisinagreementwiththecomputed reductioninwaveresistancecoefficientsshowninFigs.14and15 andTable13.
AscanbeseenfromFig.17thatthebowwaveprofilescomputed forthesmoothandheavycalcareousfoulingconditionsareontop ofeachotherwhereasthewaveprofilesdeviatefromeachotherin thewakeregion.Thisdrasticreductionofthesternwavesystem andtheobviousviscouseffectsonthewaveresistanceandwave systemsisconsistentwiththefindingsofRaven,VanderPloeg[56].
4.4.3. Totalresistanceandeffectivepower
Inordertorevealtheeffectofbiofoulingonthefuel consump-tion,theincreasein thetotalresistanceandhencetheeffective poweroftheKCSwerecalculated.Anincreaseinthetotal resis-tancewouldincreasetheeffectivepower,PE,ofaship,whichisthe necessarypowertomoveashipthroughwater.PEisrelatedtothe totalresistance,RT,andshipspeed,V,whichisdefinedbyEq.(19).
[image:12.646.123.487.56.294.2] [image:12.646.43.292.355.434.2]Fig.15.EstimationofthepercentagechangeinthewaveresistanceoftheKCSduetodifferentsurfaceconditionsat24knots(Re=2.89×10⁹).
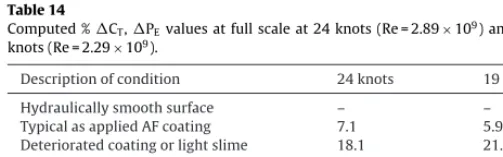
Table14
Computed%CT,PEvaluesatfullscaleat24knots(Re=2.89×10⁹)andat19
knots(Re=2.29×10⁹).
Descriptionofcondition 24knots 19knots
Hydraulicallysmoothsurface – –
TypicalasappliedAFcoating 7.1 5.9
Deterioratedcoatingorlightslime 18.1 21.2
Heavyslime 30.8 37.0
Smallcalcareousfoulingorweed 49.1 59.5
Mediumcalcareousfouling 72.6 88.2
Heavycalcareousfouling 107.5 130.9
where
RT= 1 2SCTV
2 (20)
whereisthedensityofwater,Sisthewettedsurfacearea,CTis thetotalresistancecoefficient.
Wecanthenre-writeEq.(19)as
PE=1 2SCTV
3 (21)
TheincreaseinPEduetotheeffectoffoulingcanbeexpressed by
%PE=
CT,rough−CT,smooth
CT,smooth ×
100 (22)
similartothatusedbyTezdoganetal.[49].
Totaldragcoefficientvaluesofthefull-scaleKCSmodelwere directlypredictedbythepresentCFDsimulations.Fig.18shows thepredictedtotalresistancecoefficientsoftheKCShullobtained for 7 different surface conditions at ship speeds of 19 knots (Re=2.29×10⁹)and24knots(Re=2.89×10⁹).
AscanbeseenfromFig.18,theeffectivepowercontinuously increasedwithincreasingfoulingrates.Table14andFig.19 demon-stratetheincreaseinthetotalresistanceandhenceintheeffective poweroftheKCSduetodifferentsurfaceconditionswithrespect
tothesmoothconditionatadesignspeedof24knotsandataslow steamingspeedof19knots,respectively.
TheresultspresentedinTable14andFig.19indicatethatthe increaseintheCT andPE oftheKCSduetoatypical,asapplied
antifouling(AF)coatingwerepredictedtobe7.1%and5.9%whereas thoseduetoadeterioratedcoatingorlightslimemayincreaseto 18.1%and21.2%atshipspeedsof24knotsand19knots, respec-tively.TheeffectofheavyslimeontheKCShullwascalculatedto causeanincreaseintheCTandPEof30.8%at24knotsand37%at
19knots.ThecalcareousfoulingwouldincreasePEbyupto107.5%
at24knotsand130.9%at19knots.
Aninterestingpointtonoteisthattheeffectofaparticular foul-ingconditionontheeffectivepoweroftheKCSismoredominantat lowerspeeds.Thiscanbeattributedtothefactthatthecontribution ofthefrictionalresistancebecomesmoreimportantthanresiduary resistanceatlowerspeeds.Inotherwords,athigherspeeds,the wave-makingresistancebecomesdominantduetowave genera-tion.Therefore,theeffectofagivenfoulingconditiononthetotal resistanceofashipisgreateratlowtomoderatespeedsthanat higherspeeds[6].
4.4.4. Velocityandturbulentkineticenergydistribution
Velocityandturbulentkineticenergycontoursinsmoothand heavycalcareousfoulingconditionsareshowninFig.20fortheKCS shiphullandinFig.21fortheflatplate.Fig.22demonstratescross sectionsofaxialvelocitycontoursatx/L=0.25,0.5,0.75,depicting theboundarylayeroftheKCShullinsmoothandheavycalcareous foulingconditions.
[image:13.646.53.535.57.315.2] [image:13.646.31.283.386.464.2]Fig.16.WavepatternaroundtheKCSforsmoothandheavycalcareousfoulingconditions(V=24knots).
[image:14.646.124.482.57.536.2] [image:14.646.96.519.578.712.2]Fig.18.CTvaluesofthefullscaleKCSfordifferentsurfaceconditionsatshipspeedsof19(Re=2.29×10⁹)and24knots(Re=2.89×10⁹).
fromFig.22,theexistenceofheavycalcareousfoulingontheKCS hullcausedincreasesintheboundarylayerthickness,␦,whichis definedasthedistancebetweenthewallandthepointwherethe axialvelocitymagnitudeoftheflowreachestheproportionof0.99 ofthefree-streamvelocity,i.e.U=0.99V,comparedtoanotherwise identicalfouling-freeKCS.Thepresentfindingsareconsistentwith theexperimentaldataofotherresearchers(e.g.SchultzandFlack [41],SchultzandFlack[59],Flacketal.[60],Flacketal.[61],Schultz [62]).
Itisinterestingtonotethatthevelocityandturbulentkinetic energycontoursshowninFigs.20and22areunexpectedlyshowing aspikeatthecentreplaneduetotheimplementationofsymmetry conditionsatthesymmetryplane(seeFig.6).
5. Discussionandconclusions
ACFDmodelforthepredictionoftheeffectofbiofouling on ship resistancehas been proposedand the effect of biofouling onshipresistancewasinvestigatedusingCFD.Anewroughness functionmodel,whichwasdevelopedbasedontheroughness func-tionvaluesofSchultzandFlack[41],wasproposedandemployed inthewall-functionofthesolverandaseriesofunsteadyRANS simulationswerecarriedouttopredicttheeffectofarangeof repre-sentativecoatingandbiofoulingconditionsontheresistancesofflat platesrepresentingtheKCSandthefull-scaleKCSmodelappended witharudder.Firstly,thetotalresistancecoefficientofthefull-scale KCSmodelwasobtainedatashipspeedof24knotsandcompared
[image:15.646.105.476.56.293.2] [image:15.646.54.534.482.728.2]Fig.20.a)Velocityandb)turbulentkineticenergycontoursatthemidshipoftheKCShullforsmoothandheavycalcareousfoulingconditions(V=24knots).
withthetotalresistancecoefficientextrapolatedusingthe exper-imentaldataofKimetal.[50]forvalidation.Itwasshownthat thetotalresistancecoefficientwasover-predictedby1.17%witha numericaluncertaintyof∼0.74%.Followingthis,systematic stud-ieswereperformedusingtheflatplatescoveredwithheavyslime andusingtheKCShullappendedwitharudderwithasmooth sur-facecondition,inordertocarryoutagridsensitivitystudyandto predicttheCFDuncertainties.
FullynonlinearunsteadyRANSsimulationstopredicttheeffect ofarangeofrepresentativecoatingandbiofoulingconditionson thefrictionalresistancesofaflatplate,representingtheKCS,and onthefrictional,residuary,waveandtotalresistanceandeffective poweroftheKCS,havebeencarriedoutattwospeeds, correspond-ingtoserviceandslowsteamingspeeds.
TheresultingCFvaluesobtainedusingflatplateCFD
simula-tionsandusing3Dfull-scaleCFDsimulationswerecomparedwith eachotherandwiththoseobtainedusingthesimilaritylaw proce-dureofGranville[9]toexaminetheapplicabilityoftheproposed CFDmodel,sincetheliteraturedoesnotofferanyfull-scale exper-imentalresults.ItwasshownthatthepresentCFDmodelcanbe usedforsimulatingroughnesseffectsonthefrictionalresistance offlatplatesandontheresistanceoffull-scale3Dshiphullsand thatdifferenttypesofroughnesscanbedefinedbymodifyingthe wall-functionofthesoftware.ThismeansthattheCFDmethodcan beusedtopredicttheeffectsofsuchroughnessontheresistance componentsofanyarbitrarybodywithoutbeingobligedtoconduct furtherexperiments, oncethe relationshipbetween the rough-nessfunctionsandroughnessReynoldsnumbersofeachsurface isknown.
Theincreaseintheeffectivepowerofthefull-scaleKCShull werepredictedtobe7.1%atashipspeedof24knotsand5.9%at ashipspeedof19knotsforatypicalasappliedantifouling(AF) coating,18.1% at24 knotsand21.2% at19 knotsfora deterio-ratedcoatingorlightslimeconditionand30.8%at24knotsand
37%at19knotsforaheavyslimecondition.Thesevaluesalteredto 49.1%,72.6%and107.5%at24knotsand59.5%,88.2%and130.9%at 19knotsforsmallcalcareousfoulingorweed,mediumcalcareous foulingandheavycalcareousfouling,respectively.
Animportantfindingofthestudyisthatthewaveresistanceand wavesystemsaresignificantlyaffectedbythehullroughnessand henceviscouseffects,whichiscontrarytothemajorassumption whichproposesthatthewaveresistanceisnotmarkedlyaffected bysurfaceroughnessandviscosity.Thereductioninthewave resis-tanceoftheKCShullinheavycalcareousfoulingconditionwas foundtobe55.8%at24knotsand72.3%at19knots.
Itshouldbeborneinmindthatthisstudy’saimwastopropose arobustCFDmodeltopredictthefoulingimpactonship resis-tance. For this reason,an appropriate representativeroughness function model wasemployed in spite of theslight discrepan-cies betweentheindividual roughness functionvalues and the model, especially inthetransitionally roughregime.Without a doubt,theseconditionsandtheroughnessfunctionsusedinthis papermaynotnecessarilyrepresentalltypesoffoulingconditions, sincetheassumptionsmadearebasedontheobservationsmadein [6,15].Futurepiecesofworkmaybetheinvestigationofthe rough-nessfunctionbehavioursofheterogeneousfoulingaccumulation, asseenonhulls,andaninvestigationintotherangeofapplicability oftheselectedroughnesslengthscaleforthepresentconditions.
Havingshowntheapplicabilityofthewall-functionapproach toaccountfortheroughnesseffectsofAFcoatingsandbiofouling onfull-scale3Dshiphulls,thisapproachcanbeusedtosimulate thiseffectonmorecomplexstructuressuchasonself-propelled shipswitharotatingpropeller.Anotherinterestingfutureplanis toinvestigatetheroughnesseffectsonthetotaldragandeffective powerofshipsofamorerealisticspatialdistributionoffoulingon shiphulls.
[image:16.646.65.542.56.333.2]Fig.22.CrosssectionscolouredwithaxialvelocitylimitedtoU=0.99Vdepicting theboundarylayer(V=24knots).
simulation.Thatistosay,therun-timeofCFDsimulationsofany arbitrarybodywithanysurfaceroughnesswouldbeliterally identi-caltothoseofCFDsimulationsofthesamebodywithanotherwise smoothsurfacecondition.
Themainadvantageoftheproposedapproachisthatitenables thepredictionoftheeffectofatypicalcoatinganddifferent bio-foulingconditionsontheresistanceofashipundertheeffectof arotatingpropellerorundertheeffectofadynamicfluid-body interaction,whichisnotpossibleusingthesimilaritylawscaling procedure.Therefore,thisapproachstandsasapracticalprediction methodforbothacademiaandindustry.
Acknowledgements
TheauthorsaregratefulfortheEPSRCsupportfortheprojecton ‘ShippinginChangingClimates’(EPSRCGrantNo.EP/K039253/1) whichenabledthemtocarryouttheresearchreportedinthispaper. Theauthorsgratefullyacknowledgethattheresearchpresented inthispaperwaspartiallygeneratedaspartoftheEUfundedFP7 projectFOUL-X-SPEL(EnvironmentallyFriendlyAntifouling Tech-nologytoOptimisetheEnergyEfficiencyofShips,Projectnumber 285552,FP7-SST-2011-RTD-1).
ItshouldbenotedthattheresultswereobtainedusingtheEPSRC fundedARCHIE-WeStHighPerformanceComputer (www.archie-west.ac.uk).EPSRCgrantno.EP/K000586/1.Theunderlyingdata in this paperis openly availablefromthe Universityof Strath-clyde data repository at: http://dx.doi.org/10.15129/adeb0db8-fec9-46ce-bbe3-9b828d0b9d35.
References
[1]IMO.Annex5,ResolutionMEPC.245(66),2014Guidelinesonthemethodof calculationoftheattainedEnergyEfficiencyDesignIndex(EEDI)fornew ships.http://www.imo.org/KnowledgeCentre/IndexofIMOResolutions/ MEPC%20Resolutions/MEPC%20245%2066.pdf,MarineEnvironment ProtectionCommittee,2014.
[2]IMO.Annex9,ResolutionMEPC.213(63),2012Guidelinesforthe developmentofaShipEnergyEfficiencyManagementPlan(SEEMP).http:// www.imo.org/KnowledgeCentre/IndexofIMOResolutions/Documents/ MEPC%20-%20Marine%20Environment%20Protection/213(63).pdf,Marine EnvironmentProtectionCommittee,2012.
[3]IMO.MEPC59/4/15,Preventionofairpollutionfromships,EnergyEfficiency OperationalIndicator(EEOI)http://www.rina.org.uk/hres/mepc%2059416. pdf,MarineEnvironmentProtectionCommittee,2009.
[4]IMO.SecondIMOGHGStudy.2009. [5]RAEng.FutureShipPoweringOptions.2013.
[6]M.P.Schultz,Effectsofcoatingroughnessandbiofoulingonshipresistance andpowering,Biofouling23(2007)331–341.
[7]T.Tezdogan,Y.K.Demirel,Anoverviewofmarinecorrosionprotectionwitha focusoncathodicprotectionandcoatings,Brodogradnja65(2014)49–59. [8]ITTC.SpecialistCommitteeonSurfaceTreatment–Finalreportand
recommendationstothe26thITTC.Proceedingsof26thITTC–VolumeII http://ittcinfo/media/5532/11pdf2011.
[9]P.S.Granville,Thefrictionalresistanceandturbulentboundarylayerofrough surfaces,J.ShipRes.2(1958)52–74.
[10]P.S.Granville,Similarity-lawcharacterizationmethodsforarbitrary hydrodynamicroughnesses,in:FinalReportNavalShipResearchand DevelopmentCenter,ShipPerformanceDept.,Bethesda,MD,1978,pp.1. [11]G.Loeb,D.Laster,T.Gracik,Theinfluenceofmicrobialfoulingfilmson
hydrodynamicdragofrotatingdiscs,in:J.D.Costlow,R.Tipper(Eds.),Marine Biodeterioration:AnInterdisciplinaryStudy,NavalInstitutePress,Annapolis, MD,1984,pp.88–94.
[12]E.G.Haslbeck,G.Bohlander,Microbialbiofilmeffectsondrag-labandfield,in: ShipProductionSymposiumProceedings,SNAME1992,1992.
[13]M.P.Schultz,TheEffectofBiofilmsonTurbulentBoundaryLayerStructure, FloridaInstituteofTechnology,1998.
[14]M.P.Schultz,Therelationshipbetweenfrictionalresistanceandroughnessfor surfacessmoothedbysanding,J.FluidsEng.124(2002)492–499.
[15]M.P.Schultz,Frictionalresistanceofantifoulingcoatingsystems,J.FluidsEng. 126(2004)1039–1047.
[16]T.A.Shapiro,Theeffectofsurfaceroughnessonhydrodynamicdragand turbulence.USNATridentScholarProjectReportNo.3272004. [17]K.A.Flack,M.P.Schultz,Reviewofhydraulicroughnessscalesinthefully
roughregime,J.FluidsEng.132(2010)041203.
[18]M.P.Schultz,J.A.Bendick,E.R.Holm,W.M.Hertel,Economicimpactof biofoulingonanavalsurfaceship,Biofouling27(2011)87–98. [19]J.M.Walker,M.P.Schultz,K.A.Flack,C.N.Steppe,Skin-frictiondrag
measurementsonshiphullcoatingsystems,30thSymposiumonNaval Hydrodynamics(2015)1–10.
[20]C.Grigson,Thedragatshipscaleofplaneshavinganyqualityofroughness,J. ShipRes.29(1985)94–104.
[21]G.H.Christoph,R.H.Pletcher,Predictionofrough-wallskinfrictionandheat transfer,AIAAJ.21(1983)509–515.
[22]D.Lakehal,Computationofturbulentshearflowsoverrough-walledcircular cylinders,J.WindEng.Ind.Aerodyn.80(1999)47–68.
[23]G.Gre´ıgoire,M.Favre-Marinet,F.J.S.Amand,Modelingofturbulentfluidflow overaroughwallwithorwithoutsuction,J.FluidsEng.125(2003)636–642. [24]V.C.Patel,Perspective:flowathighreynoldsnumberandoverrough
surfaces—AchillesheelofCFD,J.FluidsEng.120(1998)434–444.
[25]K.Suga,T.J.Craft,H.Iacovides,Ananalyticalwall-functionforturbulentflows andheattransferoverroughwalls,Int.J.HeatFluidFlow27(2006)852–866. [26]D.Apsley,CFDcalculationofturbulentflowwitharbitrarywallroughness,
FlowTurbul.Combust.78(2007)153–175.
[27]P.-A.Krogstad,ModificationofthevanDriestdampingfunctiontoincludethe effectsofsurfaceroughness,AIAAJ.29(1991)888–894.
[28]B.Aupoix,Ageneralstrategytoextendturbulencemodelstoroughsurfaces: applicationtoSmith’sk-Lmodel,J.FluidsEng.129(2007)1245–1254. [29]L.Ec¸a,M.Hoekstra,Numericalaspectsofincludingwallroughnesseffectsin
theSSTk–(eddy-viscosityturbulencemodel,Comput.Fluids40(2011) 299–314.
[30]J.C.Date,S.R.Turnock,AStudyintotheTechniquesNeededtoAccurately PredictSkinFrictionUsingRANSSolverswithValidationAgainstFroude’s HistoricalFlatPlateExperimentalData,UniversityofSouthampton, Southampton,UK,1999,62pp.
[31]M.Leer-Andersen,L.Larsson,Anexperimental/numericalapproachfor evaluatingskinfrictiononfull-scaleshipswithsurfaceroughness,J.Mar.Sci. Technol.8(2003)26–36.
[32]P.Izaguirre-Alza,L.Pérez-Rojas,J.F.Nú ˜nez-Basá ˜nez,Dragreductionthrough specialpaintscoatedonthehull,in:InternationalConferenceonShipDrag ReductionSMOOTH-SHIPS,Istanbul,Turkey,2010.
[33]Y.S.Khor,Q.Xiao,CFDsimulationsoftheeffectsoffoulingandantifouling, OceanEng.38(2011)1065–1079.
[34]T.Cebeci,P.Bradshaw,MomentumTransferinBoundaryLayers,Hemisphere PublishingCorporation,McGraw-Hill,1977.
[35]J.Nikuradse,Lawsofflowinroughpipes:NACATechnicalMemorandum 1292,1933.
[36]ITTC,PracticalGuidelinesforShipCFDApplication.ITTCRecommended ProceduresandGuidelines,Procedure75-03-02-03,Revision012011. [37]A.M.Castro,P.M.Carrica,F.Stern,Fullscaleself-propulsioncomputations
usingdiscretizedpropellerfortheKRISOcontainershipKCS,Comput.Fluids 51(2011)35–47.
[38]ITTC.ReportofthePoweringPerformanceCommittee.Proceedingsofthe 19thITTC. http://ittc.info/media/2304/report-of-the-power-performance-committee.pdf1990.
[39]Y.K.Demirel,M.Khorasanchi,O.Turan,A.Incecik,M.P.Schultz,ACFDmodel forthefrictionalresistancepredictionofantifoulingcoatings,OceanEng.89 (2014)21–31.
[40]M.Haase,K.Zurcher,G.Davidson,J.R.Binns,G.Thomas,N.Bose,Novel CFD-basedfull-scaleresistancepredictionforlargemedium-speed catamarans,OceanEng.111(2016)198–208.
[41]M.P.Schultz,K.Flack,Therough-wallturbulentboundarylayerfromthe hydraulicallysmoothtothefullyroughregime,J.FluidMech.580(2007) 381–405.
[42]J.Jiménez,Turbulentflowsoverroughwalls,Ann.Rev.FluidMechan.36 (2004)173–196.
[43]M.A.Shockling,J.J.Allen,A.J.Smits,Roughnesseffectsinturbulentpipeflow,J. FluidMech.564(2006)267–285.
[image:18.646.54.287.57.194.2][45]L.Hundley,TateC.Hull-foulingstudiesandshippoweringtrialresultson sevenFF1052classships.DWTaylorNavalShipResearchandDevelopment CenterReport#DTNSRDC-80/027111p.1980.
[46]L.Larsson,F.Stern,V.Bertram,Benchmarkingofcomputationalfluid dynamicsforshipflows:theGothenburg2000workshop,J.ShipRes.47 (2003)63–81.
[47]Z-r.Zhang,VerificationandvalidationforRANSsimulationofKCScontainer shipwithout/withpropeller,J.Hydrodyn.(Ser.B)(2010)932–939. [48]P.M.Carrica,H.Fu,F.Stern,Computationsofself-propulsionfreetosinkand
trimandofmotionsinheadwavesoftheKRISOContainerShip(KCS)model, Appl.OceanRes.33(2011)309–320.
[49]T.Tezdogan,Y.K.Demirel,P.Kellett,M.Khorasanchi,A.Incecik,O.Turan, Full-scaleunsteadyRANSCFDsimulationsofshipbehaviourandperformance inheadseasduetoslowsteaming,OceanEng.97(2015)186–206.
[50]W.J.Kim,S.H.Van,D.H.Kim,Measurementofflowsaroundmodern commercialshipmodels,Exp.Fluids31(2001)567–578. [51]CD-ADAPCO.UserGuideSTAR-CCM+,Version9.02.011.2014.
[52]L.F.Richardson,Theapproximatearithmeticalsolutionbyfinitedifferencesof physicalproblemsinvolvingdifferentialequations,withanapplicationtothe stressesinamasonrydam,Trans.R.Soc.Lond.210(1910)307–357. [53]L.F.Richardson,J.A.Gaunt,Thedeferredapproachtothelimit,Philos.Trans.R.
Soc.Lond.226(1927)299–361.
[54]I.B.Celik,U.Ghia,P.J.Roache,C.J.Freitas,H.Coleman,P.E.Raad,Procedurefor estimationandreportingofuncertaintyduetodiscretizationinCFD applications,J.FluidsEng.Trans.ASME130(2008),078001-1-4.
[55]P.M.Carrica,A.M.Castro,F.Stern,Self-propulsioncomputationsusingaspeed controllerandadiscretizedpropellerwithdynamicoversetgrids,J.Mar.Sci. Technol.15(2010)316–330.
[56]H.C.Raven,A.VanderPloeg,A.R.Starke,L.Ec¸a,TowardsaCFD-based predictionofshipperformance—progressinpredictingfull-scaleresistance andscaleeffects,in:ProceedingsofRINAMarineCFDConference,London,UK, 2008.
[57]M.P.Schultz,G.W.Swain,Theinfluenceofbiofilmsonskinfrictiondrag, Biofouling15(2000)129–139.
[58]Y.K.Demirel,ModellingtheRoughnessEffectsofMarineCoatingsand BiofoulingonShipFrictionalResistance,UniversityofStrathclyde,2015(PhD Thesis).
[59]M.P.Schultz,K.A.Flack,Outerlayersimilarityinfullyroughturbulent boundarylayers,Exp.Fluids38(2005)328–340.
[60]K.A.Flack,M.P.Schultz,T.A.Shapiro,ExperimentalsupportforTownsend’s Reynoldsnumbersimilarityhypothesisonroughwalls,Phys.Fluids17(2005) (1994-present).
[61]K.A.Flack,M.P.Schultz,ConnellyJS:Examinationofacriticalroughness heightforouterlayersimilarity,Phys.Fluids19(2007)095104.