City, University of London Institutional Repository
Citation
: Pinchbeck, E. ORCID: 0000-0002-5638-3923 (2018). Convenient Primary Care
and Emergency Hospital Utilization (19/04). London, UK: City, University of London.This is the published version of the paper.
This version of the publication may differ from the final published
version.
Permanent repository link:
http://openaccess.city.ac.uk/21514/Link to published version
: 19/04
Copyright and reuse:
City Research Online aims to make research
outputs of City, University of London available to a wider audience.
Copyright and Moral Rights remain with the author(s) and/or copyright
holders. URLs from City Research Online may be freely distributed and
linked to.
Department of Economics
Convenient Primary Care and Emergency Hospital Utilization
Edward W. Pinchbeck1
Department of Economics, City, University of London
and
Centre for Economic Performance, London School of Economics and Political Science
Department of Economics Discussion Paper Series
No. 19/04
Convenient Primary Care and Emergency Hospital
Utilization
Edward W. Pinchbeck
∗February 1, 2019
Participation and utilization decisions lie at the heart of many public policy
questions. I contribute new evidence by using hospital records to examine
how access to primary care services affects utilization of hospital Emergency
Departments in England. Using a natural experiment in the roll out of
ser-vices, I first show that access to primary care reduces Emergency
Depart-ments visits. Additional strategies then allow me to separate descriptively
four aspects of primary care access: proximity, opening hours, need to make
an appointment, and eligibility. Convenience–oriented services divert three
times as many patients from emergency visits, largely because patients can
attend without appointments.
JEL codes: I11, I12, I18, D12
Keywords: primary care, emergency care, access, utilization decisions
∗City, University of London and Centre for Economic Performance. Address: City, University of
For some services discrepancies between social and individual benefits warrant
govern-ment action on efficiency grounds. In other cases, society may intercede to ensure
individ-uals can access some hitherto unattainable level of service. Interventions to improve the
accessibility of services conceivably come in many guises, for instance improving
afford-ability or widening eligibility; providing more, closer, or better services; shorter waiting
times; or more convenient opening hours (e.g. Millman et al.,1993;Hiscock et al.,2008).
The ways in which interventions are designed and structured may have consequences
for utilization, service costs, and the attainment of policy objectives, particularly given
mounting evidence that psychological factors can lead seemingly minor service features
to play a part in utilization and participation decisions (e.g. Duflo et al.,2006; Bertrand
et al., 2006; Baicker et al., 2015).
This paper investigates how dimensions of access to primary care affect the demand for
unplanned use of hospital Emergency Departments (EDs). I draw on Equitable Access
to Primary Medical Care (EAPMC), a policy reform in the English National Health
Service (NHS) designed to make primary care more convenient across the country, and to
address geographical imbalances in access. UnderEAPMC, around 250 new primary care
services were deployed between 2008 and 2012. More than half were “walk–in clinics”:
practices with evening and weekend opening hours, and offering walk–in services with
no need to register or make an appointment. The remainder, targeted to administrative
districts with the lowest concentration of primary care physicians, were “extended hours
practices”: regular services requiring registration but open at least 5 hours per week more
than conventional practices. The comprehensive nature of the English NHS (where all
patients have access to free primary care), allows me to abstract from insurance issues, and
to focus on physical proximity and other less well–understood, but potentially important,
convenience dimensions of access.
To contrive a quasi–experimental research design from the EAPMC policy reform I use
hospital records to capture the evolution of hospital utilization in small neighborhoods,
then generate a measure of primary care access as a non-parametric function of distance to
EAPMC services.1 Restricting regression samples to places receiving new facilities under
1More concretely access intensity is computed by counts of open services in a series of distance buffers
the policy, specifications estimate an average treatment effect on the treated (ATT) from
changes in hospital outcomes when an EAPMC service opens or closes, with a control
group composed of areas suitable for similar services but not experiencing access changes
at that particular time. Using timing differences for identification is underpinned by
evidence that: (i)service roll-out is unrelated to pre-reform primary care access measures;
and (ii) trends in ED visits are broadly parallel across cohorts. This aligns with policy
documents that indicate service deployment timetables were driven by administrative
factors that are plausibly unrelated to the determinants of hospital utilization.
This research design is leveraged to generate three sets of findings. The first documents
policy relevant estimates of the impact of walk–in clinics on neighborhood wide ED
utiliza-tion. Conditional on fixed neighborhood factors, labor–market trends, and demographic
changes, proximity to these convenience–oriented services results in strongly significant
reductions in unplanned ED visits. Reductions in ED visits are in the order of 1.5 – 4%;
implying that each facility reduces annual ED throughput by approximately 1,000 – 2,000
visits. The robustness of these estimates is bolstered by auxiliary analyses, robustness
and falsification tests.
A second set of results exploits data richness to show that diversion from EDs is subject to
a strong, near–linear, decay with distance to a walk–in clinic. Further findings indicate
that diversion from EDs is largely driven by patients whose visit does not result in a
hospital admission, and by patients that were neither referred to the ED nor conveyed
there in an ambulance. This points towards a conclusion that the effects of walk–in clinics
mainly arise from influencing care utilization decisions of agents with less urgent health
problems, and with more discretion over the location of their treatment.
The third and final part of the analysis unpicks further channels though which primary
care access determines ED utilization. Here I rely on a descriptive approach that compares
walk–in clinics and extended hours practices in under-doctored administrative districts
which received both types of service under EAPMC. When estimated simultaneously,
walk–ins divert three times as many patients from EDs. Although both types of service
have meaningful effects on ED visits outside of standard practice hours, the greater bite
of walk–in services predominantly occurs during these standard hours. To the extent that
or pre-booking strongly influences where agents seek treatment.
This paper provides new evidence on the extent to which convenient primary care reduces
visits to hospital EDs, and by using a national policy reform and the universe of hospital
visits, I build on a small literature that obtains plausibly causal estimates in narrower
empirical settings (e.g. Dolton and Pathania, 2016). Shifting care from EDs to primary
care is likely to represent a social benefit because some 15 to 40% of ED visits are for health
problems that could be safely treated in less costly settings outside hospitals (Mehrotra
et al.,2009;Weinick et al.,2010;Lippi Bruni et al.,2016). Moreover, strong recent growth
in ED use in many OECD countries (Berchet,2015) has found many hospitals operating
above capacity and resulted in well–documented congestion in EDs, such that reducing
pressure at EDs has become an increasing priority (Rust et al.,2008;Pines et al.,2011).2
Findings indicate thatEAPMC walk–in clinics significantly reduced ED activity in areas
of England with and without primary care shortages. The ATT estimates are directly
relevant to any ex post evaluation of the EAPMC policy, and may generalize to other
settings in which policy-makers are seeking to reconfigure existing services or expand
primary care in suitable locations. Coefficients imply that 5– 20% of walk–in clinic visits
substituted for a trip to an ED. Despite the lower costs of primary relative to ED care,
by itself this implies a net increase in health care spending, but says nothing about
patient benefits or diversion from regular primary care services. A full welfare analysis
would need to take account of these factors. However, NHS primary care physicians are
paid a capitation fee for each registered patient so this analysis is a relevant metric in
understanding the effects of the policy on the NHS budget.
This paper’s second more general contribution is to adopt a multi-dimensional view of
health care access, and to demonstrate that several dimensions simultaneously drive
health care utilization patterns. Related research has typically focused on individual
components of access in isolation — for example affordability (Selby et al.,1996); service
opening hours (Dolton and Pathania,2016;Whittaker et al.,2016); or physical proximity
(Van Dort and Moos,1976;Currie and Reagan,2003;Buchmueller et al.,2006). The
re-sults documented here suggest that a wider view is warranted, and could help to resolve
puzzles and anomalies in care utilization patterns. For example, as Chen et al. (2011)
2Between 1995 and 2010 visits to US EDs increased by 34% (National Center for Health Statistics,
acknowledge, the availability of primary care physicians may be behind heterogeneity in
how reforms that alter affordability lead to changes in ED utilization and substitution
across care settings.3
Finally, the paper is related to a growing literature that allows for behavioral factors
in models of individual participation and utilization decisions (e.g. Mullainathan et al.,
2012). Baicker et al. (2015) document numerous examples where psychological factors
plausibly result in underutilization or overutilization of health care. In this paper, I
make a start in applying these insights to agents’ choice of treatment setting. Proximity
and the ability to attend without appointment are important factors in determining the
extent to which primary care diverts agents from EDs, which chimes with evidence from
other settings that inconvenience and hassle can be powerful barriers to participation (e.g
Bertrand et al., 2006;Kahn and Luce,2006).
1
Background
1.1
Institutional Context
Patients desiring unplanned care from the NHS in England and Wales have traditionally
had two main options: visit a hospital Accident and Emergency (A&E) Department, a
Consultant-led 24 hour services with full resuscitation facilities catering for all kinds of
emergency (equivalent to Emergency Departments, or EDs); or consult with a family
physician – know locally as a General Practitioner (GP) – at a primary care practice. It
is widely acknowledged that providing care in EDs is considerably more costly than in
settings outside hospitals such as physicians’ offices (e.g Mehrotra et al., 2009). This is
also true in the NHS context: for example, recent figures indicate that a visit to A&E
costs £124 while a GP practice consultation costs £32.
Despite universal coverage and no demand-side cost sharing, patients using NHS
emer-gency care incur time and travel expenses. In addition, EDs and primary care are subject
to access frictions. In this regard EDs are arguably more convenient than conventional
3Such heterogeneity is evident in recent research: Miller(2012) find that expansion of health insurance
under the 2006 Massachusetts reform led to a 5–8% reduction in ED visits and imply substitution from
hospital visits to primary care, whereas work using later reforms in Oregon by Taubman et al.(2014)
primary care: patients can visit any ED whenever they wish, and due to closely
moni-tored performance targets, can normally expect to wait less than 2 hours for treatment.
Conversely, access to specific primary care services requires registration, and is usually
only available to patients living within a practice’s catchment boundary. Access is via
an appointment, an emergency appointment, or – where available – by using a primary
care Out of Hours service on evenings and weekends. Although almost all individuals
are registered at a primary care practice, they may have to wait a week or longer to
obtain a regular appointment with a family doctor; and, although often available, same
day emergency appointments can be difficult to book. Even then, appointments may not
be convenient.4
From the late-1990s, alternative ways to access unplanned care emerged in the shape
of new urgent care services designed for patients with minor medical problems. These
included a telephone advice service and facilities offering easy access to face-to-face advice
and treatment. NHS Walk-in Centres are one type of urgent care service that were
introduced in this period.5 These facilities provide routine and emergency primary care for
minor ailments and injuries with no requirement for patients to pre–book an appointment
or to register (Monitor, 2014). Most are located away from hospitals although some are
co-located with hospital EDs, so that on arrival patients are directed (triaged) to the
appropriate service. In total approximately 230 Walk-in Centres have opened in England
since 2000. Some 150 (or 65%) of this total number were commissioned following a
report in 2007 that led to the creation of the Equitable Access to Primary Medical Care
(EAPMC) policy reform.
EAPMC was set-up with the twin objectives of delivering more personalized and
re-sponsive primary care across England, and improving access in the most under-doctored
areas. To meet these objectives EAPMC comprised two discrete initiatives. The first
funded 100 new primary care practices in the 38 Primary Care Trusts (PCTs) with the
4For example, surveys indicate the average wait to get a GP appointment is around 13 days Pulse
(2016). Average waiting time for GP appointment increases 30% in a year, June 10. In the July 2017 GP Patient survey, 32% of patients did not find it easy to get through to their practice by phone; 29% were not able to see or speak to someone at the time they wanted; 31% who wanted a same day appointment could not get one; 24% say that their practice is not open at times that are convenient for them; and only two thirds of patients rate their overall experience of out-of-hours NHS services as good.
5Others include Urgent Care Centres and Minor Injury Units, both of which usually do not provide
lowest provision of family doctors.6 These practices were similar to conventional primary
care services already available, but had to meet certain core criteria such as having at
least 6,000 patients and being accredited training practices. They were also required
to facilitate access opportunities through extended opening hours, with a minimum of 5
hours per week beyond Monday to Friday 8.30am–6.30pm, and by setting large catchment
boundaries (Department of Health, 2007) (see Appendix A for the full list of criteria). I
refer to these services henceforth as “extended hours practices”. The second strand of
EAPMC compelled each of the 152 PCTs to establish a “GP-led Health Centre”, a new
service type designed to offer more convenient access to primary care. These facilities —
which I refer to throughout as “walk–in clinics” — had to offer both a regular registered
primary care service with bookable appointments, as well as a walk-in service for any
member of the public from 8am-8pm, 365 days a year. Core criteria required the centers
to be located in areas maximizing convenient access and opportunities to integrate with
other local services (Department of Health, 2007).
Figure 1 shows the spatial distribution of EAPMC walk–in clinics (LHS) and extended
hours practices (RHS). The policy brought walk–in services to a wide range of locations,
including some less urban areas in England while the extended hours practices were
mainly located in cities, particularly those in northern England. Figure 2 charts counts
of walk–in services (LHS) and primary care practices (RHS) between 2006 to the end
of 2012. During this period walk–in clinics more than doubled in number, peaking in
2010, before falling again. This variation is driven by openings and closings of EAPMC
services. The right–hand plot shows the EAPMC extended hours practices temporarily
reversed a secular downward trend in primary care practice numbers. The sharp rise
in practices between 2009 and 2011 was driven by EAPMC services, but the steep fall
in 2012 was not related to the EAPMC policy. This fall potentially poses a threat to
identification and is addressed in robustness checks in Section 3.6.
Figure2demonstrates thatEAPMC came on stream in a staggered fashion between late
2008 and the end of 2011. For example, the first walk–in clinic (the Hillside Bridge Centre
in Bradford) opened in December 2008; roughly a third of all EAPMC walk–in clinics
6Until 2013 Primary Care Trusts were legal entities responsible for purchasing and managing NHS
Figure 1: EAPMC walk-in clinics (LHS) and extended hours practices (RHS)
Notes: Black stars are facilities still open in September 2014; red plus symbols had closed by that date.
Figure 2: Walk-in clinics and primary care practices in England
0 100 200 300
Count
2006q3 2008q1 2009q3 2011q1 2012q3 (a) Walk in clinics
8000 8200 8400 8600
Count
2006q3 2008q1 2009q3 2011q1 2012q3 (b) Primary care practices
[image:10.595.87.525.495.698.2]had opened before May 2009, more than two thirds by the end of 2009, and all but two
before 2011. What drove this pattern of deployment? Guidance issued by the Department
of Health highlights that local administrators were under pressure to establish the new
services quickly, with an expectation that all procurements should be finished in financial
year 2008/9 (Department of Health,2007). Although some did meet this timetable, many
others did not, with sources suggesting that deployment timings were mainly driven by
local administrative factors, for example readiness on the part of administrators to specify
services and identify suitable premises, the speed of procurement processes, and the time
needed to prepare sites.
1.2
Primary care and ED utilization
In standard formulations, individuals seek care when the private costs of obtaining
treat-mentpare lower than the perceived private treatment benefitsb(σ), which are increasing
in illness severityσ. From a social perspective, treatment is warranted when private
ben-efits are higher than the social costs of treatmentc; such that when p < c there is moral
hazard and some over-treatment. When EDs and primary care are substitutes, patients
seek treatment in primary care when they perceive a net private benefit from primary
care (bP C−pP C >0); and when primary care offers a higher perceived net benefit than
an ED (bP C−pP C > bED −pED). A more general case allows for behavioral biases and
is set out in Appendix B.
Primary care access interventions reduce private costs of primary care, either through
lowering co-pays or, as in the English NHS, by reducing time costs and travel expenses.
Any such intervention can have an effect at the extensive margin by inducing marginal
agents to utilize primary care instead of not seeking any kind of care. Additionally,
through the second condition an intervention can divert patients from EDs to primary
care. The stylized facts presented in Section 1.1 suggest the following. First, EDs can
treat all patients, but those with illness severities above some point ¯b(σ)P C are not
treat-able in primary care. Second, ED care is availtreat-able at any time but primary care can only
be accessed during practice opening hours. Third, treatment costs in EDs are strictly
higher than primary care (cED < cP C). These stylized facts predict that following an
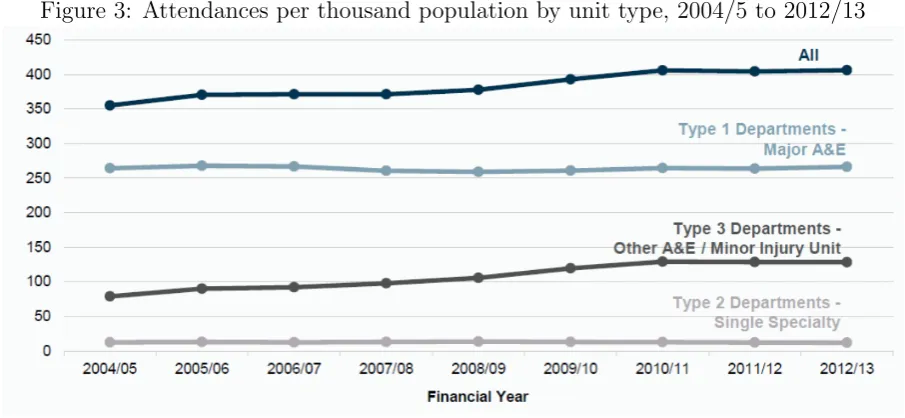
Figure 3: Attendances per thousand population by unit type, 2004/5 to 2012/13
Source: Health and Social Care Information Centre
expected to divert to primary care;(ii) diversion should take place primarily during
pri-mary care opening hours; and(iii) diversion of primary care treatable patients from EDs
to primary care represents a social gain.
Later analysis uses micro-data to estimate the extent to which EAPMC services divert
patients from EDs. This is warranted because the aggregate utilization data depicted
in Figure 3 is inconclusive. In the period when EAPMC services were being deployed
(2008/9–2010/11), visits to walk in clinics and other urgent care services for minor
prob-lems (denoted “Type 3 units”) rose steadily while ED visits (denoted “Type 1
Depart-ments”) remained flat. These trends could be consistent with effects purely at the
ex-tensive margin i.e. walk in clinics meeting previously unsatisfied demand.7 However, the
same outcome can also arise when walk–ins substitute for ED care. In the limit aggregate
demand for emergency care is perfectly inelastic, such that all else equal every clinic visit
is offset by one less visit to an ED. Under such conditions, the aggregate trends in Figure
3could reflect unrelated shifts in emergency care demand, for example from, say, an aging
population or increased patient expectations.
7Note that this setting is unlikely to induce supplier-induced demand (in the sense of doctors
2
Data and Empirical Approach
2.1
Data
Subsequent analysis rests on two separate quarterly panel data sets for 2009 to 2012
that combine measures of access to primary care services with data on hospital activity
throughout England. The panels are constructed for two different spatial scales. In the
main neighborhood level panel, the units of analysis are 32,844 Lower Super Output Areas
(LSOA). LSOAs are a census geographical unit that house 1,630 residents on average,
making them comparable to but somewhat smaller than US Census tracts. The second
is a provider level panel in which the units of analysis are 144 NHS Trusts that contain
at least one ED. Population demographic data for LSOAs from the Office for National
Statistics and primary care access measures are then appended to the activity data. The
latter are generated using reports issued by the hospital regulator and the Department
of Health by first compiling a list of EAPMC services, geocoding each site using the full
postcode, then adding facility opening and closing dates using information provided by
the Health and Social Care Information Centre (HSCIC). Shapefiles released by NHS
England identify patient registration boundaries for a sub–set of practices.
Hospital activity data is drawn from two main sources: the Quarterly Monitoring of
Accident and Emergency (QMAE) dataset published by NHS England, and Hospital
Episode Statistics (HES) records provided by HSCIC. QMAE was the official source of
information on ED activity in the period 2009 to 2012, and is generally considered to be
the most comprehensive and reliable source of aggregate information on emergency care
activity. It captures aggregate ED visit counts at the NHS Trust, rather than the site,
level. For most NHS Trusts this is inconsequential as there is only one ED, but some
NHS Trusts have multiple emergency care sites, in which case the split of attendances
across sites cannot be observed. To account for mergers, I group together earlier data for
NHS Trusts which will eventually merge in order to create a consistent panel.
For the neighborhood level analysis, three hospital utilization variables are derived from
two distinct HES data resources. Both contain anonymized patient records, and include
the patient’s residential location (LSOA) as well as details of care received. The first and
of visits to hospital EDs. Two further measures relate to admissions to hospital: (2)
the total number of admissions, and (3) the proportion of unplanned admissions that
could potentially have been avoided with appropriate primary care.8 The source for the
second and third variables is the HES Admitted Patient Care dataset while the first is
by necessity drawn from the (separate) HES A&E dataset. This distinction is important
because Admitted Patient Care data contain detailed diagnosis information but A&E
data do not. This omission precludes analysis of ED visits by the categories used in
Taubman et al.(2014) i.e. ”Non-urgent,” ”Urgent, primary-care treatable,” etc.
The HES A&E dataset is a rich source of data on ED activity but was published as
experimental statistics until 2012/13. The use of these data to compute ED visits is
challenging because in early iterations of the data collection health care service providers
were not strictly required to record the type of emergency unit that a patient attended
(for example an ED or another type of emergency care facility, such as an eye hospital
or Minor Injury Unit). Completing this field in the data then subsequently became
mandatory. As a result emergency unit type codes are missing for close to 30% of patient
records for NHS Trusts in 2009/10. The share of missing codes then falls to around 11%
in 2010/11, 3.5% in 2011/12, and 1.5% of records by 2012/13, a trend depicted in the
series of bars labeled 1 in Figure 4.
The implication of this is that changes in ED visits observed in the raw data between
2009 and later years will in part reflect better coding practices rather than genuine ED
activity changes. This is problematic as better coding coincides strongly with the
intro-duction of EAPMC services. I circumvent this problem in two steps, which are visually
illustrated in Figure 4. First, I exploit that the QMAE data described above indicates
that some hospital-quarter cells only contain ED attends whereas others contain only
non-ED attends. Cross-referencing to QMAE thus allows me to impute true type codes
for more than half of the the uncoded NHS Trust attendances in the HES A&E dataset
in my sample window. Nevertheless, as depicted in the second series of bars in Figure4,
a substantial number of missing codes remain.
8Avoidable admission are admissions for conditions that could potentially have been avoided with
appropriate primary care, for example by preventing the onset of disease preventable by vaccination, managing an acute illness such as dehydration, or a chronic condition such as diabetes. I follow earlier literature in defining these admissions using ICD-10 codes for a set of 19 presenting conditions – see
Figure 4: HES Data operations and remaining visits missing type code
0
5
10
15
20
Millions of emergency visits
2009/10 2010/11 2011/12 2012/13 Q1-3
1 2 3 4 1 2 3 4 1 2 3 4 1 2 3 4
Not Missing type code Missing type code
Second, after removing duplicate records and collapsing the data to quarter–neighborhood
cells, I then exclude any quarter–neighborhood cells that contain fewer than 50 ED
vis-its from the final estimation sample. As shown in the third (the resulting unbalanced
neighborhood panel) and fourth (the associated balanced neighborhood panel) series of
bars in Figure 4, this strategy is effective in eliminating missing codes problem because it
reduces the number of uncoded emergency care visits to inconsequential levels. However,
and while this strategy is unlikely to be a source of bias, it potentially raises
generaliz-ability concerns as results may be specific to places with high ED use. Later findings that
indicate a close correspondence between the neighborhood and NHS Trust level results,
as well as an alternative strategy detailed in full in section3.6, give reassurance that this
is not the case.
2.2
Empirical Approach
My data constitutes two quarterly panels of hospital utilization measures outcomes at the
NHS Trust and the LSOA administrative geography and a database ofEAPMC services
including opening and closing dates. The general estimation framework common across
both panels is:
yit =EAP M Citb0 β+x
0
itγ +f(i, t) +it (1)
where observation units indexed by subscript i ∈(LSOAs, NHS Trusts). The dependent
variable is a hospital utilization outcome in quarter t. EAPMC is a primary care access
intensity measure that capturesEAPMC services within distance buffer b from unit i at
timet. Time varying controls variables are contained in the vectorx, andf(i, t) are fixed
effects which allow for unobserved time and place variation.
The majority of estimates that follow are generated from neighborhood-level (i=LSOA)
regressions that take the form:
yit=EAP M Citb0 β+x
0
itγ +φi+φtm(i)+φT(t)b+it; (2)
Here x captures time varying counts of population in five age bands (aged less than 10,
aged 10-19, aged 20-49, aged 50-69, aged 70+) and their squared values to control flexibly
variation, specifications include LSOA fixed effects (φi), quarter indicators interacted
with labor–market area (indexed by m) dummies (φtm), and separate year (indexed by
T) indicators for all neighborhoods that obtain exposure to services in distance buffer
b at any time in the panel (φT(t)b). These fixed effects are intended to eliminate factors
that could bias results, including any time invariant neighborhood characteristics such
as access to a walk–in clinic that existed prior to the EAPMC policy, as well as general
labor–market wide changes, for example in the supply of hospital or community care.
Ancillary specifications at the hospital level (i =NHS Trust) are useful as they require
no sample restrictions to deal with data coding issues. Regressions take the form:
yit=EAP M Citb0 β+φi +φtg(i)+φT(t)b+it; (3)
Besides the different unit of observation, in contrast to equation2these regressions omit
demographics given there is no simple way to assign population to NHS Trusts, and
account for area trends at the level of 9 regions (London, South East, South West, West
Midlands, North West, North East, Yorkshire and the Humber, East Midlands, and East
of England, indexed by g), reflecting that in many cases a labor–market area contains
only a single ED.
In both panels, the principal object of interest is EAMPC, a vector that captures time–
varying primary care access intensity as a non-parametric function of proximity to
ser-vices. These measures are generated from counts of the number of open walk-in clinics
(or extended hours practices) within concentric distance buffers surrounding the centroid
of each neighborhood or NHS Trust. As shown in Appendix FigureA2, the median travel
distance to access emergency care in England differs considerably over space, so I allow
distance buffers to vary according to the distribution of observed distances in the data.
In practice, this means buffers are computed for each of the 149 labor–markets in my
data then assigned to all neighborhoods/NHS Trusts with centroids falling in that area.9
9The Office for National Statistics calculates labor–market areas, known locally as Travel to Work
Areas (TTWAs), using commuting data. They each contain one or more cities and they nest LSOAs. The labor–market distance buffers are computed using distances traveled to attend EDs in the HES data between 2008/9 to 2012/13. I approximate patient starting location as registered primary care practice and ED visit location as the closest ED (relevant if an NHS Trust has more than one ED). Using patient trips to EDs is driven by practical considerations (walk-in clinic attendances are not well recorded in HES) but also has the benefit of ameliorating concerns about the endogeneity of resulting buffers.
Buffers are constructed in a discrete way such that each service falls into only one buffer
for each neighborhood or NHS Trust. In most cases effects in three distance buffers are
estimated: the lower quartile distance traveled (p25), the median (p50), and the upper
quartile (p75). Around 15 of the walk–in clinics in my data are co–located at hospital
EDs. To allow for different effects for these services I create a separate treatment for
all such services within the median travel distance i.e. within the first two buffers. This
yields four buffers in total, and the following estimated equation for walk–in clinics:
yit = β1 W iCitp25 +β2 W iCitp50+β3 W iCitp75+β4 W iCitED +x
0
itγ +f(i, t) +it (4)
2.3
Endogenous Primary Care Availability
When identification rests on policy-induced variation a key methodological challenge is
endogenous policy targeting. Here, primary care access is determined by a series of
deci-sions by health administrators, for example where and when to open a new facility. This
decision-making process is a black-box, and the suspicion must be that local service
avail-ability is correlated with unobserved underlying drivers of hospital outcomes. It might be
reasonable to assume thatEAPMC services were targeted to places experiencing
increas-ing ED attendances, or to places expected to experience future ED attendance growth. If
true, any estimate of associations between primary care access and ED attendances that
ignore policy targeting would be biased towards finding that better access to primary
care leads to more ED visits i.e. results would be underestimated.
To mitigate these issues all specifications use difference-in-difference strategies on samples
composed solely of neighborhoods or NHS Trusts that already have close access to an
EAPMC primary care service, did so in the past, or will do so in the future. With
this sample restriction in place I estimate an average treatment effect on the treated
(ATT) based on localized changes in hospital outcomes in places close to centers when
the availability of services changes, against a control group provided by other places that
have (or had, or will have) a similar facility close by, but where the availability of services
does not change at that particular time. This strategy is particularly helpful because
EAPMC prescribed criteria for facility location and service specification (see Appendix
A), suggesting services should be similar on observable and unobservable dimensions.
3
Results
Table 1provides descriptive statistics for hospital utilization and control variables. The
“NHS Trust sample” refers to the 118 NHS Trusts that were exposed to walk–in clinics
under the EAPMC policy. The “Walk–in clinic sample” refers to the sample of
neigh-borhoods that were exposed to walk–in clinics under the EAPMC policy. The “Under–
doctored sample” refers to neighborhoods in areas of the country eligible to receive new
extended hours practices under EAPMC. The latter two samples overlap as EAPMC
introduced new walk–in clinics in all areas of the country.
Table 1 refers to information underpinning regression samples, with that neighborhood
level descriptives excluding duplicated or incomplete records in the underlying patient–
level data, including around 2% of records missing patient’s residential neighborhood,
and after dropping LSOA–quarter cells with low counts of ED visits. The mean number
of LSOA ED visits per quarter is 140 (national average 95), which implies around 35
an-nual visits to the ED per 100 residents. As expected, neighborhoods exposed toEAPMC
services have different characteristics to the average neighborhood. For example, in 2010
neighborhoods in the main sample were more deprived (mean Index of Multiple
depriva-tion score of 30 against nadepriva-tional average 22) and had lower average house prices (£170,000
vs. national average £196,000).
By consequence of the research design all neighborhoods in the LSOA regression samples
were exposed to at least one type of new EAPMC service. To illustrate how access to
walk–in clinics varies by neighborhood, I create a variable capturing “maximum exposure”
to walk–in clinics – i.e. the highest number of ED and other walk–in clinics that each
neighborhood becomes exposed to at any point in the period April 2009 to September
2012, and cross-tabulate results in Appendix Figure A3. Neighborhoods in the main
sample were exposed to between 0 and 9 non–ED walk–in clinics and either 0 or 1 ED–
based clinics. However, the vast majority of neighborhoods gained access to only one
Table 1: Descriptive statistics
NHS Trust Walk–in Under–doctored
sample sample sample
mean sd mean sd mean sd
Emergency Department utilization
Emergency Department (ED) visits 24,692 10,573 140 47 141 45
ED visits - walk-in open times 97 32 98 30
ED visits - walk-in closed times 43 18 43 17
ED visits - regular primary care times 60 21 61 20
Other hospital utilization
Hospital admissions 110 37
Potentially avoidable admissions (%) 23 8.6
Neighborhood demographic controls
Population aged under 10 222 78 222 80
Population aged 10-19 210 79 215 77
Population aged 20-49 763 235 717 204
Population aged 50-69 326 91 330 80
Population aged 70+ 160 73 163 67
whereas some 80% were exposed to no more than two.
3.1
Walk-in Clinics and Hospital Utilization
Table 2 reports the effect of walk-in clinics on ED utilization in regressions
correspond-ing to equations 2 and 3. The first column is the baseline specification that uses the
unbalanced panel of LSOAs that comprise the main estimation sample. To allow for
arbitrary spatial correlation standard errors are clustered on 7,201 Middle Super Output
Areas (MSOAs nest LSOAs and each house between 5,000 and 15,000 inhabitants). The
uppermost parameter estimate indicates that neighborhoods in close proximity to
walk-in clwalk-inics co-located at EDs experience reductions walk-in ED attendances of approximately
3.5%. For other walk-in facilities coefficients are smaller and decay with distance — the
strongest impacts are evident in the closest neighborhoods, roughly halve in the next
buffer, and are insignificant and close to zero in locations that gain a clinic beyond the
median distance traveled to attend an ED. The baseline estimates are robust to
restrict-ing attention to a balanced panel of LSOAs (column 2), and estimatrestrict-ing equation 3 with
NHS Trust data (column 3) yields highly similar, albeit more imprecisely estimated,
co-efficients. These results serve to demonstrate that the sample restriction noted in section
Tables A2 and A3 further support the robustness of the baseline estimates.10
The remaining columns in Table 2 report further effects of walk-in clinics in the LSOA
panel using the specification described in equation 2. The fourth and fifth columns split
ED attendances into visits during walk-in opening times — Monday to Sunday 8am
to 8pm — and at other times. Coefficients imply the overall effects estimated in the
first column are almost wholly driven by the former.11 These results are a meaningful
cross-check on internal validity because they rule out omitted factors which commonly
drive ED use during and outside of clinic opening times. For example, a significant role
for confounders such as socio-economic changes in the composition of neighborhoods or
changes in the local supply of 24 hour hospital care is improbable because these would
likely show up in ED visits outside of walk–in opening times.
The last two specifications in Table 2 present regressions on outcomes referring to the
volume and mix of admitted patients. Coefficients in the fourth column indicate small and
insignificant impacts of access to walk–in clinics on the log count of hospital admissions.
Similarly, the last column signals no evidence of effects on the proportion of admissions
that may have been prevented with appropriate primary care.12
10Appendix TableA2demonstrates robustness to using a binary 1/0 WiC exposure variables instead of
the count–based treatment intensity variables, specifying the dependent variable in levels, and removing the population and buffer control variables. This Table also shows that effects on ED visits for children and elderly people are slightly smaller than the baseline effects, and that impacts are significantly larger
in the most deprived neighborhoods. Appendix Table A3 finds that standard errors are larger when
clustering at the MSOA level than standard errors that follow Conley (1999) to allow for continuous
forms of spatial autocorrelation up to a distance cut-off of 2km. Allowing for spatial autocorrelation is computationally demanding so here I specify the dependent variable as log ED visits per 1000 residents and drop population controls. Coefficients are robust to this specification change.
11For example, applying the first coefficient (-0.0376) to the sample mean ED visits (140) implies 5.2
fewer ED visits whereas the corresponding calculation for the second column implies 4.8 fewer visits.
12Earlier versions of this work used mean ED waiting times as another outcome. However, identification
3.2
Substitution and Health Care Spending
Previous results indicate that walk–in services reduce visits to EDs but do not indicate
the degree to which they substitute for ED activity. The mean number of ED visits for
neighborhood-quarter cells in my main sample is 140 (Table 1), and the average walk–in
clinic in my data has slightly under 50 neighborhoods in the first distance buffer, 50 more
in the (thinner) second buffer, and a further 100 in the third. The point estimates in
column one of Table 2 thus imply that an average ED walk–in clinic reduces annual ED
visits by 2106 (=0.0376*140*100*4) whereas the average walk–in clinic located elsewhere
reduces visits by 1145 (=0.0265*140*50*4 + 0.0144*140*50*4). Based on auxiliary
in-formation I assume each walk–in clinic is visited 18,000 times annually, suggesting that
around 12% of patients visiting an ED walk–in clinic and around 6% of those visiting a
clinic elsewhere were diverted from an ED.13 The (unreported) 95% confidence intervals
indicate that between 5 to 20% of patients attending ED based walk–in clinics and 5 to
10% of patients attending other clinics were diverted from an ED.
These rough calculations imply the lion’s share of walk–in visits do not substitute for a
visit to an ED. Clearly this is an incomplete analysis of the full possible effects of walk–in
services, because the clinics may also substitute for care in regular primary care practices.
Such an analysis lies beyond the scope of this paper. Nevertheless, it is possible to make
some assessment of the resource implications of the clinics because regular primary care
services are funded through capitated budgets in the NHS setting. Available figures
indicate that the average unit cost of a visit to an ED is three times the cost of a visit to
a walk–in clinic.14 Based on these direct costs, diversion rates of under 20% imply that
walk–in services in the NHS lead to a net increase in health care spending.
3.3
Balancing Tests and Trends
Difference–in-difference applications assume that trends in treatment and control groups
are parallel absent treatment. The research design outlined in Section 2.3 means that
13This should be considered to be an indicative estimate. Monitor(2014) reports that 70% of clinics
surveyed in 2014 provide between 20,000 and 45,000 walk-in appointments per year but that attendances anticipated in commissioning contracts were typically in the range of 12,000 to 24,000 attendances. I use the mid–point of the latter range for these calculations because it provides a better match to the sample window underpinning the analysis.
14Based on the cost of an ED visit in England of£100 and a cost of a walk–in clinic visit of £36 as
places that hostEAPMC services act as both a treatment and control group, with
identi-fication coming off the timing of service deployment. The identifying assumption is that
service deployment time should be unrelated to the determinants of ED visits, conditional
on general labor-market trends. If in fact new services are deployed to places at times
when ED visits are rising or falling more quickly than the general trend, then the control
group of past and future locations for services will not provide a valid counterfactual.
The discussion in Section1.1suggests the actual timetable for the new centers was driven
by administrative factors (e.g. availability of suitable premises and speed of procurements
etc.) which are plausibly unrelated to ED visits. To test this premise, pre–reform primary
care access variables (measured in both levels and changes) are regressed on the number
of quarters between the policy announcement and the neighborhood’s first exposure to a
service, as well as the time–invariant analogues of the control variables listed above. As
data for pre–reform access is not available at the neighborhood level, values are assigned to
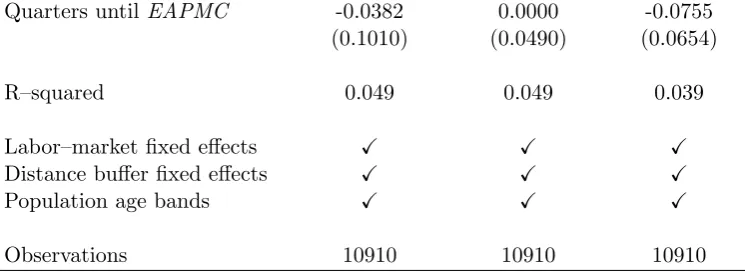
neighborhoods from the nearest primary care practice. The upper panel of Table3shows
no significant correlation between EAPMC treatment timing and pre–reform primary
care access as measured by the percentage of patients able to obtain an appointment, the
percentage satisfied with phone access, and satisfied with practice opening hours in June
2008. The bottom panel of the Table similarly yields no correlation with local trends
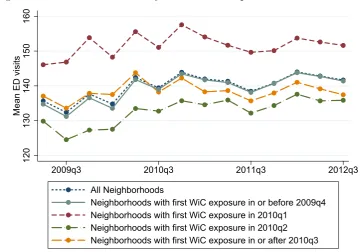
in primary care access between June 2007 and June 2008. A second strategy visually
assesses the extent to which groups of neighborhoods that were first exposed to new
services at different times follow similar trends in ED visits. Reassuringly Figure5, which
is displayed in actual time rather than event time due to the seasonal pattern, reveals
the unconditional trends in ED visits are broadly similar across all groups throughout
the sample period.
3.4
Distance Decay
Section3.1reported spatial patterns in the impacts of walk-in clinics on ED attendances.
Distance decay is more precisely teased out in Table4which drops neighborhoods close to
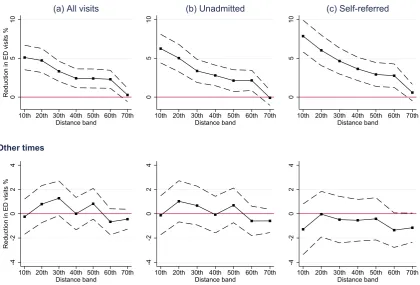
walk-in facilities at EDs and expands the number of distance buffers to seven. Column (a)
of Figure6summarizes the first two columns of this Table: solid black lines connect point
Table 3: Balancing on pre-policy primary care access measures
(1) (2) (3)
get appointment satisfied hrs satisfied phone
% % %
Panel A: Dependent variable is level in June 2008
Quarters untilEAPMC -0.0338 0.0651 0.0997
(0.1994) (0.0893) (0.1532)
R–squared 0.120 0.274 0.124
Panel B: Dependent variable is change June 2007 to June 2008
Quarters untilEAPMC -0.0382 0.0000 -0.0755
(0.1010) (0.0490) (0.0654)
R–squared 0.049 0.049 0.039
Labor–market fixed effects X X X
Distance buffer fixed effects X X X
Population age bands X X X
Observations 10910 10910 10910
Notes: Table reports cross-sectional regressions on neighborhoods that first gain access to a walk–in clinic between April 2009 and September 2012. Dependent variables are drawn from GP Patient Survey, either levels in June 2008 (Panel A) or changes between June 2007 and June 2008 (Panel B), with values assigned to neighborhoods from nearest primary care practice. Outcome variables are: percentage of patients able to book an appointment 2 days ahead; percentage of patients satisfied with primary care practice opening hours; percentage of patients satisfied with phone access. Explanatory variable is number of quarters between April 2008 and neighborhood first access to anEAPMC walk–in service. Standard errors in parentheses clustered at the MSOA level.
interpreted as an approximate percentage reduction in ED visits) and dashed black lines
bound the 95% confidence intervals. The upper plot confirms the strong distance decay
during center opening hours: neighborhoods in the closest proximity experience falls in
ED visits of 5.1%, declining to above 2% between the 40th and 60th percentile, and are
zero at the 70th distance percentile. The lower plot charts much weaker changes in visits
outside of clinic opening hours. There are signs of small (albeit generally insignificant)
effects of around 1% for close locations, but for less proximate places coefficients are close
to zero.15
15In the Appendix I further exploit information about the distance to the nearest ED to test whether
Figure 5: Trends in ED visits by time of first exposure to walk–in clinics
120
130
140
150
160
Mean ED visits
2009q3 2010q3 2011q3 2012q3
All Neighborhoods
Neighborhoods with first WiC exposure in or before 2009q4 Neighborhoods with first WiC exposure in 2010q1
Neighborhoods with first WiC exposure in 2010q2 Neighborhoods with first WiC exposure in or after 2010q3
Notes: Figure assesses whether neighborhoods are on parallel trends by plotting quarterly ED visits for neighborhoods (LSOAs) grouped by date of first exposure to an EAPMC walk–in clinic.
The conceptual framework in Section 1.2 suggests walk in clinics should divert patients
with less serious medical problems from EDs. Most patients that are not admitted during
an ED attendance likely fall into this category. These outpatient visits make up around
three quarters of all ED visits in this setting. Column (b) of Figure 6 plots the effect of
walk-in access on these patients, corresponding to the third and fourth columns of Table
4. The pattern of effects is highly similar to the first column. During walk in hours effects
in the first buffers are slightly larger and the distance decay is a little steeper, although
these differences are not statistically distinguishable. The corollary is that around three
quarters of the overall effect of walk in services arises through diverting patients who
would not be admitted through an ED, with the remainder of the effect coming through
patients who would be admitted.
Hospital records also indicate how patients came to be at the ED. Column (c) of Figure6,
corresponding to columns five and six of Table 4, tracks impacts on patients recorded as
self-referring to the ED. This group represents around 60% all visits to EDs. The
remain-FigureA4shows that results are highly similar but that effects are slightly larger at very short and very
Figure 6: Distance decay by ED visit type
0
5
10
Reduction in ED visits %
10th 20th 30th 40th 50th 60th 70th Distance band
(a) All visits
0
5
10
10th 20th 30th 40th 50th 60th 70th Distance band
(b) Unadmitted
0
5
10
10th 20th 30th 40th 50th 60th 70th Distance band
(c) Self-referred
8am - 8pm
-4
-2
0
2
4
Reduction in ED visits %
10th 20th 30th 40th 50th 60th 70th Distance band
-4
-2
0
2
4
10th 20th 30th 40th 50th 60th 70th Distance band
-4
-2
0
2
4
10th 20th 30th 40th 50th 60th 70th Distance band
Other times
Table 4: Distance decay by ED visit type
(1) (2) (3) (4) (5) (6)
- All ED visits - - Non–admitted - Self–referred
-WiC hrs Other WiC hrs Other WiC hrs Other
p0-p10 WiCs -0.0510 0.0024 -0.0625 0.0013 -0.0785 0.0128
(0.0081) (0.0074) (0.0094) (0.0082) (0.0104) (0.0106)
p10-p20 WiCs -0.0472 -0.0080 -0.0502 -0.0103 -0.0602 0.0004
(0.0079) (0.0078) (0.0090) (0.0086) (0.0100) (0.0096)
p20-p30 WiCs -0.0332 -0.0128 -0.0336 -0.0068 -0.0464 0.0048
(0.0066) (0.0072) (0.0076) (0.0081) (0.0085) (0.0097)
p30-p40 WiCs -0.0242 -0.0001 -0.0279 0.0007 -0.0363 0.0054
(0.0062) (0.0068) (0.0067) (0.0077) (0.0076) (0.0088)
p40-p50 WiCs -0.0240 -0.0082 -0.0212 -0.0069 -0.0291 0.0042
(0.0062) (0.0065) (0.0071) (0.0073) (0.0078) (0.0089)
p50-p60 WiCs -0.0230 0.0066 -0.0215 0.0059 -0.0275 0.0135
(0.0059) (0.0055) (0.0067) (0.0062) (0.0077) (0.0072)
p60-p70 WiCs -0.0028 0.0045 0.0009 0.0059 -0.0058 0.0115
(0.0044) (0.0042) (0.0050) (0.0049) (0.0054) (0.0061)
Quarter-labor market FX X X X X X X
Year-distance buffer FX X X X X X X
Population controls X X X X X X
Observations 109399 109399 109399 109399 109399 109399
R–squared 0.812 0.792 0.789 0.777 0.751 0.680
Notes: Sample contains quarter-LSOA cells with 50 or more ED visits but drops neighborhood exposed to walk-in facilities co-located at EDs. Dependent variables are in logs. WiC hrs are between 8am-8pm Monday through Sunday. Standard errors in parentheses clustered at the MSOA level
der are patients that ostensibly had less discretion in the location of their treatment. This
is because they were referred to the ED from another source (most commonly a family
doctor), or conveyed to the ED in an ambulance. As with the non–admitted group of
patients the effects are qualitatively similar to the overall patterns shown in column (a),
but here coefficients during clinic open times are roughly one to one and a half times
as large. One possible explanation is that self-referred patients have less severe health
needs which can be treated in lower acuity facilities like walk-ins more readily. This finds
support in the data: only 12% of the self–referred group are admitted following their
3.5
Dimensions of Access
What further dimensions of access drive diversion from EDs? This section aims to shed
light on this question through a descriptive comparison of the impacts of walk–in services
and extended hours practices (denoted PCPs in this section) opened under the EAPMC
policy. As noted previously, PCPs are conventional primary care services that require
patients to be registered to receive services. They offer extended opening relative to core
primary care hours but operating hours fall short of the 7 day services at walk–in clinics.
Making comparisons across these service–types can help to ascertain how opening hours
and the need to make an appointment condition the extent to which patients are diverted
from EDs.
The PCPs opened under theEAPMC policy were located in areas of the country with the
lowest concentration of family doctors. To ensure a like–for–like comparison samples
un-derpinning all regressions in this section are restricted to neighborhoods in administrative
areas eligible for both types of EAPMC service. Regressions, reported in Table 5, first
estimate the impacts of walk–in services and extended hours practices separately, then
simultaneously in the third and fourth columns. Because of the narrower geographical
sample these regressions differ in two ways to earlier specifications. First, they include
region rather than labor–market trends here as there is insufficient variation to separately
identify the latter from changes in primary care access driven by the policy reform.
Sec-ond, because there are very few walk–in facilities co-located at EDs in this sample, all
neighborhoods in close proximity to such services are dropped throughout this section.
Before comparing service types I first use this sample to assess the robustness of prior
results for walk–in services. The first column of Table 2estimated the impact of walk–in
clinics across the country as a whole. In Table5walk–in impacts are estimated in under–
doctored areas of the country on their own (in column 1), and conditional on changes
in regular primary care access (in column 3). The coefficients on the walk–in service
variables across these three specifications are remarkably similar, giving reassurance that
the omission of variables capturing access to regular primary care in earlier regressions is
unlikely to be a major source of bias.
The third and fourth columns of Table 5 estimate the effect of both types of primary
Table 5: Dimensions of primary care access
(1) (2) (3) (4)
—— ED visits at any time —— Core hrs
p0-p25 WiCs -0.0248 -0.0255 -0.0415
(0.0066) (0.0066) (0.0081)
p25-p50 WiCs -0.0142 -0.0131 -0.0214
(0.0047) (0.0047) (0.0060)
p50-p75 WiCs 0.0007 0.0010 -0.0000
(0.0031) (0.0030) (0.0040)
p0-p25 PCPs -0.0112 -0.0128 -0.0143
(0.0046) (0.0046) (0.0060)
p25-p50 PCPs -0.0003 0.0004 -0.0006
(0.0038) (0.0038) (0.0044)
p50-p75 PCPs -0.0055 -0.0037 -0.0014
(0.0028) (0.0028) (0.0035)
Quarter–region FX X X X X
Year–distance buffer FX X X X X
Population controls X X X X
Observations 63864 63864 63864 63864
R–squared 0.868 0.868 0.868 0.769
Notes: Sample contains quarter-LSOA cells with 50 or more ED visits. Dependent variables are in logs. Columns 1-3 include ED visits taking place at any time, Core hrs in column 4 counts ED visits between 8.30am– 6.30pm Monday through Friday. Standard errors in parentheses clustered at the MSOA level
ED visits taking place at any time (including evenings and weekends), which facilitates
a comparison of the overall effects of the two service–types in my data. Relative to
the extended hours practices, walk–in services divert more patients and have effects over
greater distances. Because the first two buffers contain a similar number of neighborhoods
so a comparison can be obtained by summing the coefficients across the first two buffers.
This implies that walk–in clinics divert roughly three times as many patients from EDs
as the extended hours practices. Annual diversion can be estimated by applying the
coefficients to the mean number of ED and grossing up by the number of neighborhoods
(as in Section3.2). Walk–in clinics divert 1081 patients per year from EDs whereas PCPs
The final column of Table 5 compares effects on ED visits in core primary care hours:
8.30am and 6.30pm on Monday–Friday. During these hours, both types of service are
open so any differences in diversion cannot be driven by variation in opening hours of
services. The mean number of ED visits taking place during these times is 60 (see Table
1), so that results imply that walk–in clinics divert roughly 755 ED trips whereas PCPs
divert 172, or 583 fewer visits. Both service types thus appear to divert a significant
proportion of patients outside core primary care opening hours, but some 80% of the
difference in the overall effects arise when both types of service are open. If EAPMC
walk–in clinics and extended hours practices are similar on unobserved dimensions, these
findings signal that the ability for patients to attend without registering or making an
appointment may have a large bearing on the ED diversion.
Appendix Table A4 finally reports the impacts of access to primary care services inside
and outside practice catchment boundaries during core primary care practice hours. In
theory a patient living outside a practice’s boundary cannot register for regular primary
care services but can attend a walk–in clinics (where these exist) as a non–registered
patient. In line with this prior, extended hours practices have zero impacts in
neighbor-hoods outside catchment boundaries. For walk–in clinics ED diversion occurs inside and
outside boundaries but is systematically larger in neighborhoods falling inside boundaries.
Although I provide no direct tests, I speculate these patterns could reflect benefits from
continuity of care or competition from walk–in clinics driving improvements in practices
outside my sample.16
3.6
Further Robustness Checks and Placebos
In all preceding estimations fixed effects partial out time-invariant unobservables at the
neighborhood level and region- or labor market–wide trends, while population counts
control for demographic changes. Besides these controls, previous sections reported some
natural robustness checks, for example by examining the impacts of services during service
open or closed hours and inside or outside practice catchment boundaries. A number of
further placebo and robustness checks that lend further support to these results. In all
cases I report graphical evidence, relegating associated regression outputs to Appendix
16The difference in overall effects between the service types could also be driven by differences in
Figure 7: Sample restriction robustness
−5
0
5
10
15
10th 20th 30th 40th 50th 60th 70th Distance band
(a) No drops
−5
0
5
10
15
10th 20th 30th 40th 50th 60th 70th Distance band
(b) Drop <10
−5
0
5
10
15
10th 20th 30th 40th 50th 60th 70th Distance band
(c) Main sample
Notes: All plots generated from regressions of log(self-referred ED visits) - log(other ED visits) on walk-in access changes. Left-most plot uses the full sample; middle plot drops neighborhood-quarter cells with less than 10 visits in each group; right-most plot as main sample.
Tables A6 and A7.
A first robustness check evaluates the sample restriction under which neighborhood
quar-ter cells with few ED visits were dropped. This restriction was adopted to avoid
con-flating changes in data reporting practices with genuine changes in ED volumes and to
circumvent problems inherent in using count data. To test this strategy I re-estimate
walk-in impacts under different samples but now using the difference between the
loga-rithm of self-referred ED visits and the logaloga-rithm of ambulance or referred ED visits as
the dependent variable. Changes in reporting should affect both of these patient groups
symmetrically. The three plots in Figure 7 demonstrate that distance decay of walk-in
clinics on this measure are qualitatively similar when no cells are dropped (left–most
plot), when cells with less than 10 ED visits are dropped (middle plot), and with the full
sample restriction (right–most plot). Given earlier findings these estimates are driven
largely by the self–referred patient group so it is reassuring that the patterns in all plots
are broadly consistent with those in Figure6. More generally, differencing between these
types of attendances partials out any unobserved time varying neighborhood factors that
affect both groups so provides a powerful check on earlier results.
the first regression in Table 2 but excluding observations in quarters in 2012. This has
two implications. First, it means estimation excludes the material drop in practices in
2012 evident in Figure2. These access changes are not driven by theEAPMC policy and
are unobserved in my regressions so could bias earlier results. Second, excluding 2012
essentially eliminates closures of EAPMC clinics, so this also serves as a test of relying
only on openings for identification. The left–hand plot in Figure 8 (corresponding to
the first column of TableA7) shows that this restriction leaves my findings unchanged.17
The second check is a falsification test that exploits that some neighborhoods outside
my main sample host walk-in clinics established prior to 1 Apr 2008 (and as such do not
figure in my earlier estimations). I generate pseudo changes in primary care access in
these places during my sample frame by assigning the older clinics opening and closing
dates matching a random EAPMC walk-in clinic from my main sample. The right–side
of Figure 8 shows these bogus access changes have no effects on ED visits.
The walk-in clinic regressions in section 3.1 control for shocks to labor markets through
the inclusion of labor market–by–quarter interactions whereas regressions in section 3.5
control only for less granular regional trends. The coefficients for walk-in services are
similar across these specifications yet it remains possible that the latter estimates are
partially driven by common shocks within labor markets. Figure 9 follows the approach
inBusso et al.(2013) by estimating the effect of primary care access on the neighborhoods
(log) rank position on ED visits within the labor–market distribution, where rank 1 is
assigned to the neighborhood with the lowest count of ED visits in the labor–market that
quarter. The estimated pattern of effects is qualitatively similar to those in Table5albeit
stronger for walk-in services relative to the extended hours primary care practices.
A final robustness check reflects the possibility that theEAPMC policy may be part of a
wider set of interventions targeted to specific neighborhoods such as localized employment
schemes or neighborhood regeneration. It is possible, albeit unlikely, that a combination
of such policies have spatially decaying effects that are strongest at times when primary
care facilities are open. Given that they are unobserved in my data such policies could
17A number of other unreported specifications provide further support. For example findings are
unchanged if I restrict attention to quarters from 2010/11 onwards, or restrict attention to places with similar median distance buffers, or retain a balanced panel of neighborhoods. Data availability and uncertainty over precise clinic opening dates precludes an in depth leads and lags analysis. However, a
Figure 8: Further walk-in clinic robustness
4.3
2.7
1.5
0.3
0
1
2
3
4
Reduction in ED attendances %
ED 25 50 75
Distance band
0.2
−0.2
0.3
0
1
2
3
4
25 50 75
Distance band
Point estimate for distance band
Notes: Figure shows robustness checks on results in Table 2. LHS plot refers to the same regression in column 1 of Table2but excluding all quarters in 2012. RHS plot refers to placebo check using bogus changes in walk-in access in approximately 1,000 neighborhoods that fall outside my main sample.
Figure 9: Robustness to common labor market shocks
10.2
8.9
2.7
0
5
10
Reduction in rank %
25 50 75
Distance band
(a) Walk in clinic
3.5
-0.6
0.5
0
5
10
25 50 75
Distance band
(b) Extended hours practices
Point estimate for distance band
[image:34.595.128.469.479.727.2]Figure 10: Placebo: house prices
−0.2
0.0
−0.3
−1
0
1
2
3
Change in house prices %
25 50 75
Distance band (a) Walk in clinic
0.3
−0.4
0.1
−1
0
1
2
3
25 50 75
Distance band
(b) Extended hours practices
Point estimate for distance band
Notes: Dependant variable is log average house prices in the neighborhood, computed from the Land Registry Price Paid dataset.
confound estimates should they correlate with factors driving hospital utilization and
directly coincide with EAPMC service changes. Figure 10 indicates that changes in
access are uncorrelated with average house prices which goes some way to alleviating this
concern.18
4
Conclusion
This paper examines a policy reform that introduced a substantial change in primary care
access across England within a short time-frame. The reform is helpful because its
imple-mentation provides a source of plausibly exogenous variation, and of particular interest
because it created new primary care services which differ along several organizational
dimensions. The first part of the analysis finds that access to convenient primary care
services significantly reduces visits to hospital Emergency Departments, and documents
a range of further findings that support the robustness of this result.
Parameter estimates imply that somewhere between 5 and 20% of patient visits to a
18In the last Column of TableA7, I also show thatEAPMC services have no significant impact on ED