1
Original Research
Predictors of tuberculosis treatment success under the DOTS
program in Namibia
Dan Kibuule1, Roger K Verbeeck1, Ruswa Nunurai2, Farai Mavungha 2, Albertina Thomas2, Amutenya Amutenya2, Guna Gunther3, Ette Ene4, Brian Godman5,6,7,8, Timonthy Rennie1
1School of Pharmacy, Faculty of Health Sciences, University of Namibia, Windhoek, Namibia 2National Tuberculosis and Leprosy Programme, Ministry of Health and Social Services, Windhoek, Namibia
3Tuberculosis Clinic, Ministry of Health and Social Services, Intermediate Hospital: Katurua, Windhoek, Namibia
4Anoixis Corporation, Natick, MA, USA
5Department of Laboratory Medicine, Division of Clinical Pharmacology, Karolinska Institutet, Karolinska University Hospital Huddinge, Stockholm, Sweden
6Strathclyde Institute of Pharmacy and Biomedical Sciences, University of Strathclyde, Glasgow, UK
7Health Economics Centre, Liverpool University Management School, Liverpool, UK 8Department of Public Health Pharmacy and Management, School of Pharmacy, Sefako Makgatho Health Sciences University, Ga-Rankuwa, Pretoria, South Africa
Correspondence: Brian Godman
Strathclyde Institute of Pharmacy and Biomedical Sciences, University of Strathclyde, Glasgow G4 0RE, United Kingdom.
Email: [email protected]. Telephone: +44-141-548-3825. Fax: +44-141-552-2562
Or
Division of Clinical Pharmacology, Karolinska Institute, Karolinska University Hospital Huddinge, SE-141 86, Stockholm, Sweden.
2
Abstract
Objectives: Optimal treatment success rates are critical to end tuberculosis in Namibia. Despite the scale-up of high quality DOTS in Namibia, treatment success falls short of the global target of 90%. Consequently, the objective of this study was to ascertain the
predictors of treatment success rates under DOTS in Namibia to provide future direction. Methods: A nation-wide comparative analysis of predictors of treatment success was undertaken. Tuberculosis cases in the electronic tuberculosis register were retrospectively reviewed over a 10-year period, 2004-2016. The patient, programmatic, clinical and treatment predictors of treatment success were determined by multivariate logistic regression modeling using R software.
Results: 104,603 TB cases were registered at 300 DOTS sites in 37 districts. The 10-year period treatment success rate was 80%, and varied by region (77.2%-89.2%). The patient’s sex and age were not significant predictors of treatment success. The independent
predictors for treatment success as were: Region of DOTS implementation (p=0.001), type of DOT supporter (p<0.001), sputum conversion at 2 months (p=0.013), DOT regimen (p<0.001), cotrimoxazole prophylaxis (p=0.002) and HIV co-infection (p=0.001).
Conclusion: Targeted programmatic, clinical and treatment interventions are required to enhance DOTS treatment success in Namibia. These are now ongoing.
Keywords: DOTS program, TB, predictors, Effectiveness, Outcomes
(Accepted for Publication Expert Review of Respiratory Therapy – please keep Confidential)
1. Introduction
3
Global initiatives have expanded DOTS (i.e. Directly Observed Therapy Short-course strategy) services and markedly improved CDR and TSR in lower and middle income countries (LMICs) including Namibia11–15. Nevertheless, although TB incidence rates have been decreasing across countries, Namibia remains a high TB burdened country4. In
addition, despite the 100% scale-up of high quality and community-based Directly Observed Treatment (DOT), Namibia still falls short of the national and global targets for TSR of 95%13,16. Recent analysis suggests that TSR in Namibia have reached a maximum of less than 95% global bench mark, and improvements have been marginal in the past
decade11,15,17. TSR are even lower among the retreatment and smear negative cases13,18. Consequently, these sub-optimal treatment success rates are a major concern towards eliminating TB in Namibia. Moreover, stagnation in TSR in Namibia in the past decade (2004-2015) coincides with the rising burden of drug resistant tuberculosis (DR-TB)19. Evidence in Namibia and other LMICs suggests that current DOTS strategies are not comprehensive enough to “End TB” by 2035 2,11,20–24.
However, there are conflicting reports on the impact of the various risk-factors in different populations including pharmacokinetic variability , socio-demographics and baseline clinical characteristics25–27.To date, the magnitude and impact of these risk factors on treatment outcomes has not been systematically evaluated in Namibian and other LMICs where the burden of TB remains high9. In view of this, the objective of this study was to ascertain the predictors of treatment success rates under DOTS in Namibia to provide future direction
2. Methods
2.1 Study design and population
A retrospective comparative analysis was carried out to determine the predictors of DOT treatment success and cure/treatment completion rates among cohorts of TB cases initiated on first-line regimens. The study subjects were all new and retreatment cases registered in the national electronic TB register (ETR) of Namibia between the third quarter of 2004/Q3 and first quarter of 2016/Q1.
4
DOT supporters who directly observe TB treatment. They also include health facility nurses, work-place peers, and community based workers as well as guardians
(family/neighbor/relative) and any others preferred by the patient.
DOT regimens are initiated at a health facility and supported either by community and/or facility based providers. Data on patient and clinical covariates and treatment outcomes for each patient is recorded on TB treatment cards. The data on treatment outcomes is
subsequently aggregated into health facility, district and regional TB registers/ETR and reported every quarter. The National Tuberculosis and Leprosy Programme (NTLP) compiles the annual TB treatment outcomes from the regional quarterly reports.
2.2 Tuberculosis DOTS program in Namibia
In Namibia, TB is managed using the WHO DOTS at health facilities (FB-DOTS) and at the community level (CB-DOTS) implemented by NTLP. Namibia achieved a country-wide DOTS coverage at all public health facilities, that is 42 hospitals, 34 health centers and 244 clinics, by 1996. Nonetheless, in 2004 the country reported the highest case notification rate, lowest TSR for tuberculosis as well as the emergence of drug resistant TB (DR-TB).
Consequently in 2004, a CB-DOTS strategy was designed to improve TSR from 65% to 85% by 2009 and to 90% by 2015, among other TB indicators under the first and second medium term plans (MTP-I, 2004-2009; MTP-II, 2010-2015) for Tuberculosis and Leprosy. CB-DOTS was implemented in all districts in partnership with NTLP and community-based HIV/TB organizations (CBOs), paving the way for standardized regimens, which were Fixed-Dose Combination (FDC) drugs for first-line tuberculosis treatment, the revision of national
guidelines for case management of tuberculosis and the ETR to report treatment outcomes. The diagnosis of TB was by microscopy (i.e. positive sputum smear or culture) and/or clinical signs. The FDC regimens for drug susceptible TB (DST) for new adult, new pediatric and retreatment cases were 2RHZE/4RHE, 2RHZ/4RH and 1RHZE/2RHZE/5RHE respectively. A team of community-based persons comprising of CHW (community healthcare workers), i.e. CB-DOT supervisors and FB-DOT supervisors and DOT nurses, DOT field promoters, and CB-DOT supporters implemented the CB-DOTS programme at each health district unit. The DOT-supporters such as family/relatives or workplace peers or CHWs directly observe the administration of the TB-medication at community DOT points, households and
5
patient support, (iii) a system for effective supply and management of TB drugs as well as (iv) a monitoring and evaluation system for effective measurement.
2.3 Data and statistical analysis
The main outcome of the study is the treatment success, which refers to the proportion of TB cases registered under DOTS between 2004-2015 that successfully completed treatment, whether with bacteriological evidence of success (cured, i.e. smear negative at 5 months) or without (treatment completed)28,29. Treatment success for extra pulmonary tuberculosis (EPTB) in Namibia is mainly determined by treatment completion and/or negative
microscopy and biopsy results. An unsuccessful outcome in this study referred to TB cases recorded as loss-to-follow-up (LTFU), transferred out, failed treatment or died. Cases of DR-TB are hospitalized and managed according to the treatment guidelines for DR-DR-TB, which comprise at least five second line anti-tuberculosis medicines. These include
levofloxacin, PASA, ethionamide, kanamycin, pyrazinamide, clofazimine, and capreomycin for 12-18 months of treatment.
Patient level data on treatment outcomes and covariates including: patient demographics, clinical (i.e. disease and laboratory), programmatic (i.e. Facility type, DOTS support, MTP strategy), treatment regimen and treatment outcomes were abstracted from the national ETR by the principal research team.
Data were retrospectively abstracted over 10-year review period (2004/Q3 and 2016/Q1), which coincides with the scale-up to high quality CB-DOTS services in 2005 under the first and second medium term plans for TB and leprosy in Namibia. The bacteriological
assessment of sputum smears was undertaken at three time points, i.e. baseline, at
completion of the intensive TB treatment (i.e. at 2 or 3 months) and at the completion of TB treatment (i.e. at 6 – 8 months). The bacteriological assessment of smears was undertaken by the National Institute of Pathology (NIP), a WHO accredited laboratory that services all DOTS sites in Namibia. The bacteriological results from the NIP are subsequently validated by the facility, district and regional TB care teams. Data on treatment outcomes and
covariates were exported to RStudio software for statistical analysis. Cases of drug resistant tuberculosis and/or missing data on the treatment outcome and/or the covariates of interest, i.e. demographic, clinical and treatment and programmatic records, were excluded from analysis.
6
Chi-squared test (2). The independent predictors for treatment success were subsequently determined using adjusted odds ratios (aOR) using multivariate logistic regression to control for confounders for treatment outcomes. The predictors of treatment success are presented as odds ratio (aOR) with a 95% Confidence Interval and at a level of significance α=0.05.
2.4 Ethics
The study was approved by the Research and Ethics Committee of the University of Namibia and the Ministry of Health and Social Services (MoHSS). The approvals provided for waiver for a written informed consent from the individual TB cases whose records were included from the eTR data base. In order to maintain confidentiality, data were cleaned and coded to remove any patient specific identifiers such as names and hospital numbers prior to analysis.
3. Results
7
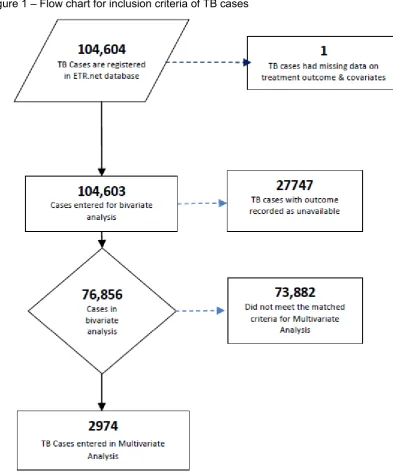
Figure 1 – Flow chart for inclusion criteria of TB cases
8
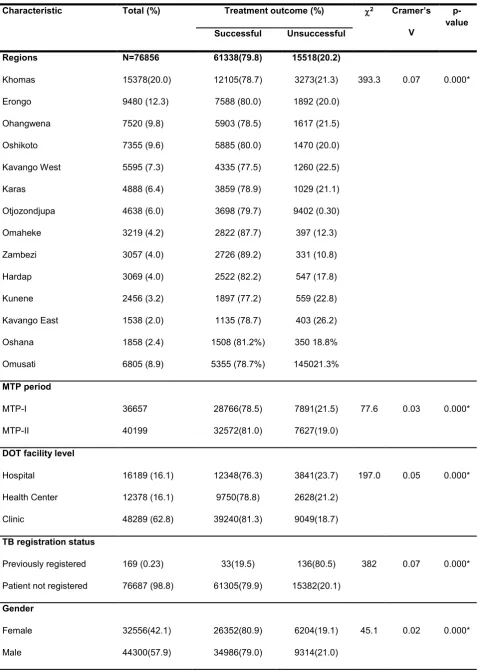
Table 1: Univariate analysis of covariates with treatment outcome (n=76,856)
Characteristic Total (%) Treatment outcome (%) 2
Cramer’s
V
p-value Successful Unsuccessful
Regions Khomas Erongo Ohangwena Oshikoto Kavango West Karas Otjozondjupa Omaheke Zambezi Hardap Kunene Kavango East Oshana Omusati N=76856 15378(20.0) 9480 (12.3) 7520 (9.8) 7355 (9.6) 5595 (7.3) 4888 (6.4) 4638 (6.0) 3219 (4.2) 3057 (4.0) 3069 (4.0) 2456 (3.2) 1538 (2.0) 1858 (2.4) 6805 (8.9) 61338(79.8) 12105(78.7) 7588 (80.0) 5903 (78.5) 5885 (80.0) 4335 (77.5) 3859 (78.9) 3698 (79.7) 2822 (87.7) 2726 (89.2) 2522 (82.2) 1897 (77.2) 1135 (78.7) 1508 (81.2%) 5355 (78.7%) 15518(20.2) 3273(21.3) 1892 (20.0) 1617 (21.5) 1470 (20.0) 1260 (22.5) 1029 (21.1) 9402 (0.30) 397 (12.3) 331 (10.8) 547 (17.8) 559 (22.8) 403 (26.2) 350 18.8% 145021.3%
393.3 0.07 0.000*
MTP period MTP-I MTP-II 36657 40199 28766(78.5) 32572(81.0) 7891(21.5) 7627(19.0)
77.6 0.03 0.000*
DOT facility level
Hospital Health Center Clinic 16189 (16.1) 12378 (16.1) 48289 (62.8) 12348(76.3) 9750(78.8) 39240(81.3) 3841(23.7) 2628(21.2) 9049(18.7)
197.0 0.05 0.000*
TB registration status
Previously registered
Patient not registered
169 (0.23) 76687 (98.8) 33(19.5) 61305(79.9) 136(80.5) 15382(20.1)
382 0.07 0.000*
Gender Female Male 32556(42.1) 44300(57.9) 26352(80.9) 34986(79.0) 6204(19.1) 9314(21.0)
9 Patient’s age
0 - 04 years
05 – 14 years
15 – 24 years
25 - 34 years
35 - 44 years
45 – 54 years
55 – 64 years
65+ years 4878(6.3) 4167(5.4) 9260(12.1) 21942(28.6) 18558(24) 9462(12.3) 4498(5.9) 4091(5.4) 4191(85.9) 3729(89.5) 7766(83.9) 17564(80.0) 14467(78.5) 7292(77.1) 3355(74.6) 2874(70.3) 687(14.1) 438(10.5) 1494(16.1) 4378(20.0) 3991(21.5) 2170(22.9) 1143(25.4) 1217(29.7)
822.6 0.10 0.000*
Patient aged < 5 years
Yes No 70415(91.6) 6441(8.4) 5596(86.9) 55742(79.2) 845(13.1) 14673(20.8)
218.2 0.05 0.000*
Treatment category New patient Retreatment 62469(87.6) 9567(12.4) 51161(81.9) 6695(70) 11308(18.1) 2872(30.0)
745.4 0.10 0.000*
TB case registered
New patient Failure Previously treated Readmission Recurrent TB Relapse TB 62469(81.3) 675(0.9) 3508(4.6) 1043(1.4) 1313(1.7) 7848(10.2) 51161(81.9) 370(54.8) 2509(71.5) 674(64.6) 974(74.2) 5650(72.0) 11308(18.1) 305(45.2) 999(28.5) 369(35.4) 339(25.8) 2198(28)
1053 0.11 0.000*
Baseline sputum smear
Smear negative (-)
Smear positive (+)
Smear not done
14453(18.8) 36358(47.3) 26042(33.9) 11544(79.9) 29165(80.2) 20629(79.2) 2909(20.1) 7193(19.8) 5416(20.8)
9.7 0.01 0.008*
Class of smear done
EPTB No smear
PTB No smear
PTB Smear negative (–)
PTB Smear negative (+)
14733(19.2) 13457(17.5) 12325(16.0) 36341(47.3) 11993(81.4) 10423(77.5) 9772(79.3) 29150(80.2) 2740(18.6) 3034(22.5) 2553(20.7) 7191(19.8)
10 Microscopy (Pre-treatment) Negative - Positive + Missing result 15971(20.8) 34839(45.3) 26046(33.9) 12832(80.3) 27876(80.0) 20630(79.2) 3139(19.7) 6963(20.0) 5416(20.8)
9.6 0.01 0.008*
TB Classification EPTB PTB 14733(19.2) 62123(80.8) 11993(81.4) 49345(79.4) 2740(18.6) 12778(20.6)
28.7 0.02 0.000*
TB regimen initiated
2HRZE/4HR (A) 2HRZE/1HRZE/5HRE (A) 2HRZE/1HRZE/5HR (C) 2HRZ/4HR (C) Other regimen 57238(74.5) 14006(18.2) 342(0.45) 4914(6.4) 356(0.5) 46673(81.5) 9883(70.6) 288(84.2) 4251(86.5) 243(68.3) 10565(18.5) 4123(29.4) 54(15.8) 663(13.5) 113(31.7)
1020 0.12 0.000*
DOT supporter/type Guardian (relat/neigh) Workplace Health Facility Community H/Worker Other 28546(48.9) 682(1.2) 27410(46.9) 1409(2.4) 358(0.6) 23480(82.3) 566(83.0) 21462(78.2) 1230(87.3) 257(71.8) 5066(17.7) 116(17.0) 5948(21.7) 179(12.7) 101(28.2)
201.6 0.06 0.000*
HIV status Negative Positive Unknown 25476(44.0) 27704(47.9) 4676(8.1) 21752(85.4) 21243(76.7) 3713(79.4) 3724(14.6) 6461(23.3) 963(20.6)
652.1 0.11 0.000*
Patient on HAART
Yes No 16741(62.9) 9894(37.1) 13184(78.8) 7713(78.0) 3557(21.2) 2181(22)
2.3 0.01 0.127
HIV IPT exposure
Yes No 338(3.2) 10382(96.9) 264(78.1) 8256(79.5) 74(21.9) 2126(20.5)
0.4 0.01 0.526
11 No Yes 5065(17.6) 23773(82.4) 4103(81.0) 18382(77.3) 962(19.0)
5391(22.7) 33 0.034 0.000*
Developed MDR – TB
Yes No 565(0.6) 76291(99.4) - 61338(80.4) 565(100) 14953(19.6) 2249. 8
0.17 0.000*
Sputum conversion- at 2months
To smear negative -
Defaulted
Died during treat
Remained positive +
Results not available
Patient transferred 17835(49.2) 478(1.3) 1374(3.8) 2702(7.5) 13306(36.7) 556(1.5) 16735(93.8) - - 1971(72.9) 10460(78.6) - 1100(6.2) 478(100) 1374(100) 731(27.1) 2846(21.4) 556(100) 1206 8
0.58 0.000*
Sputum conversion at 3months
To smear negative -
Defaulted
Died during treat
Remained positive +
Results not available
Patient transferred 25262(69.7) 712(2.0) 1543(4.3) 2361(6.5) 5745(15.9) 628(1.7) 23663(93.7) - - 1441(61%) 4062(70.7) - 155(6.3) 712(100) 1543(100) 920(39) 1683(29.3) 628(100) 1558 7
0.66 0.000*
* = significant p value by Pearson Chi-Square, * = significant p value by Pearson Chi-Square, MTP = medium term plans, TB= Tuberculosis, EPTB = extra pulmonary tuberculosis, PTB = pulmonary tuberculosis, IPT= Isoniazid Prophylaxis Therapy, CPT=cotrimoxazole prophylaxis, MDR-TB = drug resistant tuberculosis
12
patients appreciably more likely to have treatment failure (p<0.000). This was also seen in the multivariate analysis (Table 2). However, no difference if HIV patients are on HAART (p=0.127) (Table 1).
Most TB cases were categorized as new (87.6%), i.e. had never received treatment for TB, or had taken treatment for not more than one month, and had pulmonary TB (PTB, 80.8%) compared to EPTB. One third of the cases did not have sputum smear evaluated (33.9%) at the start of TB treatment. Most patients were initiated on 2RHZE/4RH (74.5%) compared to 2RHZE/4RHE. Guardians (i.e. family members or relatives) of the TB cases (48.9%) were the main DOT supporters, compared to DOT nurses or workplace peers.
Of the 104,603 TB cases, 73.5% had treatment outcomes registered in the electronic
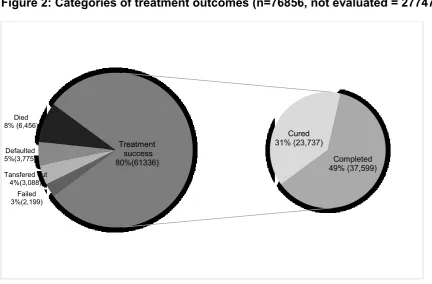
[image:12.595.71.504.475.759.2]treatment record. The treatment success rate for the review period was 80% (range: 77.2% - 89.2% by region), which was registered as treatment completion (61.3%) rather than cure (38.7%) (Figure 2). Death and LTFU were the most prevalent unsuccessful treatment outcomes (Table1). The mean TSR was significantly higher among TB cases registered at primary health care (PHC) facilities (i.e. Health centers, 72.4% and clinics, 74.5%) compared to hospital, 71.4 (p<0.001). Though the TSR were above 80% in most regions (8/14), no region achieved the 90% global target for TSR. Only two regions out of 14, Zambezi and Omaheke, surpassed the 85% WHO TSR targets (Figure 3).
Figure 2: Categories of treatment outcomes (n=76856, not evaluated = 27747)
Failed 3%(2,199) Tansfered out
4%(3,088) Defaulted 5%(3,775) Died 8% (6,456)
Cured 31% (23,737)
Completed 49% (37,599) Treatment
13
Figure 3: Period prevalence of TB Treatment outcomes by regions in Namibia
Treatment success was statistically significantly (p<0.001) associated with all programmatic, clinical, patient demographic and treatment covariates (Table 1), except for prior exposure to isoniazid prophylactic therapy (IPT, p=0.526) or co-medication with antiretroviral therapy (ART, p<0.127) (Table 1).
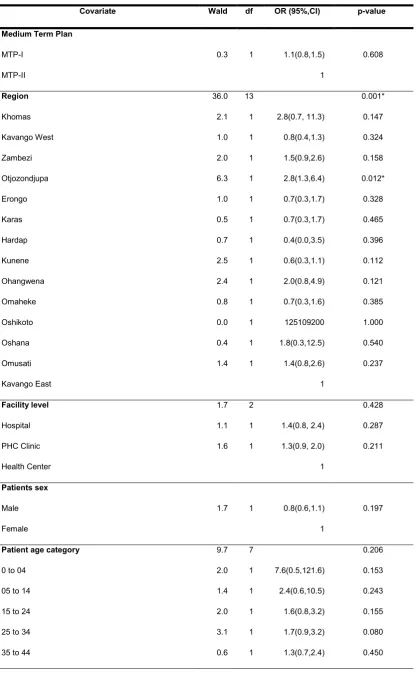
A test of the full logistic regression model (Table 2), against a constant only model, was statistically significant, indicating that the programmatic, clinical, patient and treatment predictors as a set reliably distinguished between successful and unsuccessful treatment outcomes (2 = 1401.3, p<0.001 with df = 48). A good relationship between prediction and grouping by successful (1) and unsuccessful outcome (0) was indicated by a Nagelkerke’s R2 score of 0.597 as well as a non-significant Hosmer and Lemeshow Test (2 = 11.9, p=0.156 with df = 8).
80% 79%
80%
78%
80%
77%
79% 28
88% 89% 82% 77%
74% 81%
79%
20% 21% 20%
22% 20% 23% 21%
72% 12 11 18 23% 26%
19% 21%
0 20 40 60 80 100
Namibia
Khomas
Erongo
Ohangwena
Oshikoto
Kavango West
Karas
Otjozondjupa Omaheke
Zambezi Hardap Kunene Kavango East
Oshana Omusati
14
Table 2: Multivariate analysis of predictors of tuberculosis treatment outcomes
Covariate Wald df OR (95%,CI) p-value
Medium Term Plan
MTP-I
MTP-II
0.3 1 1.1(0.8,1.5)
1 0.608 Region Khomas Kavango West Zambezi Otjozondjupa Erongo Karas Hardap Kunene Ohangwena Omaheke Oshikoto Oshana Omusati Kavango East 36.0 2.1 1.0 2.0 6.3 1.0 0.5 0.7 2.5 2.4 0.8 0.0 0.4 1.4 13 1 1 1 1 1 1 1 1 1 1 1 1 1 2.8(0.7, 11.3) 0.8(0.4,1.3) 1.5(0.9,2.6) 2.8(1.3,6.4) 0.7(0.3,1.7) 0.7(0.3,1.7) 0.4(0.0,3.5) 0.6(0.3,1.1) 2.0(0.8,4.9) 0.7(0.3,1.6) 125109200 1.8(0.3,12.5) 1.4(0.8,2.6) 1 0.001* 0.147 0.324 0.158 0.012* 0.328 0.465 0.396 0.112 0.121 0.385 1.000 0.540 0.237 Facility level Hospital PHC Clinic Health Center 1.7 1.1 1.6 2 1 1 1.4(0.8, 2.4) 1.3(0.9, 2.0) 1 0.428 0.287 0.211 Patients sex Male Female
1.7 1 0.8(0.6,1.1)
1
0.197
Patient age category
0 to 04
05 to 14
15 to 24
25 to 34
35 to 44
15 45 to 54
55 to 64
65+ 0.3 3.3 1 1 1.2(0.6,2.3) 2.1(0.9,4.4) 0.602 0.070 Previously registered No Yes
0.1 1 0.6(0.0,9.0)
1 0.726 Diagnostic classification Failure Readmission Relapse 1.7 0.5 1.3 2 1 1 0.7(0.3,1.8) 0.6(0.3,1.4) 1 0.429 0.467 0.246 Pulmonary Lymph Nodes Miliary Other Sites Pleura Bones/Joints 0.0 0.0 0.0 0.0 0.0 0.0 5 1 1 1 1 1 0.0(0.0,1.0) 1.3 0.4 0.4 0.0 1.000 0.999 1.000 1.000 1.000 0.999 DOT Provider
Guardian (relative, neighbor)
Workplace
Health Facility
Community health worker
Other 27.4 25.3 12.8 20.4 10.5 4 1 1 1 1 10.8(4.3,27.2) 25.6(4.3,151.8) 8.6(3.4,22.0) 10.6(2.5,44.4) 1 0.000* 0.000* 0.000* 0.000* 0.001*
TB regimen initiated
2 HRZE/4 HR
2 HRZES/1 HRZE/5 HRE (Adults)
2 HRZ / 4 HR
41.7 0.9 0.0 0.0 3 1 1 1 3.2(0.3,34.5) 1.0(0.1,11.1) 1 0.000* 0.333 0.999
Smear non conversion
Yes
No
459.1 1 0.02(0.01,0.03)
1
0.000*
Sputum conversion 2 months
Converted to smear negative
Remaining smear positive
16
Antiretroviral Treatment
No
Yes
0.8 1 0.8(0.6,1.2)
1
0.363
Cotrimoxazole Prophylaxis
No
Yes
9.6 1 0.4(0.2,0.7)
1
0.002*
IPT (isoniazid) exposure
No
Yes
0.5 1 1.2(0.7,2.6)
1
0.464
HIV status
Negative
Positive
Unknown
26.1
0.1
12.1 2
1
1
1.1(0.5,2.2)
0.2(0.1,0.5)
1
0.000*
0.813
0.001*
Constant 0.000 1 0.121 1.000
a. Variable(s) entered on step 1: Medium Term Plan strategic plan, I or II, REGION, FACLEVEL, PREVREGT, SEX, REGIMENTYPE, DIAGCLASS, SITEINFECTEDTB, MDRPatientt, DOTTYPE, PtAgegroup, NOTCONVERTED, SPUTUM2mon, ARTtreat, CPTtherapy, IPTrecieved, HIVSTATUS.
The prediction success of the model overall was 90.48% with 95.1% for successful treatment outcome and 71.2% for non-successful treatment outcome. The Wald criterion demonstrated consistency between TB treatment success and, the regions of implementation of DOTS in Namibia (p<0.001) – with some regions such as Otjiwarongo (OR=2.8, 95%CI:1.3,6.4) having significantly higher TSR than others, the first-line TB regimen initiated (p<0.001), the type of DOT provider (p<0.001) with TSR being highest for DOT implemented at the
workplace (OR=25.6, 95%CI: 4.3, 151.8), non-conversion of sputum at 2 months (OR=0.2, 95%CI: 0.01, 0.03), co-infection with HIV (OR=0.2, 95%CI: 0.01, 0.5) and exposure to cotrimoxazole prophylaxis therapy (CPT - OR=0.4, 95%CI: 0.2, 0.7).
The patients’ demographics, health facility level and prior TB registration and/or exposure to TB medication or IPT and diagnostic classifications were not significant predictors for
17
4. Discussion
The study determined patient, programmatic and diagnostic predictors of treatment success of first-line TB treatment in Namibia (Table 1). The period prevalence of DOTS treatment success in Namibia was 80%, which varied across the regions in Namibia. However, this falls short of the global TSR targets to End TB in Namibia.
These findings are consistent with the WHO global tuberculosis reports on in LMIC and Namibia that depict marginal improvements in past five years17,29. However, of concern, is that majority of the treatment success end points (61%) in Namibia were due to treatment completion rather than cure (Figure 2). Previous studies in the Omaheke region in Namibia, and in other LMICs such as Uganda and South Africa, suggest that low acceptance and poor implementation of CB-DOTS are due to social, cultural, programmatic factors 21,30. These factors together with access to DOTS services31 are important drivers of poor TB treatment outcomes18,20,32. This finding suggests the need to strengthen bacteriological monitoring of patients on treatment across all regions in Namibia to optimize case management, as recommended by the global End TB strategy31.
This study showed a significant association between TB treatment success and all programmatic, patient demographics such as sex and age, clinical (HIV coinfection, TB diagnosis and sputum conversion at month 2/3 and treatment covariates except IPT and prior ART exposure (Table 1). Similar studies in South Africa and Uganda25,26 have also associated poor treatment outcomes to the male gender, HIV co-infection, diagnostic and the sputum conversion at 2 months as well as the WHO TB regimen used33. In addition, coinfection with HIV and/or diabetes among TB patients, patient related demographic characteristics34,35, and pharmacokinetic variability among populations36. In addition in this study, poor treatment outcomes were as a result of defaulting of treatment and death. Previous studies have associated high rates of death and defaulting among TB patients to be due to the inappropriate choice of TB regimens37,38, HIV co-infection 39,40, adverse drug effects41–43 and the lack of screening and monitoring systems6,18,44,45.
18
that have reported a positive HIV status and sputum non-conversion at month 2 as important risk factors for poor treatment outcomes.
This study also gives conflicting reports on the effect of gender on TB treatment success to studies by Nakiyingi et al. and others in Uganda that indicated that male patients are at increased risk of poor outcomes 25,26. However, in our study, patients who received treatment through a work placed based DOTS care increased their TSR by more than three times compared to other types of DOT providers. The results indicate the importance of optimizing the TB regimens36,41,50, strengthening the support DOTS support system and instigating a system to screen and monitor for risk for poor treatment outcomes among patients with HIV co-infection, and prior exposure to cotrimoxazole, to maximize the outcome of DOTS. The regional variation in TSR may be due population related characteristics and/or access and quality of health care at these facilities. We will be exploring this further in future studies.
The fact that bacteriological monitoring is not routinely undertaken in 26% of the TB cases may also predispose patients to poor outcomes. There is also a need to establish the HIV status of the patient as a certain proportion of patients were initiated on treatment with unknown status. There is also a need to establish a system for screening for sub-optimal serum levels of first line regimens as well as pharmacovigilance monitoring 41 given concerns with adverse drug reactions43. The objective being to make appropriate dosage adjustments to improve outcomes. Several studies have shown that up to 75% of the
patients do not achieve optimal drug levels and adjustments of doses will improve outcomes.
Our findings are also different from a number of other studies that show favourable treatment outcomes among patients on ART and IPT and CPT. These differences may be due to the fact that our study was of a retrospective design that utilized national wide routine data compared to RCTs were the conditions of the study are controlled. The regional variation in TSR potentially indicates the heterogeneity of our study population that may have effects on the TSR. We also plan to follow this up in future research studies as the rationale will provide additional guidance on ways to further improve treatment outcomes in Namibia.
We accept this study has a number of limitations. The principal one includes the
retrospective design where the accuracy of the data collected cannot be validated and there were missing data on several covariates including possible adverse drug reactions and the type of ART regimen. We will be undertaking a separate study to investigate the side-effects of treatment regimens as well as undertaking a separate analysis of MDR-TB cases.
19
these patients and describes the limitations of the current DOTS interventions using national wide data aggregated over a 10-year period. As a result, we believe that our findings are important in providing evidence which can guide efforts to improve treatment outcomes among patients at risk of poor outcomes, which Namibia is already starting to review in its third strategic plan.
Author contributions
DK, RKV, RN, FM, AT, AA, GG, EE and TR help devise the study; DK, GG and EE
undertook the data collection and initial analysis; DK, RKV, BBG and TR produced the first manuscript. All authors contributed to successive drafts as well as the update. All authors approved the final paper.
Funding
This paper was not funded.
Declaration of interest
E. Ene is an employee of the Anoixis Corporation. In addition, R. Nunurai, F. Mavungha, A. Thomas, R. Amutenya and G. Gunther are employees of the Ministry of Health and Social Sciences in Namibia for the TB programme. The authors have no other relevant affiliations or financial involvement with any organization or entity with a financial interest in or financial conflict with the subject matter or materials discussed in the manuscript apart from those disclosed.
Reviewer disclosures
Peer reviewers on this manuscript have no relevant financial or other relationships to disclose.
Acknowledgements
20
References
Papers of special note have been highlighted as:
* of interest
** of considerable interest
1. Republic of Namibia Ministry of Health and Social Services. National Guidelines for the Management of Tuberculosis, Third Edition. 2011. Available at URL:
http://www.who.int/hiv/pub/guidelines/namibia_tb.pdf
2. Corbett EL, Marston B, Churchyard GJ, De Cock KM. Tuberculosis in sub-Saharan Africa: Opportunities, challenges, and change in the era of antiretroviral treatment. Lancet. 2006;367(9514):926-937.
3. Lawn SD, Zumla AI. Tuberculosis. Lancet. 2011;378(9785):57-72
4. WHO. Use of high burden country lists for TB by WHO in the post-2015 era. 2015. Available at URL:
http://www.who.int/tb/publications/global_report/high_tb_burdencountrylists2016-2020summary.pdf
*Key reference discussing the extent of TB across countries
5. WHO. The Stop TB Strategy: building on and enhancing DOTS to meet the TB-related Millennium Development Goals. 2006. Available at URL:
http://apps.who.int/iris/bitstream/handle/10665/69241/WHO_HTM_STB_2006.368_en g.pdf?sequence=1&isAllowed=y
6. Thiam S, LeFevre AM, Hane F, Ndiaye A, Ba F, Fielding KL, et al. Effectiveness of a strategy to improve adherence to tuberculosis treatment in a resource-poor setting: a cluster randomized controlled trial. Jama. 2007;297(4):380-6
7. World Health Organization. What Is DOTS ? A Guide to Understanding the WHO-Recommended TB Control Strategy Known as DOTS. 1999. Available at URL: http://apps.who.int/iris/bitstream/handle/10665/65979/WHO_CDS_CPC_TB_99.270.p df?sequence=1&isAllowed=y
8. Borgdorff MW, Floyd K, Broekmans JF. Interventions to reduce tuberculosis mortality and transmission in low- and middle-income countries. Bull World Health Organ. 2002;80(3):217-227.
21
http://apps.who.int/medicinedocs/documents/s23098en/s23098en.pdf
*Key WHO update discussing the extent of TB across countries
10. Tanday S. Will we ever eliminate tuberculosis, the voiceless disease? Lancet Respir Med. 2017. Mar 15
11. van Gorkom J, Mavhunga F, Omer OA, et al. TB control in Namibia 2002-2011: Progress and technical assistance. Open Infect Dis J. 2013;7(SPEC ISS1):23-29
*Good paper outlining progress in TB control in Namibia in recent years
12. Baltussen R, Floyd K, Dye C. Cost effectiveness analysis of strategies for tuberculosis control in developing countries. BMJ. 2005;331(7529):1364
13. Republic of Namibia Ministry of Health and Social Services. Republic of Namibia Ministry of Health and Social Services National Tuberculosis and Leprosy Programme Annual Report : 2014-2015. Windhoek; 2015.
*Good update documenting approaches in Namibia to help treat TB
14. Laxminarayan R, Klein EY, Darley S, Adeyi O. Global investments in TB control: Economic benefits. Health Aff. 2009;28(4):w730-42
15. Ministry of Health and Social Services. National Tuberculosis and Leprosy Programme Summary Report 2014-15. 2015.
16. WHO. WHO | Tuberculosis. WHO. 2016. Avaulable at URL: http://www.who.int/mediacentre/factsheets/fs104/en/.
17. World Health Organization. Global Tuberculosis Report 2016.
18. Studies H, Ehlers U, Unisa HS. Factors associated with community-based TB care in the omaheke region, Namibia. 9(1):59-72.
19. WHO. MDR-TB. Available at URL: http://www.who.int/tb/challenges/mdr/MDR-RR_TB_factsheet_2017.pdf.
20. Zvavamwe Z, Ehlers VJ. Experiences of a community-based tuberculosis treatment programme in Namibia: A comparative cohort study. Int J Nurs Stud. 2009;46(3):302-309
22
Int J Mycobacteriology. 2014;3(4):268-275.
22. DeRiemer K, García-García L, Bobadilla-del-Valle M, et al. Does DOTS work in populations with drug-resistant tuberculosis? Lancet. 2005;365(9466):1239-1245.
23. Huynh GH, Klein DJ, Chin DP, et al. Tuberculosis control strategies to reach the 2035 global targets in China: the role of changing demographics and reactivation disease. BMC Med. 2015;13(1):88.
24. Acosta CD, Rusovich V, Harries AD, Ahmedov S, van den Boom M, Dara M. A new roadmap for childhood tuberculosis. Lancet Glob Heal. 2014;2(1):e15-7
25. Nakiyingi L, Bwanika JM, Kirenga B, et al. Clinical Predictors and Accuracy of Empiric Tuberculosis Treatment among Sputum Smear-Negative HIV-Infected Adult TB Suspects in Uganda. PLoS One. 2013;8(9).
26. Namukwaya E, Nakwagala FN, Mulekya F, Mayanja-Kizza H, Mugerwa R. Predictors of treatment failure among pulmonary tuberculosis patients in mulago hospital, Uganda. Afr Health Sci. 2011;11 Suppl 1:S105-11
27. Waitt CJ, Squire SB, C.J. W, S.B. S. A systematic review of risk factors for death in adults during and after tuberculosis treatment. Int J Tuberc Lung Dis. 2011;15(7):871-885.
28. WHO. Best Practices in Prevention, Control and Care for Drug Resistant Tuberculosis. 2017.Available at URL:
http://www.euro.who.int/__data/assets/pdf_file/0020/216650/Best-practices-in-prevention,control-and-care-for-drugresistant-tuberculosis-Eng.pdf
29. MoHSS. Republic of Namibia Ministry of Health and Social Services National Tuberculosis and Leprosy Programme Annual Report : 2014-2015. 2015.
30. Kapoor SK, Raman AV, Sachdeva KS, Satyanarayana S. How did the TB patients reach DOTS services in Delhi? a study of patient treatment seeking behavior. PLoS One. 2012;7(8)
31. Uplekar M, Weil D, Lonnroth K, et al. WHO’s new end TB strategy. Lancet. 2015;385(9979):1799-1801.
** Good paper outlining potential strategies to eradicate TB
23
Pulmonary Tuberculosis Patients in Butaleja District in Uganda. African Journal for Physical Health Education, Recreation and Dance. 2014;20(3):841-57
33. Oxlade O, Piatek A, Vincent C, Menzies D. Modeling the impact of tuberculosis interventions on epidemiologic outcomes and health system costs. BMC Public Health. 2015;15(1):141.
34. Sesay ML. Patient Characteristics and Treatment Outcomes Among Tuberculosis Patients in Sierra Leone. 2017. Available at URL:
https://scholarworks.waldenu.edu/cgi/viewcontent.cgi?article=4680&context=dissertati ons
35. Chida N, Ansari Z, Hussain H, et al. Determinants of default from tuberculosis treatment among patients with drug-susceptible tuberculosis in Karachi, Pakistan: A mixed methods: Study. PLoS One. 2015;10(11):1-14.
36. Verbeeck RK, Günther G, Kibuule D, Hunter C, Rennie TW. Optimizing treatment outcome of first-line anti-tuberculosis drugs: the role of therapeutic drug monitoring. Eur J Clin Pharmacol. 2016;72(8):905-916.
37. Marx FM, Dunbar R, Enarson DA, Beyers N. The Rate of Sputum Smear-Positive Tuberculosis after Treatment Default in a High-Burden Setting: A Retrospective Cohort Study. PLoS One. 2012;7(9):1-9.
38. Lienhardt C, Manneh K, Bouchier V, Lahai G, Milligan PJM, McAdam KPWJ. Factors determining the outcome of treatment of adult smear-positive tuberculosis cases in The Gambia. Int J Tuberc Lung Dis. 1998;2(9):712-718.
39. Sinshaw Y, Alemu S, Fekadu A, Gizachew M. Successful TB Treatment Outcome and Its Associated Factors among TB/HIV Co-Infected Patients Attending Gondar
University Referral Hospital, Northwest Ethiopia: An Institution Based Cross-Sectional Study. Vol 17. BMC Infect Dis. 2017;17(1):132
40. van Hest R, Ködmön C, Verver S, et al. Tuberculosis treatment outcome monitoring in European Union countries: systematic review. Eur Respir J. 2013;41(3):635-643.
41. Choi R, Jeong B-H, Koh W-J, Lee S-Y. Recommendations for Optimizing Tuberculosis Treatment: Therapeutic Drug Monitoring, Pharmacogenetics, and Nutritional Status Considerations. Ann Lab Med. 2017;37(2):97. d
24
42. Baboli MT, Abdolmaleki EY, Shirzad M, Samakoosh MA, Ghasemian R. Prevalence of drug-induced hepatitis and its risk factors in the treatment of tuberculosis in TB infected patients attending Razi hospital, 2006-2011. [Persian]. J Maz Univ Med Sci. 2014;24(109):235-240.
43. Sagwa E, Mantel-Teeuwisse AK, Ruswa N, et al. The burden of adverse events during treatment of drug-resistant tuberculosis in Namibia. South Med Rev. 2012;5(1):6-13.
**Interesting paper outlining the nature and extent of ADRs furing treatment of patients with drug-resistant TB in Namibia
44. Garfein RS, Collins K, Muñoz F, et al. Feasibility of tuberculosis treatment monitoring by video directly observed therapy: A binational pilot study. Int J Tuberc Lung Dis. 2015;19(9)
45. Espinal MA, Kim SJ, Suarez PG, et al. Standard short-course chemotherapy for drug-resistant tuberculosis: treatment outcomes in 6 countries. Jama. 2000;283(19):2537-2545
46. Vasankari T, Holmstrom P, Ollgren J, Liippo K, Kokki M, Ruutu P. Risk factors for poor tuberculosis treatment outcome in Finland: a cohort study. BMC Public Health. 2007 Oct 14;7:291.
47. Hung CL, Chien JY, Ou CY. Associated factors for tuberculosis recurrence in Taiwan: A nationwide nested case-control study from 1998 to 2010. PLoS One. 2015;10(5):1-11
48. Gomes NM de F, Bastos MC da M, Marins RM, et al. Differences between Risk Factors Associated with Tuberculosis Treatment Abandonment and Mortality. Pulm Med. 2015;2015:1-8
49. Oshi DC, Oshi SN, Alobu I, Ukwaja KN. Profile, Outcomes, and Determinants of Unsuccessful Tuberculosis Treatment Outcomes among HIV-Infected Tuberculosis Patients in a Nigerian State. Tuberc Res Treat. 2014;2014:202983
50. Sotgiu G, Alffenaar J-WC, Centis R, et al. Therapeutic drug monitoring: how to improve drug dosage and patient safety in tuberculosis treatment. Int J Infect Dis. 2015;32:101-104
26
Supplement A: National Strategic Plan on Tuberculosis (MTP-I and MTP-II)
MTP-I: First Medium Term strategic Plan for TB
MTP-II: Second Medium Term strategic Plan for TB
Strategic result 1 Treatment success (cure + completion) rate increased from 65% to 85% for all patient categories by 2009
NTCP started rolling out CB-DOT in 2005
Introduction of Fixed Dose Combinations (FDCs) for first line tuberculosis treatment
High quality TB DOTs and leprosy services expanded and enhanced,
Review of TB treatment guidelines from 2RHZE/4RH to 2RHZE/4RHE
TSR of 87% achieved for all patient categories on firstline treatment
Uninterrupted supply of TB medicines
Strategic result 2 All tuberculosis suspects and patients have access to timely and quality-assured TB laboratory services
2. Increased access to high quality TB/HIV treatment and care intervention,
Strategic result 3 Adequate and competent human resources for TB control at all levels
3. Programmatic management of drug-resistant TB improved and scaled up,
DOT system for DR-TB patients
Strategic result 4 Management capacity of National Tuberculosis control program (NTCP) strengthened and adequate at all levels
4. General health systems strengthened and effectively supporting TB and leprosy services,
Strategic result 5 Operational research and epidemiological surveillance capacity in place and supporting management and M&E
5. Partnership for TB control and leprosy eradicated strengthened, and
Strategic result 6 80% of the general population have a
satisfactory level of knowledge on tuberculosis disease and services for appropriate health-seeking behaviour
6. Communities and people with TB and leprosy empowered.
Strategic result 7 All PLWHA and PLWTB have access to a continuum of care and support services for TB and HIV/AIDS, in all health care facilities and home-based care services in public and private sector by 2009
Strategic result 8 Financial resources for TB control in public and private sector are adequate
Strategic result 9 Specific TB control strategies implemented in sectors with high tuberculosis burden by 2009
Adapted from the Medium Term Plan (MTP-I and MTP-II) ;
MTP-I (2004-2009): Based on the DOTS strategy and MTP-II (2010-2015): Based on the Stop TB strategy and