This is a repository copy of
Selecting teachers and prospective teachers : a meta-analysis
.
White Rose Research Online URL for this paper:
http://eprints.whiterose.ac.uk/140347/
Version: Published Version
Article:
Klassen, Robert Mark orcid.org/0000-0002-1127-5777 and Kim, Lisa
orcid.org/0000-0001-9724-2396 (2019) Selecting teachers and prospective teachers : a
meta-analysis. Educational Research Review. pp. 32-51. ISSN 1747-938X
https://doi.org/10.1016/j.edurev.2018.12.003
eprints@whiterose.ac.uk
https://eprints.whiterose.ac.uk/
Reuse
This article is distributed under the terms of the Creative Commons Attribution (CC BY) licence. This licence
allows you to distribute, remix, tweak, and build upon the work, even commercially, as long as you credit the
authors for the original work. More information and the full terms of the licence here:
https://creativecommons.org/licenses/
Takedown
If you consider content in White Rose Research Online to be in breach of UK law, please notify us by
Contents lists available atScienceDirect
Educational Research Review
journal homepage:www.elsevier.com/locate/edurev
Review
Selecting teachers and prospective teachers: A meta-analysis
Robert M. Klassen
∗, Lisa E. Kim
University of York, United Kingdom
A R T I C L E I N F O
Keywords:
Teacher selection Teacher characteristics Personality
Initial teacher education Recruitment
A B S T R A C T
The purpose of this review article was to examine the methods used for the selection of teachers for employment and prospective teachers entering initial teacher education (ITE) programs, and to assess the predictive validity of these methods. We reviewed 32 studies reporting selection methods administered in high-stakes conditions and that included an external (not self-reported) teacher efectiveness outcome measure. The overall efect size was small but signiicant (r= 0.12,p< .001). Moderator analyses showed that academic and non-academic predictors were both signiicantly associated with teacher efectiveness measures and that efect sizes were small (but signiicant) for selection into employment and ITE. We conclude the review by pro-posing a research agenda that has the potential to enhance educational outcomes by improving the selection of prospective teachers.
1. Introduction
Does it matter how we select teachers for employment or how we select candidates for initial teacher education (ITE)? Much attention has been paid to improving the quality of teaching and of ITE in the United States (e.g.,Atteberry, Loeb, & Wyckof, 2015; Darling-Hammond, 2010;Jackson, Rockof, & Staiger, 2014) and internationally (e.g.,Hattie, 2009;Hobson, Ashby, McIntyre, & Malderez, 2010;OECD, 2005). Evaluating the efectiveness of practicing teachers (Goldhaber, 2015;Kane & Staiger, 2012) and the quality of ITE programs (Greenberg, McKee, & Walsh, 2015;U.S. Department of Education, 2016) have become national education priorities, but little systematic attention has been focused on how we make decisions about choosing teachers for the classroom or how we select prospective teachers for ITE programs. Furthermore, beliefs about teacher selection1may be inluenced by a pervasive
implicit belief that teaching is unique, and that lessons learned from selection research and methods in other disciplines do not apply to education (Harris & Rutledge, 2010).
Systematic research on selection into employment and training is well developed in a wide variety of ields: law (Marks & Moss, 2016), medicine (Patterson et al., 2016), the military (Gayton & Kehoe, 2015), business (Cook, 2009), undergraduate and graduate education (Richardson, Abraham, & Bond, 2012;Schwager, Hülsheger, Bridgeman, & Lang, 2015), and dentistry (Taylor, Mehra, Elley, Patterson, & Cousans, 2016). But systematic research on the selection of teachers and prospective teachers—a role weighted with enormous social and economic expectations and impact (Hanushek, 2014)—has largely been ignored, and selection methods in education have been described as “ad hoc” (p. 24,Goldhaber, Grout, & Huntington-Klein, 2014) and “information poor” (p. 324,Liu & Johnson, 2006). The purpose of this article is to review teacher and prospective teacher selection methods, to assess the predictive validity of these methods, and to propose how to improve future teacher and prospective teacher selection practices in ways that
https://doi.org/10.1016/j.edurev.2018.12.003
Received 6 May 2018; Received in revised form 12 December 2018; Accepted 20 December 2018 ∗
Corresponding author. Department of Education, University of York, Heslington, York, YO10 5DD, United Kingdom E-mail address:robert.klassen@york.ac.uk(R.M. Klassen).
1For ease-of-use, we use the term “teacher selection” to refer to selection of teachers for employment and the selection of prospective teachers into
ITE programs.
Educational Research Review 26 (2019) 32–51
Available online 26 December 2018
1747-938X/ © 2019 The Authors. Published by Elsevier Ltd. This is an open access article under the CC BY license (http://creativecommons.org/licenses/BY/4.0/).
relect the empirical and theoretical work conducted in education and other disciplines.
1.1. Selection methods
In an employment or training setting, selection methods are used in at least three situations: (a) when the number of applicants is greater than the number of available jobs or training places, (b) when there is a need to identify unsuitable applicants (‘selecting out’) before employment or training, and (c) when there is a desire to generate proiles of applicant strengths and weaknesses for future development. A selection process is built on an evaluation of available data; an important decision made by selectors is to determine the kinds of data that will be gathered in order to make predictions about future success. In the past, selection methods for most kinds of employment and training were left up to selector judgment and intuition, occasionally with the help of methods as diverse as astrology, physiognomy (analysis of facial features) and graphology (analysis of hand-writing;Chamorro-Premuzic & Furnham, 2010). Surprisingly, some of these unsubstantiated selection methods are still used for personnel selection (e.g.,Bangerter, Konig, Blatti, & Salvisberg, 2009).
In education, those making selection decisions may be prone to a similar lack of critical analysis of the validity of current selection methods, with little systematic gathering of evidence for the eicacy of selection methods (Bowles, Hattie, Dinham, Scull, & Clinton, 2014;Liu & Johnson, 2006). In a recent study in the UK,Davies et al. (2016)interviewed those making selection decisions for ITE and for school-based teacher training programs, and found that selectors emphasized the importance of their intuition when making selection decisions: “Really, you do only need one question and a bit of conversation to ind out what you are looking for” (p. 298), with selectors relying on a “gut feeling” to identify the “X factor” (p. 298). In spite of the apparent conidence in the interviewees' selection approaches, little evidence was ofered for the quality of their selection decisions (e.g., “I wouldn't have any statistics … after they've left us,” p. 297). Although most people are conident that they can accurately judge personal characteristics through interviews (Dana, Dawes, & Peterson, 2013), extensive research from organizational psychology suggests that interviewers are prone to unreliable judgment and are inluenced in their decision-making by unconscious biases based on race, age, and appearance (Cook, 2009). Teacher selection models may be built on sophisticated teaching standards frameworks that include multiple domains of practice and competence (e.g.,Casey & Childs, 2017;Denner, Salzman, & Newsome, 2001), but may fail to adopt selection methods that reliably assess these domains.
Selection methods can be expensive. Expenses for school districts or ITE programs may include personnel costs for selection activities (e.g., multiple personnel involved with conducting interviews, observing group activities, or scoring personal statements), fees for training those who administer commercial selection tools, and further costs associated with scoring and reports for selection instruments.Metzger and Wu (2008)argued that examining the validity of selection methods in education is important at least partly because of the costs accrued for each candidate. Selection practices require periodic reviews to ensure that the methods used are cost-efective, reliable (consistent over time), valid (show evidence of predictive utility), and fair (unbiased) for all applicants, regardless of gender, ethnicity, sexuality, and socio-economic status.
1.1.1. Selection research in other disciplines
Over the last 100 years, systematic research has explored the reliability, validity, and fairness of academic and non-academic selection methods in a range of disciplines (Gottheil & Michael, 1957;Ryan & Ployhart, 2014). A recent review of selection into medical training (Patterson et al., 2016) found that academic records, multiple mini-interviews (MMIs), and situational judgment tests (SJTs) were less prone to bias and more predictive of outcomes (e.g., medical school performance and supervisor ratings of trainee job performance) than reference letters and individual interviews. The predictive validity of selection methods varies across disciplines: predictive validity coeicients (i.e., correlations with outcomes such as supervisor ratings of performance) range from 0.18 to 0.43 in dentistry (Patterson, Ashworth, Mehra, & Falcon, 2012), 0.37 in medicine (Lievens & Patterson, 2011), between 0.06 and 0.50 in business (Christian, Edwards, & Bradley, 2010), and 0.34 across multiple occupation groups (McDaniel, Morgeson, Finnegan, Campion, & Braverman, 2001). Critical analysis of selection methods in other disciplines is growing (e.g., clinical psy-chology;Woolf et al., 2015), but this research growth has not been seen in education.
1.1.2. Teacher selection research and practices
The lack of systematic research on selection into teaching—perhaps unique among major professional ields—is surprising in view of recent eforts on identifying and measuring the key factors of teacher efectiveness (e.g.,Kane, McCafrey, Miller, & Staiger, 2013), tracing the efectiveness trajectories of new teachers (e.g.,Atteberry et al., 2015), and on identifying teacher characteristics linked with teaching outcomes (e.g.,Robertson-Kraft & Duckworth, 2014). Although pockets of research on selection of teachers for ITE and employment have been conducted by education researchers over the past decades (e.g.,Ebmeier & Ng, 2005;Metzger & Wu, 2008; Wise, Darling-Hammond, & Berry, 1987), systematic research has been sporadic. A 2008 meta-analysis explored the predictive validity of one widely used commercial selection tool, the Teacher Perceiver Interview (TPI;Metzger & Wu, 2008). The authors analyzed 24 studies (16 dissertations, 7 reports from the test publisher, and 1 journal article) and found a range of −0.12 to 0.87 for the correlations between TPI scores and indicators of teaching efectiveness, with a weighted mean ofr= 0.28, and a medianrof 0.22, considered by the authors to be a ‘modest’ efect size. In order to understand the antecedents of teacher efectiveness, it is helpful to consider the value and validity of current selection practices, and to explore viable alternatives used in other disciplines. Due to a lack of systematic research on selection in education, the methods in place often lack supporting evidence for their efectiveness. A recent review of teacher education selection practices in England and Wales (Klassen & Dolan, 2015) showed that most programs use the same predictors—personal statements, letters of reference, and interviews—to evaluate the personal
R.M. Klassen, L.E. Kim Educational Research Review 26 (2019) 32–51
characteristics of candidates. But evidence from other professional ields, especially medicine, suggests that evidence for personal statements is “mixed at best,” (Patterson et al., 2016, p. 42), that letters of reference “are neither a reliable nor a valid tool” for selection (p. 43), and that traditional face-to-face interviews are unreliable and prone to a range of systematic biases (Kausel, Culbertson, & Madrid, 2016).
1.2. Predicting teacher effectiveness
Making decisions about selecting prospective teachers is, at its heart, making a prediction about future teacher efectiveness. The selection process into employment and into ITE addresses the same fundamental predictive question:Is it likely that this applicant will be (or develop into) an effective teacher?Teachers become more relective, more knowledgeable about teaching, and generally more efective as they gain experience (e.g.,Antoniou, Kyriakides, & Creemers, 2015;Atteberry et al., 2015;Bahr & Mellor, 2016). Al-though some characteristics for selection into employment and into ITE may difer in kind and degree (e.g., employers expect applicants to have speciic pedagogical knowledge that ITE selectors would not expect in applicants), other characteristics (e.g., reasoning ability, motivation, empathy, conscientiousness) are similarly important across the teaching experience continuum (Kunter, Kleickmann, Klusmann, & Richter, 2013).
Teacher efectiveness—during ITE or during professional practice—is diicult to deine and even more diicult to measure (e.g., Kane et al., 2013). Researchers and practitioners have used observation measures, student value-added scores, and student reports to assess teacher efectiveness, with sometimes limited agreement between the diferent forms of assessment (Chetty, Friedman, & Rockof, 2014; Grissom & Loeb, 2017). Recent systematic research on measuring teacher efectiveness has provided support for measures such as the Classroom Assessment Scoring System (CLASS;Hamre et al., 2013), the International Comparative Analysis of Learning and Teaching (ICALT;van der Lans, van de Grift, & van Veen, 2018), and the International System for Teacher Observation and Feedback (ISTOF;Muijs et al., 2018). Research on teacher efectiveness measures has increased in the last decade, with improved reliability and validity, and increased consensus on the factors that underpin the frameworks and models of efective instructional practice (Gill, Shoji, Coen, & Place, 2016;Klassen & Tze, 2014).
1.2.1. Models of teacher effectiveness
[image:4.544.107.443.458.671.2]Teacher efectiveness refers to a set of within-person attributes—personality, motivation, beliefs, and dispositions—that interact with contextual factors (cultural, social, educational) to inluence student outcomes. Some models of teacher efectiveness focus largely on the role of learning opportunities, including teacher education and professional learning (e.g.,Muijs et al., 2014). Other models focus largely on within-classroom behaviors, such as theTeaching through Interactionsmodel proposed byHamre et al. (2013). Kunter and colleagues’ COACTIV model (seeFig. 1;Kunter et al., 2013) provides a useful framework for teacher selection because it is built on a dynamic interactionist view (Steyer, Schmitt, & Eid, 1999) that suggests that the expression of traits and attributes depends on the interface between within-person and contextual factors. The COACTIV model proposes that teaching competence develops over time through exposure to learning opportunities, but it also acknowledges the inluence of within-person factors that are present at entry into teacher training and practice. The active engagement in, and relections on, learning opportunities are not just de-pendent on the quality of the opportunities, but are also inluenced by the characteristics of the individual to whom the opportunity is presented.
Fig. 1.Dynamic interactionist view of teacher efectiveness (adapted fromKunter et al., 2013).
R.M. Klassen, L.E. Kim Educational Research Review 26 (2019) 32–51
Key within-person factors include academic attributes (in some literature called ‘cognitive attributes’) such as subject area knowledge, reasoning abilities, and pedagogical knowledge. Academic attributes can be readily assessed using existing academic records, subject-related tests, or various well-researched measures of cognitive abilities. Non-academic attributes (sometimes referred to as ‘non-cognitive’ attributes) refer to beliefs, motives, personality traits, and dispositions (e.g.,Patterson et al., 2016). In high-stakes testing, such as for selection purposes, measuring non-academic attributes presents unique challenges due to the prevalence of socially desirable responding and faking (Sackett, Lievens, Van Iddekinge, & Kuncel, 2017). Background factors such as educational qualiications and teaching-related experiences also form part of the personal characteristics that directly and indirectly inluence teacher efectiveness.Kunter et al., ‘s 2013model provides a theoretical foundation to explain how contextual factors, learning opportunities, and personal characteristics are all relevant to decisions about selecting prospective teachers.
1.3. The importance of research on teacher selection
Selecting prospective teachers for employment and teacher education programs can lead to improvements in educational out-comes because teacher efectiveness is related to student achievement, and because efectiveness varies among teachers ( Darling-Hammond & Youngs, 2002;Hindman & Stronge, 2009). Furthermore, teacher efects on student learning are additive and cumulative over time, meaning that a sequence of less efective teachers is diicult for a student to overcome (Wright, Horn, & Sanders, 1997). The selection of teachers and teacher candidates is important not just for students' academic outcomes and well-being, but for a nation's social and economic well-being. Economists rate the impact of a single teacher on class-level lifetime earnings gains in the hundreds of thousands of dollars (e.g.,Hanushek & Rivkin, 2012;Kane & Staiger, 2012), and hiring a new teacher represents a career-long investment of at least two million dollars (Goldhaber et al., 2014), meaning that selecting a teacher who is less efective, or who leaves the system (Synar & Maiden, 2012), may represent a costly mistake.
Although almost all new teachers and teacher education candidates will become more efective as they gain experience (e.g., Harris & Rutledge, 2010;Staiger & Rockof, 2010), it is also true that the ‘efectiveness starting point’ may be important, with the gap between higher- and lower-performing teachers showing stability over time.Atteberry et al. (2015)found that the initial performance of new teachers was reliably predictive of later performance, suggesting that early identiication, i.e., selection, of the most efective teachers pays long-term dividends. Some candidates will show higher levels of growth and teaching efectiveness than others, and some candidates in ITE programs experience little change in teaching-related motivation over time (Klassen & Durksen, 2014).Watt, Richardson, and Wilkins (2014)traced the motivation of students from the beginning to the end of their ITE program, and found that a sizable group—28% of participants in their study—began the program with low motivation and maintained that negative proile throughout the program. Predictable variation in teacher efectiveness (Atteberry et al.;Weisberg, Sexton, Mulhern, & Keeling, 2009) suggests that selection decisions have long-term consequences and that examining the efectiveness of selection methods is worth-while.
Countries with high-performing education systems, like Singapore (Sclafani, 2015) and Finland (Sahlberg, 2015), tend to place high levels of importance on developing rigorous approaches for teacher and prospective teacher selection (Barber & Mourshed, 2007;Hobson et al., 2010). In education systems with less heated competition for ITE places, there have also been calls for attention to improving selection methods, (Heinz, 2013;Thomson et al., 2011;UK House of Commons, 2012). Selection is necessary when the number of applicants outweighs the number of available places, but is also helpful to identify those candidates who may be un-suitable for a particular role (i.e., ‘selecting out’), and to identify candidates' strengths and weaknesses for future development.
1.4. Models of teacher selection
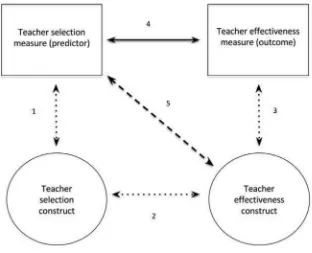
The predictors used for teacher selection can be chosen because they are hypothesized to target one or more target outcomes. Fig. 2provides a model (adapted fromPloyhart & Schneider, 2012) that shows how selection methods are built oninferredrelations. In this model, the latent constructs are represented by circles, and the observed variables (the measures used in selection) are represented by rectangles, with the inferred relations represented by dashed arrows. Arrow 4 represents the empirical relation between a selection measure (e.g., a measure of personality or motivation) and an outcome measure (e.g., a score from teaching observations), usually expressed as a correlation between the selection measure (i.e., predictor) and scores on a teaching outcome measure (i.e., criterion). Arrow 2 mirrors the relation between the predictor and outcome but denotes its theoretical or latent relation. Arrows 1 and 3 represent construct validity: arrow 1 represents the extent to which the selection measure (predictor) represents the construct of interest, and arrow 3 represents the construct validity of the outcome measure, and whether the outcome, usually some kind of measure of teacher efectiveness, represents the person's ‘true’ teaching efectiveness. Arrow 5 lies at the heart of the selection process and indicates the degree to which scores from an imperfect selection measure (e.g., measure of motivation or personality, letter of reference, face-to-face interview) are associated with ‘true’ diferences in teacher efectiveness, imperfectly measured by an outcome measure (e.g., grade on teaching practicum). Although the relation between the actual measure used in selection and the latent teacher efectiveness variable cannot be directly assessed, it can be inferred through the other relations (arrows) described in the model.
1.5. The present study
This review focuses on methods of selection of teachers (into employment) and prospective teachers (into ITE programs). The irst goal of the review is to systematically examine recent research (i.e., since 2000) exploring selection methods for teaching and
R.M. Klassen, L.E. Kim Educational Research Review 26 (2019) 32–51
selection methods for teacher education. In particular, we are interested in the predictive validity of the methods used for teacher selection. The second goal is to use the information gained from the review and to combine it with recent advances in selection methods outside of education in order to consider improved selection methods in education.
The following questions are posed:
1. What is the predictive validity of the methods used to select teachers and teacher candidates (i.e., what is the statistical re-lationship between selection methods and measured teacher efectiveness)?
(a) Are there diferences in the predictive validity of tests assessing academic and non-academic constructs?
(b) Are there diferences in the prediction of diferent kinds of teacher efectiveness measures, i.e., teacher observation measures and student performance measures, and practicum reports?
(c) Are there diferences in the predictive validity of the methods used for selection into employment and for selection for ITE programs?
2. What is the relation between cost and beneit (i.e., predictive validity) of selection practices?
2. Method
2.1. Literature search
Search procedures for systematic reviews should be reproducible, transparent, and thorough, and should identify relevant studies from a wide range of sources (Booth, Sutton, & Papaioannou, 2016). We conducted an exhaustive search of the literature using ive search strategies. First, we examined the contents of previous literature reviews of teacher selection (e.g.,Ebmeier, Dillon, & Ng, 2007;Goldhaber et al., 2014;Metzger & Wu, 2008) for articles that it our search criteria (i.e., that focused onteacher selectionand selection/admissions into teacher education/teacher training). Second, we searched a range of databases (British Education Index, ERIC, PsycINFO, Google Scholar, ProQuest Dissertations and Theses Global, and EconLit) with combinations ofteacher selection, teacher hiring, teacher education + admissions, teacher hiring instruments. Third, we hand-searched ive high-ranking education-related review journals (Educational Psychology Review, Educational Research Review, Review of Educational Research,andEducational Psychologist) for relevant studies. Fourth, we hand-searched the reference list and citations of each of the articles that met our inclusion criteria. Fifth, we emailed authors of relevant studies requesting further data where bivariate statistics between predictor and criterion variables were not calculable (e.g., in multiple regression using more than one predictor variable).
2.2. Inclusion and exclusion criteria
[image:6.544.118.430.52.305.2]The focus of our review was on selection methods used during actual selection processes, not during exploratory research studies, low-stakes pilot studies, or during development of selection tools. How a participant responds to an assessment exercise depends on
Fig. 2.Teacher selection model (adapted fromPloyhart & Schneider, 2012).
R.M. Klassen, L.E. Kim Educational Research Review 26 (2019) 32–51
the consequences of the experience: participants respond diferently to selection tools administered in high-stakes and low-stakes settings (Abdelfattah, 2010). We included studies that:
●Reported primary research in the form of journal articles, dissertations, and published research reports (including publicly available working papers, such as National Bureau of Economic Research working papers)
●Were published between 2000 and 2017. We chose 2000 as a starting date becauseMetzger and Wu's (2008)meta-analysis largely focused on pre-2000 studies, with only two peer-reviewed publications post-2000
●Included participants who were candidates for K-12 teaching positions or for ITE programs
●Included an academic or non-academic measure assessed at the point of selection for teaching employment or for admission into an ITE program
●Included an outcome measure that measured teacher efectiveness using an external measurement (i.e., not self-reported). Examples of outcome measures are teaching observation ratings (e.g., a principal's rating of a practicing teacher's performance, or a supervisor's rating of a pre-service teacher's teaching during a practicum), and classroom-level student achievement gain (e.g., value-added) scores. In ITE settings we included scores or grades for teaching practice given by university supervisors or teaching mentors, but not for overall academic performance (i.e., overall GPA in a teacher education program).
We excluded studies that:
●Examined the relation between practicingteachers' performance on selection methods, i.e., administered for research and de-velopment—not selection— purposes (e.g.,Ebmeier & Ng, 2005)
●Reported evaluations of teacher selection tools without reporting data gathered from administration of said tools (e.g.,Mertz, 2010)
●Reported unveriied data provided by test companies that provided non-peer-reviewed validity data supporting their proprietary selection methods (e.g.,Gallup Organization, 2001).
2.3. Search results
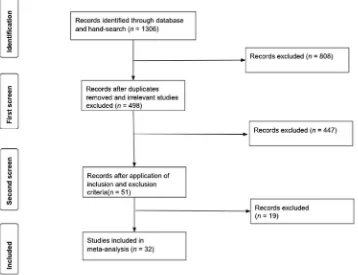
Our initial literature search (from databases and hand-searches) resulted in 1306 records. As a irst screen, we deleted duplicates, and then scanned titles and abstracts for all of the remaining records for relevance to our study questions, resulting in a pool of 498 articles to analyze more closely. The second screen applied the inclusion and exclusion criteria to each of the studies, resulting in a pool of 51 studies. For the third screen, we downloaded and carefully read the 51 studies (journal articles, dissertation reports, and published working papers) to see if a bivariate statistic could be computed between selection measure and outcome measure. Records were excluded from further analysis if bivariate statistics (e.g., Pearson'sr, Cohen'sd, Hedge'sg, Glass' Δ, multiple regression with only one IV) were not reported or could not be calculated, as per procedures of other meta-analyses (e.g.,Kuykendall, Tay, & Ng, 2015). Meta-analyses necessarily focus on bivariate relations and cannot aggregate partial correlation coeicients (as in multiple regression) unless all studies use the same set of IVs. However, the role of some intervening variables can be calculated, as we did here, through moderator analysis.
After applying the three levels of iltering to our initial record of 1306 records, we identiied 32 studies that met the criteria for inclusion in our review. The studies in our review are largely distinct from the 24 studies included in the Metzger and Wu review of commercial teacher selection instruments (2008), with only two studies (Buresh, 2003; Young & Delli, 2002) overlapping. We decided to retain the two overlapping studies in order to fully capture the range of articles for our target timeframe, i.e., 2000–2017. The low chart inFig. 3provides a visual overview of the search process.
2.4. Coding
A coding procedure was developed to analyze the included studies. The two authors jointly developed a coding protocol to capture the key study criteria. They independently coded a sample of the studies with a high level of agreement (nearly 100%, relecting the objective nature of the coding criteria). A consensus discussion approach was used to resolve any diferences about interpretation of coding of predictor or outcome variables. Correlations were reverse scored if necessary (e.g., when an outcome measure included a scale with ‘1’ as a positive score and ‘5’ as a negative score), so that higher scores represented higher levels of the teacher efectiveness outcome measure. We coded the 32 studies that met our search criteria for:
1. Reference details (i.e., dissertation, journal article, published report) 2. Study location (country of data collection)
3. Selection level (selection for employment, or selection for ITE, either primary, secondary, or both) 4. Selection method used (i.e., predictor variable)
5. Classiication of predictor variable (tests assessing academic, non-academic, or both types of constructs)
6. Classiication of outcome measure of teacher efectiveness used in study (e.g., ratings derived from principal observation, student value-added learning scores)
7. Results (qualitative and quantitative [efect size] description of predictive validity)
8. Estimation of cost of implementation (time cost, training and administration costs) for administering selection method.
R.M. Klassen, L.E. Kim Educational Research Review 26 (2019) 32–51
2.4.1. Estimation of the cost of implementation
For the estimation of cost of implementation of selection method, we calculated the average cost necessary to assess each can-didate using the selection method described in the study. We summed three components to calculate the estimated average cost per candidate: (a) an assessor's initial training costs divided by the number of candidates that an assessor was estimated to evaluate (e.g., 30 candidates), (b) estimated cost for the time spent for the assessor to be trained, and (c) estimated cost for the time spent evaluating the candidates. The cost for the training for commercial training tools was calculated from publicly available information, which took into account the length of training periods (e.g., Teacher Perceiver Interview, Haberman Star Interview). The costs for some methods could not be calculated as the studies did not specify the length of training (e.g., Venture for Excellence).
When details of the assessment time length were not speciied, estimates were applied: group discussions were estimated to take 45 min, structured interviews were estimated to take 30 min, checking applications (e.g., resumes, letters of recommendation), and checking for academic results were estimated to take 15 min for each task. Hourly rates based on the latest statistics available from OECD's teachers' statutory salaries divided by the statutory teaching hours per school year in public institutions for upper secondary general education at the top of salary scale (OECD, 2017) were applied. In efect, a pay rate of $69.89/hour was applied to the hourly cost estimations for the US-based studies, $99.77 for Switzerland, $88.32 for Canada, and $88.35 for Ireland (all in US dollars). If multiple assessors were necessary for assessing a candidate, the cost for multiple assessors was calculated. If multiple candidates were assessed simultaneously (e.g., in a group activity), the cost of assessing each candidate (that is, dividing the cost of having the assessor (s) by the number of candidates present) was calculated. Training time was included when stated in the methods, whereby a day of training was estimated to take 6 h per day. Information on costs could not be found forMcWhirter's (2014)andOestreich's (2016) studies and hence these studies were not included in the cost analysis.
2.4.2. Statistical correction
The Meta-Essentials program (van Rhee, Suurmond, & Hak, 2015) was used to calculate efect sizes in the meta-analysis. We used an inverse variance-weighting random efects model which assumes that ‘true’ efect sizes vary across studies. To weight multiple correlations within each study equally across multiple studies, individual Pearsonrs were transformed into Fisher'szscores, which were then averaged within each study, after which the average Fisher'szscores were transformed back to Pearsonrs (Pearsonrs were converted toz-scores becausers with small sample sizes are less likely to be normally distributed). These transformed Pearsonrs were then used to calculate the inal efect sizes for the meta-analysis.
2.4.3. Interpreting effect sizes
[image:8.544.95.453.62.337.2]Hattie suggests the following efect size descriptions for educational researchd = 0.20 (roughly equivalent to r = 0.10) describes a small efect, d = 0.40 (r = 0.20) describes a medium efect, and d = 0.60 (r = 0.30) describes a large efect. However,
Fig. 3.Flow chart of the inclusion and exclusion of studies.
R.M. Klassen, L.E. Kim Educational Research Review 26 (2019) 32–51
Table 1
Study descriptions and outcomes.
Authors and date Source Selection level Sample size and location
Predictors (selection methods used) Type of predictor
Outcome measures Predictor -outcomes correlations
Est. cost per applicant
Bieri and Schuler (2011)
Assessment and Evaluation in Higher Education
ITE: elementary and secondary
N= 147 (Switzerland)
Assessment center assessing ive competencies (communication, cooperation, assertiveness, motivation, fact inding) and self-reports, measured through a range of well-developed activities (including interviews, group task, and a presentation)
Non-acad Self-report and mentor scores on a questionnaire based on the ive assessment center dimensions; plus a mentor question: is this student a 'suitable teacher'? Plus test results in math, language, education and psychology
0.22 $289.61
Bingham (2000) Dissertation Teaching: elementary
N= 138 (U.S.A.)
Teacher Perceiver Interview (Gallup) Non-acad TAAS reading and math tests 0.03 $209.13
Buresh (2003) Dissertation Teaching: elementary
N= 851 (U.S.A.)
Teacher Perceiver Interview (Gallup) Non-acad Teacher evaluation scored by three experts who evaluated principal reports of summative teacher evaluations. 0–10 scale, plus absenteeism.
0.20 $209.13
Byrnes, Kiger, and Shechtman (2003)
Journal of Teacher Education
ITE: elementary N= 68 (U.S.A.) 1. Academic performance before selection. 2. Group assessment procedure to measure verbal abilities, interpersonal skills, and leadership qualities and overall impression. Rated by 2 trained assessors
Both Std teacher evaluation scores given by cooperating teacher and university supervisor measuring eight criteria. Inter-rater reliability was about .5–.6.
0.09 $26.21
Casebolt (2016) Dissertation Teaching: elementary and secondary
N= 271 (U.S.A.)
Teacher Selection Model online questionnaire
Academic TEAM efectiveness and observation scores
TVAAS value-added score
0.14 for student value-added 0.10 for observation
$69.89
Casey and Childs (2011)
Canadian Journal of Education
ITE: secondary/ math
N= 102 (Canada)
Undergrad GPA and written proile (e.g., 'describe three signiicant teaching-related experiences' and 'How might you contribute, etc.' scored by two reviewers on a 9-point scale
Both Post hoc scoring of reports of practice teaching on a 13-pt scale and 5 subscales of judgments of 'preparedness for teaching' by three raters, including student
0.30 $88.32 Caskey, Peterson, and Temple (2001) Teacher Education Quarterly
ITE N= 141 (U.S.A.)
Five selection measures: GPA, letters of recommendation to test interpersonal skills, personal statement, standardized test scores for basic skills, overall ile rating, performance on a group problem-solving activity
Both Scoring at end of program including instructor reports, supervisor reports, grades, and teaching observations. Participants were rated in quintiles.
0.20 $97.84
Chesley (2004) Dissertation Teaching: elementary and secondary
N= 578 (U.S.A.)
Urban TPI screener version (i.e., 2/5 questions from 11 themes) and Praxis 1 score
Both Teacher Performance Assessment system includes four teaching dimensions (e.g., 'designing knowledge work')
0.12 $164.87
Clemons (2010) Dissertation Teaching: elementary and secondary
N= 79 (U.S.A.) Ventures for Excellence interview tool: 22-question interview with 11 categories (2 points per response)
Non-acad Summative evaluations based on categories from the VFE tool and included teaching techniques, classroom management, interpersonal relationships, and professional responsibilities rated on a 1–5 scale
0.18 $131.18
Denner et al. (2009) Educ Asse Eval Acc ITE Academic 0.24 0
(continued on next page)
Table 1(continued)
Authors and date Source Selection level Sample size and location
Predictors (selection methods used) Type of predictor
Outcome measures Predictor -outcomes correlations
Est. cost per applicant
N= 452 (U.S.A.)
Praxis 1 scores in reading, writing, math (for entry into ITE), and admissions GPA
Renaissance Teacher Work Sample (TWS) scores which is evaluation of teaching with 8 standards in the 3rd and 4th year of ITE program
Evans (2016) Dissertation Teaching: elementary and middle
N= 76 (U.S.A.) Gallup TeacherInsight Non-acad Student (TGA) gain in math and reading
0.11 for student gain scores in reading; 0.10 for math
$53.07
Fry (2013) Dissertation Teaching: elementary and secondary
N= 452 (U.S.A.)
Gallup Teacher Insight (scored from 1 to 99)
Non-acad Teacher Growth Index, a value-added score
0.08 $53.07
Gimbert and Chesley (2009)
Journal of School Leadership
Teaching: elementary and secondary
N= 578 (U.S.A.)
UTPI Urban teacher perceiver interview screener and Academic Skills Assesssment from Praxis
Both (TPA) Teacher assessment scores based on four domains (e.g., creating a safe and orderly environment)
0.12 $164.87
Heinz (2013) Educ Asse Eval Acc ITE N= 1023 (Ireland)
Primary degree result and prior teaching experience
Academic Academic and teaching practice grades at end of PDE course
0.10 0
Henry et al. (2013) Journal of Teacher Education
ITE N= 279 (USA) Praxis 1 scores Non-acad Math and reading value-added 0.01 0
Juracek (2017) Dissertation Teaching: elementary
N= 56 (U.S.A.) Ventures Teacher Style Proile Builder (Form A Interview)
Non-acad Student reading achievement 0.11 in reading and 0.10 in math
$131.18
Koerner (2007) Dissertation Teaching: elementary and secondary
N= 132 (U.S.A.)
TeacherInsight scores (Gallup), plus gender, age, degree). This TI is focused on reducing staf time for interviews, and can be done electronically. Requires 40 min to complete online using Likert scales. and open-ended questions
Non-acad Texas Growth Index–an estimate of students' academic growth in reading, English and math (value-added)
0.21 $53.07
Kosnik, Brown, and Beck (2005)
The New Educator ITE: elementary and secondary
N= 347 (Canada)
GPA + written proile about 3 sustained teaching experiences which are graded by two raters
Both Practicum success and academic success, both derived from ratings by a supervisor/coordinator. Each of the two outcomes consisted of a set of criteria (e.g., classroom management) scored on a 1–4 scale.
0.14 $34.94
Kreifels (2003) Dissertation Teaching: elementary
N= 17 (U.S.A.) Gallup TPI three 'behavioral subscales': intrapersonal, interpersonal, extrapersonal
Non-acad Reading and math scores from state assessments plus Iowa test of basic skills
0.06 $125.29
Loyd (2004) Dissertation Teaching: elementary and middle school
N= 242 (U.S.A.)
Urban TPI Non-acad State scores in math, reading, or language
0.05 $203.30
McKinley (2009) Dissertation Teaching N= 107 (U.S.A.)
Score on 7 written application questions, score on 32 question online StyleProile, and score on 22-question interview
Non-acad Scores on a rating scale for 1st-year teachers completed by school principals. The outcome measure was based on the 22-question interview
0.20 $131.18
McWhirter (2014) Dissertation Teaching: elementary and secondary
N= 50 (U.S.A.) Teacher Selection Interview (Crown Global Consulting)
Non-acad Tennessee Education Acceleration Model (TEAM) rubric administered by principals, based on Charlotte Danielson work, and TVAAS change in std achievement test scores
0.07 Not available
(continued on next page)
Table 1(continued)
Authors and date Source Selection level Sample size and location
Predictors (selection methods used) Type of predictor
Outcome measures Predictor -outcomes correlations
Est. cost per applicant Mikitovics and Crehan (2002) Journal of Educational Research ITE: elementary and secondary
N=1434
(U.S.A.)
Pre-Professional Skills Test (PPST) (which I think is same as Praxis 1) plus ACT scores. The PPST is composed of 3 subtests assessing reading, writing and math.
Academic GPA and student teaching rating 0.15 0
Mills (2007) Dissertation Teaching: elementary
N= 116 (U.S.A.)
Ventures for excellence: 22 questions with 11 themes in 3 domains: purpose, human interaction, and teaching/ learning.
Non-acad MAP tests which measure 'class growth' in language, reading, math
0.32 $131.18
Nelson (2013) Dissertation Teaching: elementary and secondary
N= 90 (U.S.A.) Ventures for Excellence Teacher Style Proile: a 32 question web-based test measuring 13 themes: purpose, communicative, personable, compassionate, etc.
Non-acad 1. Teacher evaluation data in year one measuring instructional process, interpersonal relationships, and professional responsibilities on a 3-point scale. 2. Probationary teacher feedback scale scored by principals for purpose, human interaction, teaching/ learning, and overall efectiveness.
−0.05 $53.07
Novotny (2009) Dissertation Teaching: elementary and secondary
N= 527 (U.S.A.)
TeacherInsight scores. Web-based assessment multiple choice and Likert items requiring 30 min to complete. Produces a score from 0 to 100. Range was 43–89, with a mean of 66.4.
Non-acad PDAS completed by 'an administrator' with scores in 8 domains: e.g., learner-centered instruction, active student participation, professional communication.
0.07 $53.07
Oestreich (2016) Dissertation Teaching: elementary and secondary
N= 88 (U.S.A.) Applitrack TeacherFit screening assessment tool
Non-acad Teacher Performance Evaluation observation tool
0.14 Not available
Robison (2003) Dissertation Teaching: elementary
N= 14 (U.S.A.) Ventures for Excellence Non-acad Std growth in language, math, reading measured by NWEA RIT growth score
−0.32 $131.18
Ross (2013) Dissertation Teaching: elementary and secondary
N= 37 (U.S.A.) Ventures for Excellence interview tool: 22-question interview with 11 categories (2 points per response)
Non-acad Std achievement using the Ohio achievement test scores in math and reading
−0.17 $131.18
Sawyer (2005) Dissertation Teaching N= 33 (U.S.A.) Haberman Star Teacher Interview Non-acad Principal rating during irst year using seven categories
−0.05 $131.53
Winters (2017) Dissertation Teaching: elementary and middle
N= 69 (U.S.A.) Ventures for Excellence B-22 Non-acad Staf Evaluation Instrument (based on observation)
0.11 $53.07
Young and Delli (2002)
Educational Administration Quarterly
Teaching N= 196 (U.S.A.)
Teacher Perceiver Interview (Gallup) Non-acad Principal ratings of teachers using TPI domains (e.g., empathy, listening, etc.) using a rating system designed for this study, plus work attendance/ absenteeism
0.04 $209.13
Note.‘std’ = ‘student’; ‘non-acad’ = ‘non-academic’.
interpretations of the practical value of efect sizes in education are luid: Valentine and colleagues (Valentine, DuBois, & Cooper, 2004) considered an efect size of r = 0.08 between students' self-beliefs and subsequent achievement as a ‘‘small but noteworthy inding’’ (p. 127), andCoe (2002)proposed that an efect size of d = 0.10 (roughly r = 0.05) can result in important educational outcomes if the efect can be applies to all students (i.e., as in an efect involving teachers) and is cumulative over time.
3. Results
3.1. Description of studies
A summary of all of the included studies (reporting authors and date, education level, sample size and location, selection methods used, type of predictor, outcome measure used, predictor-outcome correlation, and cost per applicant for selection) is reported in Table 1. The majority of the studies (66% or 21/32) were PhD dissertations, with 34% (11/32) published in academic journals. Most of the studies—88%—were conducted in the United States (28/32), with the remaining studies conducted in Canada (2), Ireland (1), and Switzerland (1). The majority of the studies (72% or 23/32) investigated the relation between selection practices at the point of hiring and subsequent teaching efectiveness, and 28% (9/32) of the studies examined the relation between selection into teacher education and teaching efectiveness during the ITE program. Sample sizes ranged from 14 to 1434,M= 274.69,SD= 326.01.
We divided selection methods into three categories:academic(e.g., measures of academic achievement such as secondary school or university GPA, scores on academic tests such as Praxis I Math tests),non-academic(measures of beliefs, attitudes, personality, or motivation such as Gallup Teacher Perceiver Interview), andboth(selection methods including both academic and non-academic measures). Most of the studies reported non-academic measures (23 or 72%), followed by both academic and non-academic (6 or 19%), and academic measures only (3 studies, or 9%). Selection measures included a range of commercial selection tests (e.g., Gallup TeacherInsight, Gallup Teacher Perceiver Interview, Ventures for Excellence, Teacher Selection Interview) and non-commercial methods (e.g., assessment center methods, letters of recommendation, personal statements).
3.2. Effect sizes
[image:12.544.95.486.355.656.2]There were 32 studies included in the meta-analysis with an overall efect size of r= 0.12 (df= 31, p< .001), and a 95%
Fig. 4.Synthesis forest plot for all included studies. Bracketed lines with blue circles indicate 95% conidence interval for each study and the bracketed line with a green circle indicate the overall 95% conidence interval and the overall efect size. (For interpretation of the references to colour in this igure legend, the reader is referred to the Web version of this article.)
R.M. Klassen, L.E. Kim Educational Research Review 26 (2019) 32–51
conidence interval ranging from 0.10 to 0.15. A synthesis of individual studies with its weighted point estimates is displayed in Fig. 4.
We used two measures of heterogeneity:Q-statistic(or Cochrane's Q) with itsp-value, andI2.TheQ-statistic was signiicant,Q
(31) = 55.45,p< .001, indicating that there are signiicantly diferent efect sizes across studies. Furthermore, I2was 44.09%
indicating that there was ‘low-to-moderate’ variability across the studies (using the descriptor provided byHiggins, Thompson, Deeks, & Altman, 2003), hence indicating the suitability of moderator analyses (Borenstein, Hedges, Higgins, & Rothstein, 2009). Heterogeneity statistics are reported inTable 2.
[image:13.544.44.504.76.274.2]Three indicators were used to assess publication bias in the estimates using a ixed estimates model. First, the relatively sym-metrical spread of the estimates in the funnel plot (Fig. 5) indicates that there may not be a publication bias. Second, the signiicant Egger's regression test (Egger, Davey, Schneider, & Minder, 1997) with an intercept estimate of −0.10 (95% CI: −0.96, 0.77) is another indicator that there may not be a publication bias. Finally,Rosenthal's (1979)fail-safeNtests indicate that a large number of studies (i.e., 963 studies) with non-signiicant results would be needed to make the association non-signiicant, which again indicates that there may not be a publication bias.
Table 2
Sub-Group Analysis: Number of Efect Sizes, Mean r, 95% Conidence Intervals, and Heterogeneity Indicators.
Variable k r 95% CI (LL, UL) Q pQ I2(%)
Overall teacher efectiveness 32 .12 (.10, .15) 55.45 .00 44.09 Moderator analysis
Selection method type 37 .11 (.08,.14) 68.33 .00 47.31
Academic 15 .13 (.07, .19) 35.61 .00 60.68
Non-academic 22 .10 (.07, .13) 24.32 .28 13.65 Teacher efectiveness measure 37 .12 (.08, .16) 74.71 .00 51.81 Performance evaluation 20 .13 (.09, .17) 21.47 .31 11.52 Student Academic Achievement 12 .08 (-.01, .17) 41.51 .00 73.50 Teacher Academic Achievement 3 .13 (.06, .19) 0.96 .62 .00 Absenteeism 2 .09 (-1.00, 1.00) 9.65 .00 89.64 Educational level 35 .12 (.11, .13) 130.79 .00 74.00 Elementary 10 .12 (-.03, .26) 85.35 .00 89.46
Secondary 5 .07 (-.14, .29) 16.63 .00 75.94
Mixed 20 .12 (.10, .15) 10.91 .93 0.00
Selection type 32 .12 (.10, .15) 55.86 .00 44.50
ITE 9 .14 (.08, .20) 12.09 .15 33.85
Employment 23 .11 (.07, .15) 42.73 .01 48.52
Output type 32 .12 (.10, .15) 55.86 .00 44.50
Journal 11 .13 (.09, .18) 50.14 .22 23.44
Dissertation 21 .11 (.06, .15) 42.15 .00 52.55
[image:13.544.63.481.467.674.2]Note. k= number of efect sizes, 95% CI (LL, UL) = 95% Conidence Interval (Lower Limit, Upper Limit),Q=Q-Statistic,pQ=p-value for theQ -statistic.
Fig. 5.Funnel plot with estimates from the included studies with standard error in the y axis and efect size on the x axis.
R.M. Klassen, L.E. Kim Educational Research Review 26 (2019) 32–51
3.2.1. Variation in effect sizes
As can be seen in the synthesis forest plot (Fig. 4), 28 studies showed positive efect sizes and 4 showed negative efect sizes. Ten studies reported signiicant indings, all positive. The range of efect sizes and statistical signiicance is likely due to multiple factors: restricted variance in the independent and dependent variables, uncertain reliability and validity of the measures used, and low sample sizes. The ten studies that showed signiicantly positive efect sizes comprised studies with academic predictors (n= 3), non-academic predictors (n= 3), and combined academic and non-academic predictors (n= 4). In contrast to the publication source reported for the 32 studies in the overall meta-analysis, where 66% of the studies were dissertations, the majority (70%) of the studies with signiicant positive efect sizes were journal publications.
Four studies had negative efect sizes.Robison (2003)examined the diferences in student academic growth for teachers who, on the Venture for Excellence interview (VFE), scored high (14 or above) and low (12 or below). However, the distribution and the range of scores within the high and low scoring groups was not provided. Given the small sample size (14 participants), the distribution of the VFE scores may be small within each group. Furthermore, the mean diferences in the student academic growth scores were small (e.g., 0.46 and 2.99), with large standard errors (1.68 and 1.06).Ross (2013)examined the correlation between interview scores and student academic achievement. The range of dispositional interview scores was small (12–22) as were the student academic achievement scores (e.g., 380 to 450). With the small sample size of 7–15 participants, the uneven spread of the scores may have skewed the results. Given the wide range of studies reported in the meta-analysis, especially in terms of sample size, evidence of validity and reliability, and scoring range, one must be cautious when interpreting individual studies within the meta-analysis.
3.3. Moderator analyses
Moderator analyses were conducted to further examine the relation between teacher selection measures and teacher efectiveness measures. To start, we tested for publication bias by testing any diferences in efect size by publication category (i.e., journal articles or dissertations). The four main analyses examined: (a) type of predictor (academic or non-academic), (b) type of teacher efec-tiveness measure, (c) teaching level (elementary or secondary), and (d) selection type (for employment or for entry into ITE pro-gram).
To compute the overall efect size for each moderator analysis, individual Pearsonrs were transformed into Fisher'szscores, which were then averaged within each study by the type of moderator analysis category. Fisher'szscores were averaged because including multiple efect sizes from the same study would violate the assumptions of independence (Lipsey & Wilson, 2001). For example, in a moderator analysis separated by type of predictor, a study containing three efect sizes for academic predictors and two efect sizes for non-academic, the predictors were averaged such that there was only one efect size for the academic predictor type and one correlation for non-academic predictor. The average Fisher'sz scores were then transformed back to Pearsonrs. These transformed Pearsonrs were then used to calculate the inal efect sizes for the meta-analysis.2Table 2contains the type of moderator
analysis conducted with the corresponding number of efect sizes (k), the actual efect sizes, and the 95% lower and upper conidence intervals.
3.3.1. Moderation by publication category (k = 32)
The associations between the predictors and outcomes were signiicant when the results were published in journals (r= 0.13, df= 10,p< .05), and in dissertations (r= 0.11,df= 20,p< .05), and there were no signiicant diferences in the strength of the associations,Qb(1) = 0.64,p= ns.
3.3.2. Moderation by type of predictor (k = 37)
The associations with the outcomes were signiicant for both academic (r= 0.13,df= 14,p< .05) and non-academic predictors (r= 0.10,df= 21,p< .05), and the two associations were signiicantly diferent from each other,Qb(1) = 8.40,p< .05.
3.3.3. Moderation by type of teacher effectiveness measure (k = 37)
The predictors were signiicantly associated with performance evaluations (r= 0.13,df= 19,p< .05) and practicum ratings, (r= 0.13, df= 2, p< .05), but not with student academic performance (r= 0.08,df= 11, p=ns), or absenteeism (r= 0.09, p=ns). The four categories did not difer signiicantly from each other,Qb(3) = 1.11,p> .05.
3.3.4. Moderation by selection purpose (k = 32)
The associations between the predictors and outcomes were signiicant both when used for the purposes of selection for em-ployment (r= 0.11,df= 22,p< .05), and for ITE admissions (r= 0.14,df= 8,p< .05), with no signiicant diference in the strength of the associations,Qb(1) = 1.03,p= ns.
3.3.5. Moderation by educational level (k = 35)
The associations between the predictors and outcomes were only signiicant when at mixed primary and secondary levels (r= 0.12,df= 19,p< .05), and not when they were examined at each educational level. Again, there were signiicant diferences in
2An alternative method to not violate the assumption of independence would be to use robust variance estimation in the calculation (Sidik &
Jonkman, 2006).
R.M. Klassen, L.E. Kim Educational Research Review 26 (2019) 32–51
the associations between the categories,Qb(2) = 17.91,p< .05.
3.4. Cost of selection methods
The mean cost of selection methods for the receiving institution or school district was US $104.32 per candidate, with a low of $0 in four studies where existing data such as secondary school or university grades were used for selection (Heinz, 2013;Henry et al., 2013), or where required assessments were used with costs borne by the candidates (e.g.,Denner, Norman, & Lin, 2009). The highest costs (e.g., $289.61, $209.13) were calculated for assessment centers requiring multiple assessors (e.g.,Bieri & Schuler, 2011) and selection methods that required initial training costs (e.g., $2500 for the TPI inBingham, 2000) in addition to time required for interviews. Cost estimates should be interpreted cautiously: the annual costs for selection methods involving initial training costs would decrease over time, and the number of personnel used for selection likely varies across sites.Fig. 6shows the bivariate relations between the validity and cost of selection methods for the 32 studies in the review. The overall correlation between predictive validity and cost of implementation of selection method was negative but non-signiicant, (r= −0.12,p= ns).
3.5. Fairness and bias
Some selection methods have been shown to be prone to inter-group diferences, and may inadvertently favor some groups (race, gender, SES) over others (Shultz & Zedeck, 2012). We searched the 32 articles for any discussion of inter-group diferences or potential bias in results.Fry (2013)discussed the higher Teacher Insight scores of male math teachers; Loyd (2004)noted no signiicant diferences for race in scores on the Urban Teacher Perceiver Interview;McKinley (2009)noted gender diferences on scores on the Ventures for Excellence screening tool; andMikitovics and Crehan (2002)noted that the “supply of minority teacher candidates appears to be negatively afected by the use of the Pre-Professional Skills Test as a screening device” (p. 221). No other studies addressed fairness and potential biases of selection methods.
4. Discussion
[image:15.544.45.497.56.336.2]The purpose of this article was to review research on teacher and prospective teacher selection methods, to evaluate the predictive validity of these methods, and to consider a model for teacher selection that relects research and theoretical work conducted in and outside of education. Our indings conirm that selection methods assessing academic and non-academic constructs are statistically associated with teacher efectiveness measures, although the efect sizes were small. The efect size for non-academic predictors (r= 0.10) was signiicantly smaller than for academic predictors (r= 0.14), relecting the particular challenge of reliably and validly
Fig. 6.Correlation between validity and cost of selection method.
R.M. Klassen, L.E. Kim Educational Research Review 26 (2019) 32–51
evaluating non-academic attributes in high-stakes settings (e.g.,Sackett et al., 2017). Methods for selection into employment and ITE both signiicantly predicted subsequent teacher efectiveness, but again, the efect sizes were small. There was little indication of publication bias, with signiicant selection method/efectiveness associations in journal articles and in unpublished dissertations, and with publication bias indices (e.g., Egger's regression test) suggesting against publication bias.
The relative weakness of predictive validity in comparison with other disciplines raises questions about methods used for selection in education. The indings showed that the best (single) estimate of the relation between teacher selection methods and teacher efectiveness isr= 0.12 (considered asmallefect size according toHattie, 2009), with both academic and non-academic predictors showing signiicant but small efect sizes. Of the 32 studies, 28 studies showed a positive relation between selection method and teacher efectiveness, but only 10 studies had overall efect sizes that were signiicantly diferent from 0.
The predictive validities of selection methods in this review are generally lower than those found in research in other ields. The discrepancy in predictive validity between education and other ields may be due to the fact that teaching is uniquely complex compared to other professions, and thus more diicult to predict, or it may be that education has beneited less from the extensive research and development that has characterized other ields (e.g.,Ryan & Ployhart, 2014;Schmidt & Hunter, 1998). Teaching is undoubtedly multi-faceted and complex, butHarris and Rutledge (2010)point out that numerous professions ofer similar levels of complexity.
In addition, we found a weaker relation between predictors and teaching outcomes than did Metzger & Wu in their 2008 review of the TPI, where they reported a mean correlation ofr= 0.28 between the TPI and teacher efectiveness. There are several explanations for this discrepancy. First, Metzger and Wu's studies consisted largely of dissertations and test publisher reports, with only 2 of 24 studies coming from peer-reviewed journals. We chose not to include non-peer reviewed data from test publishers, but our com-parison of data sources showed a signiicant (but modest) diference in efect size favoring dissertations over journal articles. Second, in half of the studies in the Metzger and Wu article, the TPI was administered after hiring; that is, it was not used for high-stakes selection. The correlation between the TPI administered in a low-stakes research setting (r= 0.35) was signiicantly higher than when used for actual selection (r= 0.21). Third, Metzger and Wu studies were pre-2000 and ours were post-2000, and it could be argued that teaching is becoming increasingly complex, and increasingly diicult to capture as an outcome.
Another factor to consider when examining the correlation between teacher selection and teacher efectiveness is the quality (reliability and validity) of the measures of teacher efectiveness. In our meta-analysis, most of the outcome measures consisted of teaching observation ratings completed by a principal or supervisor using a wide range of scoring protocols, but with little evidence supporting their reliability and validity. Our results showed a signiicant relationship between selection methods and performance evaluations, but not for student academic performance or for student teachers’ practicum ratings. The need for developing improved measures of teacher efectiveness has been the focus of recent funding initiatives, but the challenges remain considerable (e.g.,van der Lans et al., 2018). Finding and adopting valid methods of measuring teacher efectiveness presents a real challenge for practi-tioners (e.g.,Patrick & Mantzicopoulos, 2016;Strong, Gargani, & Hacifazlioglu, 2011). Recent eforts to improve teacher evaluation systems (e.g.,Gill et al., 2016) have led to more robust measures such as the Classroom Assessment Scoring System (CLASS;Hamre et al., 2013) and the International Comparative Analysis of Learning and Teaching (ICALT;van der Lans et al., 2018), but the studies included in this review did not use these more recent, evidence-supported observation methods. Using less reliable and valid outcome measures weakens the correlation between predictor and criterion.
A key question when assessing predictive validity is the practical value of the efect sizes found in the studies: do current selection methods make a diference in educational outcomes?Ferguson (2009)lays out a lower limit ofr= 0.20 for practical signiicance in social science research, a standard echoed byHedges and Hedberg (2007)vis-à-vis educational research when objective measures of outcomes are used. However, teacher selection methods are often applied to large numbers of applicants, andCoe (2002)points out that small efect sizes can make a big diference to educational outcomes if the efect is applied to a large sample.
4.1. Selecting teachers and prospective teachers
For selection into training or employment, selection methods are most likely to be useful when the number of predictions is large and when efects are additive; for example, small but signiicant efect sizes for academic and non-academic selection methods provide added value—incremental validity—over and above the efects shown by the use of only one type of predictor. In medicine, for example, tests of non-academic attributes explain a signiicant amount of explained variance over and above academic tests (e.g., Patterson et al., 2016). Although there is not much predictive gain for any particular selection method for a speciic selection decision, small gains in predictive accuracy lead to important improvements at the organizational level (Morgesen et al., 2007). The evidence from the current review suggests that academic and non-academic selection methods both show potential for contributing to selection accuracy for employment and ITE programs, but that further attention to research and development is needed, especially to develop reliable and valid non-academic selection methods.
4.1.1. Selection into employment and ITE programs
The methods for selection into employment (r = 0.11) and into ITE programs (r = 0.14) were signiicantly related with teacher efectiveness outcomes. Many of the attributes relevant for selecting teachers for employment are qualitatively similar to the attri-butes relevant for selection into ITE programs, because key personal characteristics are relatively stable over time [Steyer et al., 1999]), notwithstanding the importance of developmental interactions with contextual factors such as learning opportunities and teaching experience as laid out in Kunter's COACTIVE model.Lievens and Sackett (2012)inding that the attributes measured at admission into professional training are predictive of professional competence up to nine years later supports the notion that personal
R.M. Klassen, L.E. Kim Educational Research Review 26 (2019) 32–51