175 © The Author(s) 2019
M. R. Marselle et al. (eds.), Biodiversity and Health in the Face of Climate Change, https://doi.org/10.1007/978-3-030-02318-8_9
Chapter 9
Review of the Mental Health
and Well- being Benefits of Biodiversity
Melissa R. Marselle, Dörte Martens, Martin Dallimer, and Katherine N. Irvine
Abstract Little is known about the contribution that biodiversity has on mental health and well-being. To date, only one systematic review has investigated the health and well-being benefits from contact with biodiversity (Lovell et al. J Toxicol Environ Health B Crit Rev 17(1):1–20, 2014). The number of research studies investigating the health and well-being effects of biodiversity has increased since this publication. Here, we provide an update, focusing on the impact of biodiversity on mental health and well-being. Our objectives are to: (i) identify and describe the literature published after 2012; and (ii) synthesise all results from Lovell et al. (J Toxicol Environ Health B Crit Rev 17(1):1–20, 2014) and the more recently pub-lished literature to assess whether biodiversity influences mental health and well- being. Sixteen recently published studies met the inclusion criteria. The literature is varied with different study designs, measures of biodiversity, mental health and well-being. The synthesis of results was drawn from 24 studies: nine from Lovell et al. (J Toxicol Environ Health B Crit Rev 17(1):1–20, 2014) and 15 identified by this chapter. There is some evidence to suggest that biodiversity promotes better
M. R. Marselle (*)
Department of Ecosystem Services, Helmholtz Centre for Environmental Research – UFZ, Leipzig, Germany
German Centre for Integrative Biodiversity Research (iDiv) Halle-Jena-Leipzig, Leipzig, Germany
e-mail: melissa.marselle@ufz.de
D. Martens
Eberswalde University for Sustainable Development, Eberswalde, Germany e-mail: d.martens@hnee.de
M. Dallimer
Sustainability Research Institute, School of Earth and Environment, University of Leeds, Leeds, UK
e-mail: m.dallimer@leeds.ac.uk
K. N. Irvine
Social, Economic and Geographical Sciences Research Group, The James Hutton Institute, Aberdeen, Scotland, UK
176
mental health and well-being. However, more studies reported non-significant results. The evidence is not yet of the extent necessary to characterise the role of biodiversity in relation to mental health or well-being. Future interdisciplinary research directions are discussed.
Keywords Mental health · Mental well-being · Biodiversity · Species richness · Synthesis · Review
Highlights
• Research into the health and well-being effects of biodiversity has grown since Lovell et al. (2014).
• We update Lovell et al. (2014) and focus on the impact of biodiversity on mental health and well-being.
• 16 recently published studies on biodiversity and mental health and well-being were identified.
• Synthesis of results found some evidence that biodiversity promotes better men-tal health and well-being.
• Overall, more studies reported non-significant effects.
9.1 Introduction
Contact with natural environments facilitates diverse health and well-being benefits (Bowler et al. 2010; Frumkin 2001; Hartig et al. 2014; Irvine and Warber 2002; Keniger et al. 2013). However, in this body of research the natural environment is often “treated as uniform” (Dallimer et al. 2012, p. 48), as studies commonly com-pare broad urban and natural environment categories (e.g. Hartig et al. 2003; Korpela et al. 2016) or analyse the amount of, or proximity to, green space (e.g. Groenewegen et al. 2012; Triguero-Mas et al. 2015). Whilst a substantial amount of literature investigates the impact of nature or green space on health and well-being, little is known about the contribution that different qualities of the natu-ral environment, such as biodiversity, have on mental health and well-being.
Systematic reviews of the mental health or well-being benefits from contact with nature do not include studies that assess the biodiversity of the natural environment (e.g. Bowler et al. 2010; Dadvand et al. 2015; Thompson Coon et al. 2011). This same body of literature on the mental health or well-being effects of nature is also present in systematic reviews of the health benefits of biodiversity (e.g. Horwitz and Kretsch 2015; Hough 2014; Whitmee et al. 2015), resulting in a closed loop of examined literature. To date, only one systematic review has explicitly investigated the health and well-being benefits from contact with biodiversity (Lovell et al.
2014). While the authors found some evidence for a positive benefit from exposure to biodiversity, overall, the synthesis of 15 quantitative studies showed no clear pat-tern of results for the effects of biodiversity on human health and well-being.
177
Since the publication of Lovell et al. (2014), interest has grown in the potential contribution of biodiverse environments for health and well-being. Growth in this field is shown clearly by the increase in the number of related scientific publica-tions. For example, a search in the Web of Science on just one term, ‘biodiversity and health’, yielded 0 hits for 1980–1989, 3 hits for 1990–1999, 2 hits for 2000– 2009, 6 hits for 2010–2013, and 16 hits from 2014–2018. This coincides with increased interest from governments and international organisations on the men-tal health and well-being effects of biodiversity (Convention on Biological Diversity 2017a, b; EKLIPSE 2017; WBGU – German Advisory Council on Global Change 2016; World Health Organisation & Secretariat of the Convention on Biological Diversity 2015). Given this research expansion and increased interest, in this chapter we update the literature reviewed by Lovell et al. (2014). In particular, we focus on the relationships between biodiversity and mental health and mental well-being, as such an analysis has yet to be conducted. Box
9.1 details these definitions.
The aim of this chapter is to identify, summarise and synthesise research on the impact of biodiversity on mental health and well-being. There are two objectives: 1. Describe the state and nature of the body of evidence, published since the review
by Lovell et al. (2014), relating biodiversity to mental health and well-being; 2. Provide a synthesis of results from Lovell et al. (2014) and the more recently
published literature to assess whether biodiversity influences mental health and well-being.
Box 9.1: Definitions of Biodiversity, Health, Mental Health and Mental Well-being
• Biodiversity is “the variability among living organisms from all sources including, inter alia, terrestrial, marine and other aquatic ecosystems and the ecological complexes of which they are part; this includes diversity within species, between species and of ecosystems” (United Nations Convention on Biological Diversity 1992, p. 3).
• Health is “a state of complete physical, mental and social well-being and not merely the absence of disease or infirmity” (World Health Organization
1946).
• Mental health “a state of well-being in which an individual realises his or her own abilities, can cope with the normal stresses of life, can work pro-ductively and is able to make a contribution to his or her community” (World Health Organization 2016).
• Mental well-being is “the psychological, cognitive and emotional quality of a person’s life. This includes the thoughts and feelings that individuals have about the state of their life, and a person’s experience of happiness” (Linton et al. 2016, p. 12).
178
9.2 Methods
9.2.1 Literature Review
A systematic search strategy was used to identify published, peer-reviewed studies that specifically examined relationships between biodiversity and mental health or mental well-being outcomes. The literature search was conducted in October 2017, following a replicable procedure (Koricheva et al. 2013). Inclusion criteria (Box 9.2) was identical to those used by Lovell et al. (2014), except with a focus on literature published (i) between 2013 and September 2017, and (ii) in any language. Thus, we are building on, rather than replicating, the review by Lovell et al. (2014).
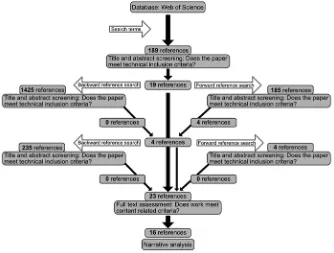
Literature was identified through structured searches of the Web of Science, which identified 189 articles (see the Appendix for the search terms). One reviewer [MM] initially screened titles and abstracts, with a second reviewer [DM] applying the inclusion criteria to articles that needed a second opinion. Nineteen articles were identified as eligible for full text review (see Fig. 9.1). Backward and forward refer-ence searches (Cǒté et al. 2013) were conducted on these 19 articles. The resulting 1610 articles were first screened by year and title for eligibility, then abstracts were read. This method identified an additional four articles, all from forward citations. Backward and forward reference searches of these four articles resulted in an addi-tional 242 references, which underwent a similar screening process. No new articles were identified. Twenty-three articles underwent full text screening (by MM and
Box 9.2: Study Inclusion Criteria (Adapted from Lovell et al. 2014)
1. Any peer-reviewed study, published between January 2013 and September 2017
2. Any recognised and reliable study design, with any population group, from any country and in any language
3. An explicit consideration of biodiversity, species richness and/or a setting protected because of its biodiversity, and
4. An explicit consideration of either a primary health-related outcome including any self-reported or objective measure of mental health or men-tal well-being, or a secondary health-related outcome including self-report or objective measures of physical activity or self-report social cohesion.
Exclusion criteria: Studies were excluded if they did not assess (i) biodi-versity and (ii) mental health, mental well-being, physical activity and social cohesion related outcome measures. Studies assessing preferences, physio-logical outcomes, use/visitation, the amount of green space without specifica-tion of its biodiversity, or physical activity without identificaspecifica-tion of where it occurred were excluded. Studies not reporting primary research (e.g. review papers) were also excluded.
179
DM); seven were excluded primarily because they did not assess biodiversity, mental health, mental well-being, physical activity or social cohesion. In total, 16 articles were identified (see Table 9.1).
9.2.2 Characteristics of the Recent Literature
To describe the recently published literature on biodiversity and mental health and well-being, a standardised data extraction form was used to record relevant informa-tion from the 16 studies: country of origin, participants, theoretical posiinforma-tion, biodi-versity indicators, outcome measures, contact with biodiverse environment, moderators, mediators and results.
[image:5.439.53.387.62.315.2]Biodiversity indicators were classified on the basis of biodiversity levels identi-fied by Botzat et al. (2016) – namely, ecosystems/habitats (e.g. parks, forests); spe-cies communities (e.g. plants, birds, butterflies); or single spespe-cies. Within the spespe-cies community level, both species richness (e.g. the number of different bird species) and abundance of a specific taxonomic group irrespective of species (e.g. the num-ber of all birds) were identified. Both variables have been shown to have differential effects (Hedblom et al. 2017). Abundance may be more important to mental health or mental well-being than the number of different species (Dallimer et al. 2012).
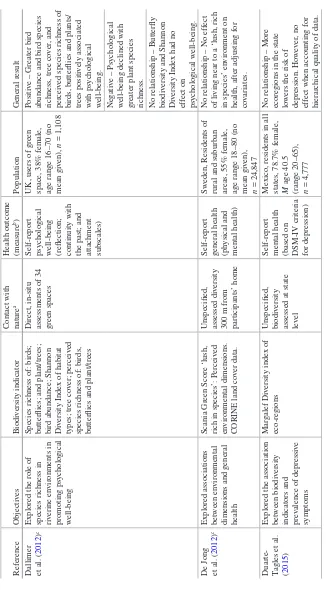
Table 9.1
Study characteristics of the 24 studies assessing biodi
versity and mental health and well-being (9 studies identified from 1980 to 2012 (Lo
vell et al.
2014
)
and 16 studies identified from 2013 to September 2017 in this chapter) Reference
Objecti
ves
Biodi
versity indicator
Contact with nature
a
Health outcome (measure
b)
Population
General result
Experimental studies Jor
gensen
et al. (
2010
)
c
Explored the impact of comple
xity of the
en
vironment on
psychological restoration
Naturalness, biodi
versity and
structural comple
xity of 3
green spaces
Indirect, vie
wing
videos
Self-report mood (Profile of Mood States) UK, students from a single uni
versity , 47% female, M age = 22 (range 17–40), n = 102
No relationship – No difference in mood between 3 green spaces.
W
olf et al.
(
2017
)
Explored the impact of species richness on mental health and well-being Study 1: tree species richness (high, lo
w)
Indirect, vie
wing
videos
Self-report positi
ve af
fect
(P
AN
AS);
vitality (Subjecti
ve
V
itality Scale);
and anxiety (State T
rait
Anxiety Inventory) Study 1: USA, 42% female,
M
age = 36
(range 18 and o
ver), n = 140 Study 1: Positi ve – Reduced le
vels of anxiety in high tree
species richness condition compared to lo
w condition.
Mar
ginal dif
ference between
conditions on positi
ve af
fect.
Study 1: No relationship – No dif
ference between high
and lo
w tree species richness
conditions on vitality
.
Study 2: bird species richness (high, lo
w)
Study 2: USA, 52% female,
M age = 35 (range 18 and o ver), n = 264
Study 2: Positi
ve –
Enhanced le
vels of positi
ve
af
fect, and reduced anxiety
in high bird species richness condition compared to lo
w
condition. Study 2: No relationship – No dif
ference between high
and lo
w bird species richness
conditions on vitality
Reference
Objecti
ves
Biodi
versity indicator
Contact with nature
a
Health outcome (measure
b)
Population
General result
Quasi-e
xperimental studies
Cracknell et al. (
2017
),
Study 2 only
Explored the ef
fect of
biodi
versity of aquarium
exhibit on af
fect
Species richness of marine fauna (high, lo
w); ab
undance
(high, lo
w) of fish/
crustaceans
Indirect, vie
wing
photographs
Self-report happiness UK, students from a single uni
versity
,
67.5% female,
M
age = 20.8 (range 18–35),
n
= 40
Positi
ve – Higher le
vels of
happiness in high abundance, compared to lo
w
ab
undance condition, when
species richness held constant. No relationship – No difference in high or lo
w
species richness conditions on happiness, when abundance is held constant.
Johansson et al. (
2014 ) Explored ef fect of dif ferent le vels of biodi
versity in forest
biotopes on af
fect
Cate
gorised 3 broad-leaf
forest biotopes based on vegetation layer
, species
composition and v
egetation
type (high, medium, lo
w)
Indirect, vie
wing
photographs
Self-report affect (Basic Emotional Process)
Sweden, staf
f from a
single uni
versity and
their f
amily and
friends, 51% female, M age = 46;
n = 35 Positi ve – Af fect w as
greatest in the medium biotope, follo
wed by the
high and then the lo
w
biotopes.
White et al. (2017
),
Study A
only
Explored the ef
fect of
percei
ved biodi
versity
on mental well-being
Percei ved biodi versity (high, medium, lo w) Indirect, vie wing photographs
Self-report mood (v
alence,
Feelings Scale); arousal (Felt Arousal Scale), and reco
very
UK, 51% female, age range 18–80 (no mean gi
ven)
n
= 1,478
Positi
ve – Greater percei
ved
biodi
versity associated with
increase in positi
ve v
alence,
arousal and reco
very
.
Natur
al e
xperiment
Cracknell et al. (
2016
),
Study 2 only
Explored the ef
fect of
restocking an aquarium with marine biota on affect Species richness of fish/ crustaceans (lo
w
, high)
Indirect, vie
wing
nature in an aquarium Self-report mood (v
alence,
Feeling Scale; and arousal (Felt Arousal Scale) UK, students from a single uni
versity , 76% female, M age = 24, n = 84
No relationship – No difference in mood between low and high biodi
versity
conditions.
Table 9.1 (continued) Reference Objecti ves Biodi versity indicator
Contact with nature
a
Health outcome (measure
b) Population General result Jones ( 2017 )
Explored the impact of an in
vasi
ve species on
mental health and well-being
Presence of the in
vasi
ve
species Emerald ash borer (EAB) (
Agrilus planipennis
),
which is responsible for the loss of North
American ash
trees (
F
raxinus
spp.)
Unspecified, assessments of EAB infestations in US counties Self-report depression (single item from PHQ-12) and life satisf
action
USA, people who li
ve
in 189 counties with detected EAB infestations in 15 states, 61% female,
M age = 53, n = 481,405 Positi ve – Biodi versity loss
of ash trees, 5-years after EAB detection, associated with less life satisf
action and
more depressi
ve symptoms.
Longitudinal (cohort) studies Annerstedt et al. (
2012
)
c
Explored the impact of the presence of environmental qualities on mental health o
ver a
5-year period
Scania Green Score ‘lush, rich in species’: Percei
ved
en
vironmental dimensions
identified using CORINE land co
ver data.
Unspecified, assessed di
versity
300 m from participants’ home Self-report mental health (GHQ-12) Sweden, Residents of rural and sub
urban
areas who did not mo
ve house, gender %
not gi ven, M age w omen = 50, n = 7,549
No relationship – No ef
fect
of li
ving in an en
vironment
that is ‘rich in species’ on mental health.
Annerstedt van den Bosch et al. (2015
)
Explored if changes in neighbourhood nature, as an ef
fect of mo
ving
home, are related to mental health Scania Green Score ‘lush, rich in species’: Percei
ved
en
vironmental dimensions
identified using CORINE land co
ver data.
Unspecified, assessed di
versity
300 m from participants’ home Self-report mental health (GHQ-12) Sweden, Residents of rural and sub
urban
areas who mo
ved
house, 58% female,
M
age = 48,
n
= 1,419
No relationship – Mo
ving to
an en
vironment that is more
‘rich in species’ had no effect on mental health.
Repeated measur
es studies
Marselle et al. (
2016
)
Explored indirect ef
fect of percei ved biodi versity on af fect through percei ved restorati veness Percei
ved species richness
of: plants/trees; birds; and butterflies
Direct, w
alks
outdoors
Self-report affect (P
AN
AS)
and happiness
UK, English residents who participate in group w
alks, 55%
female, age range 55 and o
ver (no mean
gi ven), n = 127 Positi ve – Percei ved bird biodi versity indirectly influences af fect and
happiness via percei
ved
restorati
veness.
No relationship – No indirect ef
fect of percei
ved
plants/trees and b
utterflies
species richness on af
fect or
happiness via percei
ved
restorati
Reference
Objecti
ves
Biodi
versity indicator
Contact with nature
a
Health outcome (measure
b)
Population
General result
Marselle et al. (
2015
)
Explored the direct effect of percei
ved
biodi
versity on af
fect
Percei
ved species richness
of: plants/trees; birds; and butterflies
Direct, w
alks
outdoors
Self-report affect (P
AN
AS)
and happiness
UK, English residents who participate in group w
alks, 55%
female, age range 55 and o
ver (no mean
gi
ven),
n
= 127
No relationship – No association of percei
ved
biodi
versity on positi
ve
af
fect or happiness.
Ne
gati
ve – Small increase in
percei
ved bird species
richness w
as related to more
ne
gati
ve emotions.
Cr
oss-sectional studies
Bjork et al. (2008
)
c
Explored the impact of the presence of preferred environmental dimensions in promoting health and well-being Scania Green Score ‘lush, rich in species’: Percei
ved
en
vironmental dimensions
identified using CORINE land co
ver data.
Unspecified, assessed di
versity
100 and 300 m from participants’ home Self-report physical and psychological health; and vitality (SF36) Sweden, Residents of rural and sub
urban
areas, 54% female,
M
age 50 (range 19–76), n = 24,819
No relationship – No ef
fect
of li
ving near to a ‘lush, rich
in species’ en
vironment on
health or vitality
.
Carrus et al. (2015
)
Explored the direct effect of le
vel of
biodi
versity on ph
ysical
and mental well-being, and indirect ef
fect through percei ved restorati veness Cate
gorised 4 green spaces
based on structural comple
xity (lo
w
, high)
Direct, in-situ assessments of 4 green spaces Self-report physical and mental well-being (composite measure)
Italy
, users of green
space, 52% female,
M
age = 41,
n
= 568
Positi
ve – Greater ph
ysical
and mental well-being in high biodi
versity condition,
compared to lo
w condition.
Positi
ve – Indirect ef
fect of
biodi
versity on ph
ysical and
mental well-being via percei
ved restorati
veness.
Cox et al. (2017
)
Explored the association between neighbourhood nature and mental health
Bird ab
undance in the
morning and afternoon; bird species richness in the morning and afternoon. Unspecified, biodi
versity
assessed 250 m from centre of participants’ postcode Self-report mental health (Depression; Anxiety; Stress, DASS 21). UK, residents in 3 towns in southern England, 56% female, age range 18 and o
ver
(no mean gi
ven),
n
= 263
Positi
ve – Greater afternoon
bird ab
undance associated
with less depression, anxiety and stress. No relationship – No ef
fect
of morning bird ab
undance,
and morning and afternoon bird species richness on mental health.
Table 9.1 (continued) Reference Objecti ves Biodi versity indicator
Contact with nature
a
Health outcome (measure
b)
Population
General result
Dallimer et al. (
2012
)
c
Explored the role of species richness in riverine en
vironments in
promoting psychological well-being Species richness of: birds; butterflies; and plant/trees; bird ab
undance; Shannon
Di
versity Inde
x of habitat
types; tree co
ver; percei
ved
species richness of: birds, butterflies and plant/trees Direct, in-situ assessments of 34 green spaces
Self-report psychological well-being (reflection; continuity with the past; and attachment subscales) UK, users of green space, 38% female, age range 16–70 (no mean gi
ven),
n
= 1,108
Positi
ve – Greater bird
ab
undance and bird species
richness, tree co
ver
, and
percei
ved species richness of
birds, b
utterflies and plants/
trees positi
vely associated
with psychological well-being. Ne
gati
ve – Psychological
being declined with
greater plant species richness. No relationship – Butterfly biodi
versity and Shannon
Di
versity Inde
x had no
ef
fect on
being.
De Jong et al. (
2012
)
c
Explored associations between en
vironmental
dimensions and general health Scania Green Score ‘lush, rich in species’: Percei
ved
en
vironmental dimensions.
CORINE land co
ver data.
Unspecified, assessed di
versity
300 m from participants’ home Self-report general health (ph
ysical and
mental health)
Sweden, Residents of rural and sub
urban
areas, 55% female, age range 18–80 (no mean gi
ven),
n
= 24,847
No relationship – No ef
fect
of li
ving near to a ‘lush, rich
in species’ en
vironment on
health, after adjusting for covariates.
Duarte- Tagles et al. (2015
)
Explored the association between biodi
versity
indicators and pre
valence of depressi
ve symptoms Mar galef Di versity inde x of eco-re gions
Unspecified, biodi
versity
assessed at state level Self-report mental health (based on DSM-IV criteria for depression)
Me
xico, residents in all
states, 78.7% female, M age 40.5 (range 20–65), n = 4,777
No relationship – More ecore
gions in the state
lo
wers the risk of
depression. Ho
we
ver
, no
ef
fect when accounting for
Reference
Objecti
ves
Biodi
versity indicator
Contact with nature
a
Health outcome (measure
b) Population General result Foo ( 2016 )
Explored the mediating pathw
ays between en vironment with dif ferent le vels of
naturalness and well-being
Three forests that v
ary on
their species richness (lo
w
,
medium, high)
Direct,
in situ
assessments of 3 forest en
vironments
Self-report well-being; and mental health Malaysia, Users of green space. No gender or age gi
ven, n = 350 No relationship – All three le
vels of forest di
versity had
a similar influence on well-being and mental health, b
ut mediating
pathw
ays dif
fered.
Fuller et al. (2007
)
c
Explored the ef
fect of
species richness in urban green space to psychological well-being Species richness of: birds; butterflies; and plants; number of habitat types; and tree co
ver
Direct, in-situ assessments of 15 green spaces
Self-report psychological well-being (reflection; distinct identity; continuity with the past; and attachment subscales) UK, users of green space, no gender or age gi
ven,
n
= 312
Positi
ve – Greater bird and
plant species richness, and number of habitat types positi
vely associated with
psychological well-being. No relationship – Butterfly species richness and tree cover were not associated with psychological well-being.
Grahn & Stigsdotter (2010
)
c
Attempted to identify the dimensions of nature people prefer and use for stress relief
Percei
ved en
vironmental
dimensions: ‘rich in species’ (precursor to Scania green score)
Not applicable
Self-report le
vel
of stress
Sweden, residents in central and southern urban areas, no gender or age gi
ven,
n
= 733
No relationship – Environments ‘rich in species’ not significantly correlated with stress le
vel.
Huby et al. (2006
)
c
Explored the inte
gration
of natural and social sciences data to understand relationships between en
vironment
and society
Bird species richness
Unspecified, Lo
wer
Super Output Areas (LSO
A)
Mental health depri
vation
indicator of English Indices of Depri
vation
England, residents of rural areas, no gender
, age or n gi ven Positi
ve – Greater bird
species richness associated with mental health.
Table 9.1 (continued) Reference Objecti ves Biodi versity indicator
Contact with nature
a
Health outcome (measure
b)
Population
General result
Luck et al. (2011
)
c
Examined the relationships between biodi
versity and
residents’ personal well-being, neighbourhood
being,
and
connection to nature
Bird species richness; abundance of birds; amount of v
egetation co
ver; and
ve
getation density
Unspecified, assessed di
versity
in the neighbourhood Self-report life satisf
action
Australia, residents of Ne
w South
W
ales and
V
ictoria, no gender or
age gi
ven,
n
= 1,078
Positi
ve – Life satisf
action
positi
vely associated with
greater bird species richness and ab
undance and
ve
getation co
ver and density
. Rantak okk o et al. ( 2018 )
Explored the association between neighbourhood nature di
versity and
mental health and well-being
Shannon Di
versity Inde
x of
land use types
Unspecified, assessed di
versity
500 m from participants’ home.
Self-report mental well-being (WHO QoL) and mental health (depression, CES-D) Central Finland, older people, 62% female,
M
age = 80.6 (range 75–90),
n
= 848
Positi
ve – Greater Shannon
Di
versity of land use
types associated with greater quality of life. No relationship – No ef
fect
of Shannon Di
versity of land
use types on depressi
ve symptoms. Sa w et al. ( 2015 )
Explored the ef
fect of
access to dif
ferent types
of green space on well-being
Nature reserv
es (le
gally
protected sites for wildlife, flora and f
auna)
Indirect, access to nature reserv
es
within 1.2 km from participants’ home Self-report mental well-being (composite measure of PAN
AS and
Satisf
action
with Life scale)
Sing
apore, students
from a single uni
versity
, 68%
female, age range 18–35 (no mean given),
n
= 426
No relationship –
Access to
nature reserv
es had no
Reference
Objecti
ves
Biodi
versity indicator
Contact with nature
a
Health outcome (measure
b)
Population
General result
Wheeler et al. (
2015
)
Explored the association between
type and
quality
of dif
ferent natural
en
vironments and health
Shannon Di
versity Inde
x of
land co
ver types; and bird
species richness
Unspecified, biodi
versity
assessed at Lo
wer
Super
Output Areas
(LSO
A)
Self-reported general health UK, Residents of England aggre
gated at
LSO
A, no gender
, age
or
n
gi
ven
Positi
ve – Greater Shannon
Di
versity of land co
ver
associated with good health, and in
verse associations with
bad health. Bird species richness positi
ve association
with good health only
.
Note
.
Biodi
versity v
ariables with a slash (‘/’) are a combined v
ariable where in
vestig
ator did not separate out the contrib
ution of each taxon; tw
o taxa are ana
-lysed together a‘Direct’ and ‘indirect’ contact with nature cate
gories based on K
eniger et al. (
2013
)
bMeasures are listed only when reported by the original authors cStudy from Lo
vell et al. (
2014
188
Contact with the biodiverse environment was coded as either indirect or direct following Keniger et al. (2013). Indirect contact “does not require a person to be physically present in nature” (Keniger et al. 2013, p. 916) and can include viewing nature through a window, and looking at photographs, paintings or motion pictures of nature. Direct contact with nature stipulates that nature, or natural elements, are physically present in the same space as the individual (Keniger et al. 2013).1
Examples of direct contact include indoor plants, using urban green spaces for edu-cation purposes, reading or having a picnic in the park, doing sports or exercise in a natural setting, gardening and camping.
Moderating variables were categorised as either personal (e.g. age, gender, socio- economic status) or contextual (e.g. urbanicity, safety) (Hartig et al. 2014; Markevych et al. 2017). Mediators were classified as ‘reducing harm’, ‘restoring capacities’ or ‘building capacities’ according to Markevych et al. (2017). ‘Reducing harm’ consid-ers the role of the natural environment to reduce exposure to environmental stressors like heat or noise pollution. ‘Restoring capacities’ mediators support renewal of adapted resources that have become depleted through everyday demands, such as attention restoration and stress recovery. ‘Building capacities’ mediators highlight the role of green spaces in strengthening an individual’s capacity to acquire new adaptive resources like fostering physical activity and social cohesion.
9.2.3 Synthesis of Results
To provide a synthesis of results assessing the influence of biodiversity on mental health and well-being, a combined set of 24 studies, drawn from Lovell et al. (2014) and from our updated review, was utilised. Nine quantitative studies identified in Lovell et al. (2014) that assessed biodiversity and mental health and well-being relationships were included (Table 9.1). Consequently, 4 studies from Lovell et al. (2014) with physical health as the outcome were excluded (Huynen et al. 2004; Poudyal et al. 2009; Sieswerda et al. 2001; Tilt et al. 2007). Also excluded were 4 studies that, according to Lovell et al. (2014), did not directly assess biodiversity but were included in their analysis nevertheless (Barton et al. 2009; Curtin 2009; Lemieux et al. 2012; Pereira et al. 2005). In this sense our synthesis of results is more critical than Lovell et al.’s (2014) by including only those studies that consider the biodiversity of the environment in some way. Fifteen of the 16 articles identified in our updated search were included in the synthesis of results. Foo (2016) was excluded from the synthesis of results because it analysed the associations between use of the environment, individual differences in environmental experience, and perceived physical activity, well-being and mental health given a certain level of actual biodiversity instead of an investigation of the influence of biodiversity levels on mental health and well-being.
1 This is a combination of Keniger et al. (2013) ‘incidental’ and ‘intentional’ interaction types as
both describe being in the presence of nature.
189
Due to the heterogeneity of the selected articles in terms of research design, measures and participants, data were analysed using narrative synthesis (Popay et al. 2006). The purpose of narrative synthesis is to identify the factors that explain the differences in results in the body of literature (Popay et al. 2006). Patterns of results across all 24 studies were identified according to study design, measures of biodiversity and mental health or well-being. Vote counting (Popay et al. 2006) was used to describe the frequency of significant and non-significant results across the 24 quantitative studies. This analytical approach has been used previously (Lovell et al. 2014). While we acknowledge that vote counting has known deficiencies (e.g. giving equal weight to studies with different research designs, samples and effect sizes), it is a useful as a preliminary interpretation of results across studies (Popay et al. 2006). Our findings should thus be interpreted with caution.
9.3 Results
9.3.1 Characteristics of the Recent Literature, Published
Since Lovell et al.’s (
2014
) Review, Relating Biodiversity
to Mental Health and Well-being
The following describes the recent literature (n = 16), published since 2012, on biodiversity and mental health and well-being. See Lovell et al. (2014) for descrip-tion of the body of evidence up to 2012.
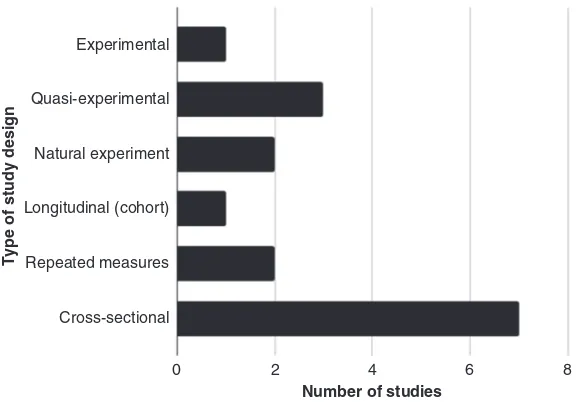
All 16 studies examined, wholly or in part, the relationships between biodiver-sity and one or more mental health or well-being outcomes (see Table 9.1). Eleven studies were based in Western Europe, three in North America and two in Asia. Two studies were from emerging economies of Malaysia and Mexico. Six different study designs were used to examine the relationship between biodiversity and mental health and well-being (Fig. 9.2).
9.3.1.1 Spatial Scale
The spatial scale at which the relationships were examined ranged from the national (Duarte-Tagles et al. 2015; Wheeler et al. 2015) to the local (Carrus et al. 2015; Foo
2016; Marselle et al. 2015, 2016). Specifically, scales considered whole countries (England (Wheeler et al. 2015) and Mexico (Duarte-Tagles et al. 2015)), geographi-cal regions within countries (England (Cox et al. 2017), Finland (Rantakokko et al.
2018), Sweden (Annerstedt van den Bosch et al. 2015), the USA (Jones 2017)) and specific places such as forests in the Klang Valley region of Malaysia (Foo 2016), protected nature reserves in Singapore (Saw et al. 2015) and green spaces in Italy (Carrus et al. 2015).
190
9.3.1.2 Participants
The number of participants varied considerably among the recently published stud-ies: ranging from 35 (Johansson et al. 2014) through to the millions (with the use of data from the national census, Wheeler et al. 2015). Participant type also differed, including university students (Cracknell et al. 2016, 2017; Saw et al. 2015) and staff (Johansson et al. 2014), adults participating over the internet (White et al. 2017; Wolf et al. 2017), group walkers over the age of 55 (Marselle et al. 2015; Marselle et al. 2016), park users (Carrus et al. 2015), visitors to forests (Foo 2016), and resi-dents of specific countries or regions as previously detailed (Annerstedt van den Bosch 2015; Cox et al. 2017; Duarte-Tagles et al. 2015; Jones 2017; Rantakokko et al. 2018; Wheeler et al. 2015).
9.3.1.3 Theoretical Position
Where articulated, the theoretical underpinnings largely reflected the dominant understandings of environment-health linkages (for further discussion on biodiver-sity and health theories, see Marselle Chap. 7, this volume). Specifically, 9 studies (Annerstedt van den Bosch, et al. 2015; Cox et al. 2017; Cracknell et al. 2016, 2017; Foo 2016; Marselle et al. 2015, 2016; Saw et al. 2015; White et al. 2017) used the Attention Restoration Theory (Kaplan and Kaplan 1989; Kaplan 1995) and the Stress Reduction Theory (Ulrich 1983; Ulrich et al. 1991) to explain the effects of biodiversity on mental health and/or well-being. Additionally, the Biophilia hypoth-esis (Kellert and Wilson 1993) was also mentioned (Annerstedt van den Bosch et al.
Experimental
Quasi-experimental
Natural experiment
Longitudinal (cohort)
Repeated measures
Cross-sectional
0 2 4
Number of studies
Type of study design
[image:16.439.76.365.60.261.2]6 8
Fig. 9.2 Type of study design used to examine biodiversity and mental health and well-being relationships across the 16 studies published after 2012
191
2015; Carrus et al. 2015; Saw et al. 2015; Wolf et al. 2017), as was appraisal theory (Johansson et al. 2014). Four studies (Duarte-Tagles et al. 2015; Jones 2017; Rantakokko et al. 2018; Wheeler et al. 2015) did not articulate a theory for why or how biodiversity may be related to better health and well-being.
9.3.1.4 Biodiversity Assessment
There was considerable variation across the 16 studies on the organisational level at which biodiversity was studied, the data collection method used, and the type of environment/organism investigated (see Table 9.2). Seven studies assessed biodi-versity at the ecosystem or habitat level. Measurement across these studies included use of secondary, geographically-referenced data to determine land cover and land use diversity using the Shannon Diversity Index (Rantakokko et al. 2018; Wheeler et al. 2015), eco-region diversity using the Margalef Diversity Index (Duarte-Tagles et al. 2015) and access to protected areas (Saw et al. 2015). Investigator categorisa-tion of ecosystem/habitat biodiversity was used to classify environments into low, medium and high biodiversity biotopes (Johansson et al. 2014) or low vs. high bio-diverse green spaces (Carrus et al. 2015). Participants’ perception of habitats/eco-system was used in one study; the Scania Green Score uses interpreted satellite imagery-derived land use data (i.e. mixed forest and marshes, beaches, sand plains and bare rock, biotopes and national parks) to map perceived biodiversity (‘lush, rich in species’) of an environment (Annerstedt van den Bosch et al. 2015). At the species community level, 6 studies assessed biodiversity in terms of species rich-ness for various taxa (i.e. birds, butterflies, plants, trees, fish/crustaceans). Species richness was measured using standard ecological field survey techniques (Cox et al.
2017; Cracknell et al. 2016), secondary data (Wheeler et al. 2015) or investigator categorisation of species richness (e.g. low vs. high based on assessment of content in images or videos (Cracknell et al. 2017; Wolf et al. 2017)). Participants’ percep-tion of species richness was employed in 3 studies (Marselle et al. 2015, 2016; White et al. 2017). At the species community level, abundance of a specific taxo-nomic group (i.e. birds, fish/crustaceans) was also assessed in 2 studies using stan-dard ecological survey techniques (Cox et al. 2017), and investigator categorisation of stimuli (i.e. low vs. high abundance; Cracknell et al. 2017). At the single species level, Jones (2017) investigated biodiversity loss and ecosystem health through the loss of North American ash trees (Fraxinus spp.) following the presence of the inva-sive species emerald ash borer (EAB) (Agrilus planipennis). This was assessed using secondary data.
9.3.1.5 Mental Health and Well-being Assessment
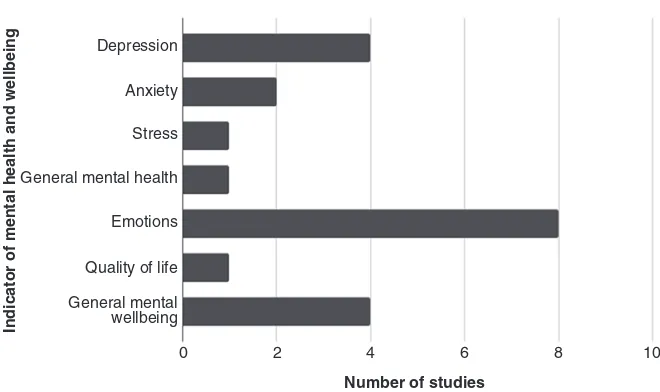
There was considerable variation in the outcomes considered and the measures used among the studies (Fig. 9.3). Mental health was assessed in 7 studies (Annerstedt van den Bosch et al. 2015; Cox et al. 2017; Duarte-Tagles et al. 2015; Foo 2016;
192
Table 9.2
Le
vel of biodi
versity in
vestig
ated and data collection method used in the 16 studies published after 2012
Data collection method
Biodi
versity le
vel
Standard ecological surv
ey Secondary data In vestig ator cate gorisation of biodi versity Percei ved biodi versity Ecosystems/habitats Mar galef Di versity Inde
x of eco-re
gions
(Duarte-T
agles et al.
2015
)
Forest biotopes (Johansson et al.
2014
)
Scania Green Score (Annerstedt v
an den Bosch
et al.
2015
)
a
Protected area designation (Sa
w
et al.
2015
)
Green spaces (Carrus et al. 2015
)
Shannon Di
versity Inde
x of land co
ver
(Wheeler et al.
2015
) and land use
(Rantak
okk
o et al.
2018
)
Species communities Species richness Birds in the morning, and birds in the afternoon (Cox et al.
2017
)
Birds (Wheeler et al.
2015
)
Fish/crustaceans (Cracknell et al.
2017
)
Animals/plants (White et al. 2017
)
Plants, birds, mammals and reptiles/amphibians (F
oo
2016
)
Birds, b
utterflies and plants/
trees (Marselle et al.
2016
;
Marselle et al.
2015
)
Fish/crustaceans (Cracknell et al.
2016
)
T
rees and birds (W
olf et al.
2017
)
Ab
undance of a
specific taxonomic group Birds in the morning, and birds in the afternoon (Cox et al.
2017
)
Fish/crustaceans (Cracknell et al.
2017
)
Single species
Emerald ash borer (EAB) (
Agrilus
planipennis
), which is responsible for
biodi
versity loss of North
American ash trees ( F raxinus spp.) (Jones 2017 ) Note . Biodi versity le
vels are based on Botzat et
al. (
2016
). Data in the cells identifies the specific biodi
versity v
ariable assessed; no data in a cell means no stud
-ies in
vestig
ated that biodi
versity le
vel using a specific data collection method. Biodi
versity v
ariables with a slash (‘/’) are a combined v
ariable where the in
ves
-tig
ator did not separate out the contrib
ution of each taxon; tw
o taxa are analysed together
a‘Lush, rich in species’ is a percei
ved biodi
versity assessment that is then mapped using interpreted, secondary land co
ver data
193
Jones 2017; Rantakokko et al. 2018; Wolf et al. 2017). The majority of these assessed depression (Cox et al. 2017; Duarte-Tagles et al. 2015; Jones 2017; Rantakokko et al. 2018) using self-report standardised measures such as the DASS (Cox et al. 2017), CES-D (Rantakokko et al. 2018) and PHQ-12 (Jones 2017). Anxiety was assessed also through the use of standardised self-report measures: DASS (Cox et al. 2017) and the STAI (Wolf et al. 2017). The DASS was addition-ally used to assess perceived stress (Cox et al. 2017). General mental health was assessed by Foo (2016) who utilised scales specifically developed for the study.
Mental well-being was examined in 13 studies (Carrus et al. 2015; Cracknell et al. 2016, 2017; Foo 2016; Johansson et al. 2014; Jones 2017; Marselle et al. 2015,
2016; Rantakokko et al. 2018; Saw et al. 2015; Wheeler et al. 2015; White et al.
2017; Wolf et al. 2017). The majority assessed emotions (Cracknell et al. 2016,
2017; Johansson et al. 2014; Jones 2017; Marselle et al. 2015, 2016; White et al.
2017; Wolf et al. 2017) using standardised self-report measures such as the PANAS (Marselle et al. 2015, 2016; Wolf et al. 2017), the Feeling Scale and Felt Arousal Scale (Cracknell et al. 2016; White et al. 2017), and the Basic Emotional Process 12 (Johansson et al. 2014). Quality of life was assessed with the WHO QoL (Rantakokko et al. 2018). Four studies measured general well-being: 3 studies (Carrus et al. 2015; Foo 2016; Wheeler et al. 2015) did not separate physical from mental well-being, and 1 study (Saw et al. 2015) did not separate mood (a short-term, affective aspect of well-being) from life satisfaction (a long-term, cognitive aspect of well-being, Diener et al. 1985).
Depression
Anxiety
Stress
General mental health
Emotions
Quality of life
General mental wellbeing
0 2 4
Number of studies
6 8 10
[image:19.439.54.384.363.559.2]Indicator of mental health and wellbeing
Fig. 9.3 Number of mental health and mental well-being variables used across the 16 studies published after 2012. The sum may exceed 100% because some studies address more than one mental health or well-being variable
194
9.3.1.6 Type of Contact with the Biodiverse Environment
Table 9.3 details the type of contact by biodiversity level. In general, authors hypoth-esised that direct or indirect contact with high biodiverse environments would have a positive effect on mental health and well-being. However, the majority of studies investigated the amount of biodiversity near to the home without specifying the type of contact (Annerstedt van den Bosch et al. 2015; Cox et al. 2017; Duarte-Tagles et al. 2015; Jones 2017; Rantakokko et al. 2018; Saw et al. 2015; Wheeler et al.
2015). Five studies, all experimental, considered indirect contact with biodiversity (Cracknell et al. 2016, 2017; Johansson et al. 2014; White et al. 2017; Wolf et al.
2017). In these studies, participants experienced biodiversity indirectly by viewing photographs (Cracknell et al. 2017; Johansson et al. 2014; White et al. 2017), videos (Wolf et al. 2017) or an aquarium exhibit (Cracknell et al. 2016). Four studies con-sidered direct contact with biodiversity by assessing users who were in specific environments (Carrus et al. 2015; Foo 2016; Marselle et al. 2015, 2016). The impacts of changes in biodiversity on mental health and well-being were investi-gated in 2 studies. Annerstedt van den Bosch et al. (2015) assessed the relationship between mental health and moving to a neighbourhood that is perceived to be ‘lush, rich in species’. Jones (2017) examined the mental health and well-being impact of biodiversity loss of North American ash trees due to the invasive species EAB. None of the studies investigated dose-response relationships of the effect of biodiversity on mental health or well-being.
9.3.1.7 Moderation Analyses
Moderation analyses were conducted in 4 studies (Carrus et al. 2015; Jones 2017; Wheeler et al. 2015; White et al. 2017). These were categorised as either personal (e.g. gender, age, socio-economic status) or contextual (e.g. urbanicity), based on previous research (Hartig et al. 2014; Markevych et al. 2017). Gender was found to moderate the influence of perceived biodiversity on positive affect and recovery; men reported greater positive affect and recovery from high (perceived) species rich environments (White et al. 2017). Age moderated the effect of perceived species richness on arousal (White et al. 2017), and biodiversity loss on life satisfaction (Jones 2017). People less than 35 years old reported more arousal from a perceived species rich environment, than those aged 35 and over (White et al. 2017). Whilst all age groups reported a reduction in life satisfaction from living in EAB infected areas, the largest (and only statistically significant) impact was for young adults aged 18–24 years old (Jones 2017). Socio-economic status was found to moderate the effect of biodiversity on health; the associations of Shannon Diversity of land cover types and bird species richness on health were the strongest for individuals who lived in the most socio-economically deprived neighbourhoods (Wheeler et al.
2015). Other personal variables such as being a member of an environmental organ-isation (White et al. 2017) had no moderating effect. The biodiversity-health rela-tionship was also moderated by urbanicity. In Wheeler et al.’s (2015) study, Shannon Diversity of land cover types had the strongest association with good health for
195
[image:21.439.50.387.83.457.2]individuals who lived in rural areas, whilst, conversely, bird species richness had the strongest positive effect on health for those who lived in urban areas. Carrus et al. (2015) found a high level of biodiversity was more strongly associated with well- being in urban green spaces than in peri-urban areas suggesting that higher biodi-versity is more important in urban areas for well-being. Other contextual variables, such as living near to the coast (White et al. 2017), had no moderating effect.
Table 9.3 Level of biodiversity investigated by the type of contact with biodiversity investigated in the 16 studies published after 2012
Type of contact with biodiversity Biodiversity
levels Direct Indirect Unspecified
Ecosystem/habitats
Green spaces (Carrus et al. 2015)
Forest biotopes (Johansson et al.
2014)
Margalef Diversity Index (Duarte-Tagles et al. 2015) Protected area designation (Saw et al. 2015)
Scania Green Score (Annerstedt van den Bosch et al. 2015) Shannon Diversity Index (Wheeler et al. 2015; Rantakokko et al.
2018)
Species communities
Species richness Birds, plants/trees, and butterflies (Marselle et al. 2016; Marselle et al. 2015)
Animals/plants (White et al.
2017)
Birds in the morning, and birds in the afternoon (Cox et al. 2017)
Plants, birds, mammals and reptiles/amphibians (Foo 2016)
Fish/crustaceans (Cracknell et al.
2016, 2017)
Birds (Wheeler et al. 2015)
Trees and birds (Wolf et al. 2017) Abundance a
specific taxonomic group
Fish/crustaceans (Cracknell et al.
2017)
Birds in the morning, and birds in the afternoon (Cox et al. 2017)
Single species
Emerald ash borer (Agrilus planipennis), which is responsible for biodiversity loss of North American ash trees (Fraxinus
spp.) (Jones 2017)
Total 4 5 7
Note. ‘Direct’ and ‘indirect’ contact with nature categories based on Keniger et al. (2013). Biodiversity levels are based on Botzat et al. (2016). Data in the cells identifies the specific versity variable assessed in each study; no data in a cell means no studies investigated that biodi-versity level and type of contact with the biodiverse environment. Biodibiodi-versity variables with a slash (‘/’) are a combined variable where the investigator did not separate out the contribution of each taxon; two taxa are analysed together
196
9.3.1.8 Mediation Analyses
Mediators were explored in 3 studies (Carrus et al. 2015; Foo 2016; Marselle et al.
2016). Investigated mediators fell within two of the three domains mentioned by Markevych et al. (2017): ‘restoring capacities’ (perceived restorativeness (Carrus et al. 2015; Foo 2016; Marselle et al. 2016)) and ‘building capacities’ (physical activity and social interaction (Foo 2016)). ‘Reducing harm’ mediators were not investigated in these studies. Perceived restorativeness was found to mediate the relationship between biodiversity of green space and general well-being (Carrus et al. 2015), and between perceived bird species richness and positive affect, happi-ness and negative affect (Marselle et al. 2016). Perceived bird species richness also had an indirect effect on positive affect and happiness via the restorative compo-nents of being away, fascination and compatibility, and an indirect effect on nega-tive affect via compatibility (Marselle et al. 2016). Foo (2016) conducted path analyses to determine how spending time in forest environments with different lev-els of biodiversity influenced mental health and general well-being. Multiple medi-ating pathways were found; time spent in a forest environment with intermediate or high biodiversity engendered a sense of being away, which was positively associ-ated with a change in mood, which then was relassoci-ated to mental health. In only the high biodiverse forest was mental health related to general well-being. In the inter-mediate biodiverse forest, physical activity inter-mediated the relationships between being away and mental health and general well-being. Social interaction did not mediate the effect of a forest environment on either outcome.
9.3.2 Synthesis of the Results from the Combined Published
Literature on Biodiversity and Mental Health and Well-
being Relationships
A combined set of 24 studies were included in the synthesis of results pertaining to the influence of biodiversity and mental health and well-being: 15 of the 16 recently published studies identified through our search process and nine of the 16 studies identified in Lovell et al. (2014). Fourteen of these 24 studies reported one or more positive associations between biodiversity and mental health or well-being outcomes (Carrus et al. 2015; Cox et al. 2017; Cracknell et al. 2017; Dallimer et al. 2012; Foo
2016; Fuller et al. 2007; Huby et al. 2006; Johansson et al. 2014; Jones 2017; Luck et al. 2011; Marselle et al. 2016; Rantakokko et al. 2018; Wheeler et al. 2015; White et al. 2017; Wolf et al. 2017) (see Table 9.4). Seventeen of the 24 studies reported one or more results with no significant relationship (Annerstedt van den Bosch et al.
2015; Annerstedt et al. 2012; Björk et al. 2008; Cox et al. 2017; Cracknell et al. 2016,
2017; Dallimer et al. 2012; de Jong et al. 2012; Duarte-Tagles et al. 2015; Fuller et al.
2007; Grahn and Stigsdotter 2010; Jorgensen et al. 2010; Marselle et al. 2015, 2016; Rantakokko et al. 2018; Saw et al. 2015; Wolf et al. 2017). Two studies reported one or more negative associations between biodiversity and mental health or well-being outcomes (Dallimer et al. 2012; Marselle et al. 2015) (Table 9.4).
197
Table 9.4
T
rends of results by type of study design across all 24 studies
Study design
Positi
ve; greater biodi
versity
associated with better health
No significant relationship
Ne
gati
ve; greater biodi
versity
associated with poorer health
Experimental
W
olf et al. (
2017
)
Jor
gensen et al. (
2010
)
a
W
olf et al. (
2017
)
Quasi-e
xperimental (no random
assignment)
Cracknell et al. (
2017
)
Cracknell et al. (
2017
)
Johansson et al. (
2014
)
b
White et al. (
2017 ) Natural e xperiment Jones ( 2017 ) c
Cracknell et al. (
2016
)
Longitudinal cohort
Annerstedt et al. (
2012
)
a
Annerstedt v
an den Bosch et al. (
2015
)
Repeated measures
Marselle et al. (
2016
)
d
Marselle et al. (
2015
)
Marselle et al. (
2015
)
Marselle et al. (
2016
)
d
Cross-sectional
Carrus et al. (
2015
)
e
Cox et al. (
2017
)
Dallimer et al. (
2012
)
a
Cox et al. (
2017
)
Dallimer et al. (
2012
)
a
Dallimer et al. (
2012
)
a
De Jong et al. (
2012
)
a
Fuller et al. (
2007
)
a
Duarte-T
agles et al. (
2015
)
Huby et al. (
2006
)
a
Fuller et al. (
2007
)
a
Luck et al. (
2011
)
a
Grahn and Stigsdotter (
2010
)
a
Rantak
okk
o et al. (
2018
)
Rantak
okk
o et al. (
2018
)
Wheeler et al. (
2015
)
Sa
w et al. (
2015
)
Wheeler et al. (
2015 ) Total 14 17 2 Note . P
apers may be included more than once, if v
ariation in indi
vidual results
aStudy from Lo
vell et al. (
2014
)
bEf
fect w
as greatest in the medium biotope, follo
wed by the high and then the lo
w biotopes
cIn
verse relationship
dMediation analysis only eMediation analysis also significant
198
Biodiversity levels were not equally covered by the 24 studies (see Fig. 9.4). Fifteen studies assessed biodiversity at the ecosystem/habitat level, with clear decreases to the single species level. However, the number of studies investigating biodiversity at these other levels has increased since Lovell et al. (2014).
9.3.2.1 Pattern of Results
To identify patterns in the results, we examined studies by biodiversity level and mental health and well-being outcomes (Table 9.5). We also identified the specific biodiversity variable that was measured (e.g. habitat types, birds) next to each result. The purpose was to gain insight into when biodiversity influences mental health and well-being and when it does not.
Mental Health and Well-being Outcomes
We started by looking at the results by outcome measure to determine if either out-come was more influenced by biodiversity. Nine studies investigated mental health outcomes, the majority of which were published after 2012, demonstrating a growth area for the field since Lovell et al. (2014). Mental well-being was investigated in 19 of the 24 studies. Two-thirds of the results (65%) pertaining to the influence of
15
10
5
0
Number of studies since Lovell et al. (2014) Number of Lovell et al. (2014) studies Ecosystem
/Habitat
Species
richness Perceived speciesrichness
Single species Abundance
[image:24.439.57.385.61.228.2]Cumulative number of studies by biodiversity level
Fig. 9.4 Biodiversity levels addressed by the 24 studies on the mental health and well-being effects of biodiversity. The sum may exceed 100% because studies address more than one level of biodiversity
199
Table 9.5 Pattern of results by biodiversity levels and mental health and well-being indicator (n = 24 studies)
Outcome variable
Biodiversity levels Mental health Mental well-being
Ecosystems/habitats
Annerstedt van den Bosch et al. (2015)
(o) Scania Green Score ‘Lush, rich in species’ Annerstedt et al. (2012)a
(o) Scania Green Score ‘Lush, rich in species’ Duarte-Tagles et al. (2015) (o) Margalef Diversity of
eco-regions
Rantakokko et al. (2018) (o) Shannon Diversity of
land use
Bjork et al. (2008)a
(oo) Scania Green Score ‘Lush, rich in species’
Carrus et al. (2015) (++b) Green spaces
Dallimer et al. (2012)a
(ooo) Shannon Diversity of habitat types
(+++) Tree cover De Jong et al. (2012)a
(o) Scania Green Score ‘Lush, rich in species’
Fuller et al. (2007)a
(+++o) Number of habitat types (oooo) Tree cover
Grahn & Stigsdotter (2010)a
(o) Scania Green Score ‘Lush, rich in species’
Johansson et al. (2014) (+) Forest biotopesc
Jorgensen et al. (2010)a
(o) Green spaces Luck et al. (2011)a
(+) Vegetation cover (+) Vegetation density Rantakokko et al. (2018) (+) Shannon Diversity of land
use
Saw et al. (2015) (o) Protected areas Wheeler et al. (2015)
(++) Shannon Diversity of land over
200
Table 9.5 (continued)
Outcome variable
Biodiversity levels Mental health Mental well-being
Species communities
Species richness Cox et al. (2017) (ooo) Morning birds (ooo) Afternoon birds Huby et al. (2006)a
(+) Birds Wolf et al. (2017) (+) Trees (+) Birds
Cracknell et al. (2016) (oo) Fish/crustaceans Cracknell et al. (2017) (o) Fish/crustaceans Dallimer et al. (2012)a
(+++) Birds (– – –) Plants (ooo) Butterflies Fuller et al. (2007)a
(++oo) Birds (++oo) Plants (oooo) Butterflies Luck et al. (2011)a
(+) Birds Wheeler et al. (2015) (+o) Birds Wolf et al. (2017) (+o) Trees (+o) Birds Perceived species richness Dallimer et al. (2012)a
(+++) Birds (+++) Plants/trees (+++) Butterflies Marselle et al. (2016) (+++) Birdsb
(ooo) Plants/treesb
(ooo) Butterfliesb
Marselle et al. (2015) (–oo) Birds (ooo) Plants/trees (ooo) Butterflies White et al. (2017) (+++) Animals/plants Abundance of a specific
taxonomic group
Cox et al. (2017) (ooo) Morning birds (+++) Afternoon birds
Cracknell et al. (2017) (+) Fish/crustaceans Dallimer et al. (2012)a
(+++) Birds Luck et al. (2011)a
(+) Birds
(continued)
201
biodiversity on mental health were non-significant. About half of the results (49%) showed non-significant relationships between biodiversity and mental well-being. These findings suggest that the results are equally ambiguous for both mental health and mental well-being.
Ecosystems/Habitats
Sixteen studies investigated the impact of biodiversity at the ecosystem/habitat level on mental health and well-being (Table 9.5). All 4 of the studies that assessed the influence of ecosystem/habitat biodiversity on mental health were non-significant (Annerstedt van den Bosch et al. 2015; Annerstedt et al. 2012; Duarte-Tagles et al.
2015; Rantakokko et al. 2018).
[image:27.439.50.386.71.130.2]Results were mixed for the 12 studies that investigated the impact of biodiversity at the ecosystem/habitat level on mental well-being. Positive relationships were found for Shannon Diversity Index of land cover and land use, and mental well- being; more biodiverse ecosystems/habitats were positively associated with greater quality of life (Rantakokko et al. 2018) and good health (Wheeler et al. 2015), and negatively associated with poor health (Wheeler et al. 2015). Non-significant results for Shannon Diversity Index of habitat types were found (Dallimer et al. 2012). Greater vegetation cover and density of vegetation cover were associated with greater life satisfaction (Luck et al. 2011). Number of habitat types was associated with greater reflection and distinct identity (Fuller et al. 2007). Tree cover was posi-tively associated with greater reflection, continuity with the past and attachment in Dallimer et al. (2012), but was non-significant in Fuller et al. (2007). A significant non-linear trend of forest biotope on positive affect was also found; intermediate biotope was rated the most positive followed by the high biotope and the low bio-tope (Johansson et al. 2014). Carrus et al. (2015) found biodiversity of different
Table 9.5 (continued)
Outcome variable
Biodiversity levels Mental health Mental well-being
Single species
Jones (2017) (+)d Ash trees
Jones (2017) (+)d Ash trees
Note. Papers may be included more than once, if variation in individual results. Biodiversity levels are based on Botzat et al. (2016). Biodiversity variables with a slash (‘/’) are a combined variable where investigator did not separate out the contribution of each taxon; two taxa are analysed together. Each –, o or + symbol represents the direction of each individual result reported in the paper. – = significant negative relationship; o = non-significant relationship; + = significant posi-tive relationship
aStudy from Lovell et al. (2014) bMediation analysis
cEffect was greatest in the medium biotope, followed by the high and then the low biotopes dInverse relationship