Int. J. Electrochem. Sci., 9 (2014) 2379 - 2396
International Journal of
ELECTROCHEMICAL
SCIENCE
www.electrochemsci.org
α-Furil Dioxime: DFT Exploration and its Experimental
Application to the Determination of Palladium by Square Wave
Voltammetry
Marwa G. Elghalban1,2*, Ahmed M. El Defarwy1,2, Reem K. Shah2, Mohamed A. Morsi1 1
Department of Chemistry, Faculty of Science Mansoura University.Mansoura, Egypt 2
Department of Chemistry, Faculty of Applied Science, Umm Al-Qura University, Makkah, Saudi Arabia
*
E-mail: mgelghalban@yahoo.com
Received: 24 December 2013 / Accepted: 29 January 2014 / Published: 2 March 2014
DFT based Molecular overview of the α-furil dioxime (α-FD) molecule were conducted using the B3LYP/6-31G (d) level of calculation. The electron affinity, ionization potential, dipole moment, atomic charges, Molecular electrostatic potential and the energy of highest occupied molecular orbital (HOMO) and of the lowest unoccupied molecular orbital (LUMO) of the studied compound were calculated. A sensitive procedure for the determination of Palladium by square wave adsorptive stripping voltammetry (SWCSV) on hanging mercury drop electrode (HMDE) using α-furil dioxime (α-FD) as complexing agent in 0.1 M NH4Cl/NH4OH buffer was obtained. The effect of various parameters such as pH, ligand concentration, accumulation potential, accumulation time, scan rate, pulse height and square wave frequency was studied. At the optimum condition, linearity was evaluated by increasing of palladium concentration up to 100 ng/ml, The calibration plot thus obtained was linear over the range 5-90 ng/ml with a correlation coefficient of 0.99993. The detection limit is equal to be 0.029 ng / ml. The interference by metal ions which are of great significance in real matrices has been studied. The proposed analytical procedure was applied for the determination of untreated tap water spiked with Pd (II). A good recovery is found as a result within the normal error.
Keywords: Palladium, DFT, α-furil dioxime, Square wave, spiked tap water.
1. INTRODUCTION
dentistry, watch making, and in making surgical instruments and electrical contacts. It is also used to purify hydrogen because the gas easily diffuses through heated palladium. In addition to that, palladium has greater mobility in the environment than platinum and rohidum (PGM) metals [1]. Although present concentrations in aquatic systems are typically in the pM range [2], PGM levels are predicted to rise in proportion to their increasing demand [3-4]. So, the determination methods of palladium are of interest. Different techniques have been used such as Conventional [5] and differential pulse polarography [6], the application of highly sensitive techniques, ICP-MS [7–9], GFAAS [10], NAA [11], coupled with an enrichment procedure, is necessary. Separation and preconcentration procedures have been developed for several matrices. For this purpose, systems based on liquid–liquid extraction [12–14], ion-exchange [15–17], solid sorbent extraction [8, 18–20] atomic absorption spectrometry [21] and neutron activation analysis [22] have been frequently used for the determination of palladium. In those techniques, palladium can be determined down to the ppm level. Among these methods, adsorptive stripping voltammetry (AdSV) is commonly employed because of its wide linear dynamic range and low detection limit which achieved as the result of performing the preconcentration steps directly into the voltammetric cell, thus decreasing the sampling handling, risk of sample contamination, and muli-element analysis capacity. An additional advantage of AdSV over other methods is the simplicity of the instrumentation, which is relatively inexpensive, small in size, requires low levels of electrical power and is sufficiently portable to permit its use in the field. Also possibility of analyzing various samples without the need of a prior separation is also convenient. Adsorptive stripping voltammetry (AdSV) [23-27] is a powerful analytical method for the determination of ppb level of metallic ions. This met on adsorptive, deposition and stripping of metallic ion complex with a suitable ligand at the electrode. Thus, adsorptive stripping analysis becomes a widely accepted tool for determination of trace amount palladium ions [28-31]. A number of ligands, such as dimethylglyoxime [32], the derivatives of phenolthiozine [33,34] have been reported for the determination of palladium by adsorptive stripping Voltammetry. The present work aimed to test the fidelity of using α-furildioxime for more sensitive detection of Pd by applying the SWAdSV.
2. EXPERIMENTAL
2.1. Apparatus
A Metrohm 693 VA processor with a three electrode system consisting of a hanging mercury drop electrode (HMDE) as the working electrode, Ag/AgCl reference electrode and a platinum counter electrode were used to obtain the voltammograms. A Hanna 211 pH meter was used to measure the solution pH.
2.2. Reagents
α-furil dioxime (Matheson company Inc.) was dissolved in absolute ethanol to give a 10-2 M stock solution. Pd2+ standard solution (1000 ppm) was prepared by weighing 0.0216 g PdCl2 (BDH, 59% Pd, anhydro); then 1 ml concentrated HCl and water were added to a final volume of 10 ml. The standard aqueous solution was prepared by successive dilution of the stock solution. Doubly distilled de-ionized water was used to prepare all solutions. Standard solutions of Pd (II) or ligand with lower concentrations were freshly prepared daily by successive dilution from stock solutions. Ammonia buffer (0.1 M) solution of ammonium chloride was prepared by dissolving the appropriate amount of the salt in bidistilled water followed by addition of ammonium hydroxide to adjust pH at the required value.
2.3. Procedure
The general procedure adopted for obtaining square wave adsorptive stripping voltammograms was as follow:
The supporting electrolyte solution (ammonia buffer pH 9.7) containing 3x10⁻⁴mol/l was pipette into the cell and purged with nitrogen for 8 min. the deposition potential (-0.40V vs. Ag/AgCl) was applied to a fresh mercury drop while the solution was stirred for 20s. At the end of stirring, apply deposition time 0s, the stirrer was switched off, and after 20s, had elapsed to allow the solution to become quiescent, the potential was scanned in a positive direction from -0.4 to -1.0 V using square wave adsorptive striping Voltammetry, with a scan rate of 50 mVs-1., Modulation frequency 150 Hz and a pulse amplitude of 50mV each scan was repeated three times with a new drop for each analyzed solution and the mean value was obtained. After back ground stripping voltammograms had been obtained, an aliquot at the Pd (II) standard was introduced into the cell and following the described procedure. The sample voltammogram was achieved, palladium peak was registered at about -0.688V, and its current was used as a measure of palladium concentration all experiments were carried out at room temperature.
2.4. Computational details
package [40]. The frequency calculations were performed at the same level to ensure that the systems represent the true minima on the potential energy surfaces. Then, the adiabatic and vertical ionization potentials (IP) and the valence electron affinities (EA) of α-Furil Dioxime in gas phase have been determined at the same level. The vertical electron affinity (VEA) (the ionization potential, VIP) is calculated as the energy difference between the neutral and anionic (cationic) species at the geometry of the neutral molecule. The adiabatic electron affinity (AEA) (the ionization potential, AIP) is defined as the energy difference between the neutral molecule and the anion (cation) at their respective relaxed geometries. The calculation formulas defined according to the energy difference are as follows:
AIP = E+ (opt) – E0(opt) (1)
VIP = E+ – E0(opt) (2)
AEA = E0(opt) – E-(opt) (3)
VEA = E0(opt) – E- (4)
Atomic charges were also investigated to provide the information about dipole moment which results from non-uniform distribution of charges on the various atoms in the structure. Molecular electrostatic potential (MEP) maps were calculated using the B3LYP method of calculation employing the 6-31G(d) basis set and based on the optimized geometry with the same method of calculation.
In the MEP, V(r), at a given point r(x,y,z) in the vicinity of a molecule, is defined in terms of the interaction energy between the electrical charge generated from the molecule electrons and nuclei and a positive test charge (a proton) located at r. The negative regions V(r) were related to electrophilic reactivity and the positive ones to nucleophilic reactivity. For the systems studied the MEP values were calculated as described previously, using the equation [41]
Where, the summation runs over all the nuclei A in the compound and polarization and reorganization effects are neglected. ZA is the charge of the nucleus A, located at RA and ρ(r') is the electron density function of the compound.
3. RESULTS AND DISCUSSION
3.1 Molecular overview
The optimization of the molecule under investigation is the most important step where the optimized geometry will be used to calculate the other discriptors in this study. Optimized geometry and the scheme of numbering the atoms of the α-Furil Dioxime is shown in Fig. 1.
Figure 1. α-Furil Dioxime optimized geometry using the B3LYP/631-G(d)level of calculation and its atomic numbering.
Table 1. Calculated EHOMO in (au), ELUMO in (au), Eg (energy gap), vertical and adiabatic ionization potential (eV), vertical and adiabatic electron affinity (eV), dipole moment (μ) for the α-Furil Dioxime molecule using B3LYP/631-G (d).
parameter EHOMO ELUMO Eg μ AEA AIP VIP VEA
value -0.21744 -0.05613 0.16131 3.064 0.121817 7.401044 7.592227 -0.14453
The eigen values of LUMO and HOMO and their energy gap reflect the chemical activity of the molecule. LUMO as an electron acceptor represents the ability to obtain an electron, while HOMO as an electron donor represents the ability to donate an electron. The smaller the LUMO and HOMO energy gaps, the easier it is for the HOMO electrons to be excited; the higher the HOMO energies, the easier it is for HOMO to donate electrons; the lower the LUMO energies, the easier it is for LUMO to accept electrons.
It can be seen from Fig. 2 that the HOMO is spread over the entire molecule and it shows appreciable amount of π- bonding character. The LUMO is also found to be uniformly distributed over the molecule and reflects a lot of anti bonding π- character.
The energy gap of HOMO–LUMO, in case of α-Furil Dioxime is found to be 0.16131 au, that explains the eventual charge transfer interaction within the molecule [42].
[image:5.596.126.471.74.248.2]
Figure 2. Frontier molecular orbitals mapped on the optimized molecular structure of α-Furil Dioxime and their corresponding energies calculated at B3LYP/6-31G (d) level of calculation.
[image:6.596.172.431.78.259.2]The hydrogen atoms H23 and H24 posses the highest positive charge (0.484) where as the atoms O21 and O22 (-0.538) as well as O1 and O9 (-0.489) have the highest negative charges in the molecule (Fig. 3), showing that these are the most probable sites for binding to the metal ion. The distribution of the atomic charges is also important in the determination of the direction of the dipole moment vector in a molecule which depends on the centers of negative and positive charges. The dipole moment of this molecule was found to be 3.064 debye.
Figure 3. showing α-Furil Dioxime atoms with NBO charge densities
[image:6.596.149.453.456.605.2]
To predict reactive sites for electrophilic and nucleophilic attack in the systems studied, MEP was calculated [45, 46] at the B3LYP/6–31G (d) optimized geometries. The negative regions of were related to electrophilic reactivity and the positive ones – to nucleophilic reactivity (Fig. 4).
- 4.827e-2 4.827e-2
Figure 4. MEP color map of α-Furil Dioxime molecule
In Fig. 4, Red areas refer to the regions containing electron-rich and blue areas refer to the regions containing electron-poor sites. Whereas, the green color indicates neutral electrostatic potential regions. It is clear that the negative regions are over the oxygen atoms of α-Furil Dioxime molecule and indicating that these sites can be the most probably involved in interaction with the metal ion.
3.2. Effect of operational parameters 3.2.1. Effect of pH variation
[image:7.596.127.478.153.399.2]
8.4 8.6 8.8 9.0 9.2 9.4 9.6 9.8 10.0 10.2
60 65 70 75 80 85 90 95 100 105
inA
pH
Figure 5. Influence of pH on the peak current of the Pd-α-FD complex. Conditions: Pd(II):200 ng/ml ;Cα-FD : 2x10⁻⁴M ; Eacc:-0.15V;tacc:60s; scan rate 20mVs-1; pulse amplitude :20mV and frequency:50Hz.
However a sharp current decline was observed at pH 9.8 and the signal is very broad probably due to the diminished complexing ability of the ligand at such pH values , thus pH = 9.7 seems to be appropriate choice to ensure the highest voltammetric peak current and was chosen for the whole study.
3.2.2. Effect of α-FD Concentration (CαFD)
-0.4 -0.5 -0.6 -0.7 -0.8 -0.9 -1.0 -2.0x10⁻⁸
0.0 2.0x10⁻⁸ 4.0x10⁻⁸ 6.0x10⁻⁸ 8.0x10⁻⁸ 1.0x10⁻⁷
1.2x10⁻⁷
1.4x10⁻⁷
iA
E(V) vs. Ag/AgCl
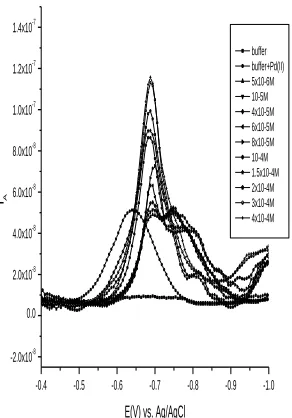
[image:8.596.148.450.88.297.2]buffer buffer+Pd(II) 5x10⁻⁶M 10-5M 4x10⁻⁵M 6x10⁻⁵M 8x10⁻⁵M 10-4M 1.5x10⁻⁴M 2x10⁻⁴M 3x10⁻⁴M 4x10⁻⁴M
[image:8.596.227.373.495.704.2]
0.0 1.0x10⁻⁴
2.0x10⁻⁴ 3.0x10⁻⁴ 4.0x10⁻⁴ 0
20 40 60 80 100 120
inA
[image:9.596.205.391.74.319.2]Ligand concentration, M
Figure 6. B Influence of Cα-FD on the peak current of the Pd-α-FD complex.
The square wave adsorptive stripping voltammogram of the complex formed between Pd and α-FD was studied with α-FD concentration in the range of (5x10⁻⁶
mol l-1 – 3x10⁻⁴ mol l-1) while the conc. of Pd (II) is kept 100 ng/ml, along with the other standard measuring conditions remained constant, (pH: 9.7; tacc:60s; Eacc -0.15V), and the corresponding peak current (ip) vs. ligand concentrations are shown in Fig.6a and Fig.6b, respectively.
As shown from Fig.6b, the concentration of α-FD has a great influence on the sensitivity of palladium determination. A large variation in SWCSV peak height occurs between 5x10⁻⁶ and 3x10⁻⁴M of α-FD. Beyond this concentration, the peak height decreases, probably due to some competition of the ligand for adsorption at the electrode surface. Consequently, an optimum α-FD concentration of 3x10⁻⁴ mol l-1 was selected for further experiments.
3.2.3. Effect of Accumulation Potential
The influence of the accumulation potential on the peak current was investigated (Fig.7) for 100 ppb Pd (II) with the optimum reagent concentration in ammonia buffer while the other standard measuring conditions remained constant (pH: 9.7; tacc: 60s; scan rate: 20mVs-1; pulse amplitude: 20 mV and modulation frequency: 50Hz).
-0.9 -0.8 -0.7 -0.6 -0.5 -0.4 -0.3
90 100 110 120 130 140
inA
E(V) vs. Ag/AgCl
Figure 7. Influence of Eaccon the peak current of the Pd-α-FD complex. Conditions: Pd (II):100ng/ml; pH: 9.7; CαFD: 3x10⁻⁴M; tacc: 60s; scan rate: 20 mVs-1; pulse Amplitude: 20mV and frequency: 50Hz.
3.2.4. Effect Accumulation Time
Fig.8 shows the variation of accumulation time on peak current of 100 ppb Pd (II) with optimum reagent concentration and other standard measuring conditions remained constant in ammonia buffer pH:9.70; CαFD: 3x10⁻⁴mol l-1; Eacc: -0.40V.
0 20 40 60 80 100 120
100 105 110 115 120 125 130 135 140
inA
t(sec.)
Figure 8. Influence of tacc on the peak current of the Pd-α-FD complex. Conditions: Pd (II):100ng/ml; pH: 9.7; CαFD: 3x10⁻⁴M; Eacc:-0.4V; scan ra: 20 mVs-1; pulse amplitude: 20mV and frequency: 50Hz.
[image:10.596.156.443.87.274.2] [image:10.596.167.431.472.642.2]
coverage and shifted to more negative potentials. The 0s, accumulation time was chosen in since the behavior was not changed till 60s.
3.2.5 Effect of Potential Sweep Conditions 3.2.5.1. Scan Rate
The potential scan rate for SW-CSV procedure was tested in the range between 10 and 60 mV/sec. (Fig. 9).
10 20 30 40 50 60
60 80 100 120 140 160 180 200
i nA
scan rate mV/sec.
Figure 9. Influence of scan rate on the peak current of the Pd-α-FD complex Conditions: Pd (II):100ng/ml; pH: 9.7; CαF : 3x10⁻⁴M; Eacc:-0.4V; tacc: 0s; pulse amplitude: 20mV; and frequency: 50Hz.
The stripping peak current that was obtained showed a linear dependence on the scan rate in range from 10 to 50mVs-1. In the higher than 50 mVs-1, the current is constant. In this work, a potential scan rate 50 mVs-1 was chosen and used in all experiments.
3.2.5.2. Square Wave Frequency
The peak current of Pd- α-FD increased when the frequency increase from 30 to 160 Hz (Fig. 10)
[image:11.596.136.460.250.445.2]
20 40 60 80 100 120 140 160 180
0.2 0.4 0.6 0.8 1.0 1.2 1.4
Modulation frequency ,Hz
iµA
Figure 10. Influence of modulation frequency on the peak current of the Pd--α-FD complex. Conditions: Pd (II):100ng/ml; pH:9.7; CαFD: 3x10⁻⁴M; Eacc: -0.4V; tacc: 30s ; scan rate: 50 mVs-1 and pulse amplitude: 50Hz.
3.2.5.3. Pulse Amplitude
Varying the value of excitation wave pulse amplitude plays an important role for the measured peak current. By increasing the pulse amplitude over the range 10-50 mV, an extremely enhanced voltammetric peak current is observed (Fig.11). As a result 50 mV were adopted as optimum for pulse amplitude.
10 20 30 40 50
100 150 200 250 300 350 400 450
i nA
pulse amplitude ,mV
Figure 11. Influence of pulse amplitude on the peak current of the Pd-α-FD complex. Conditions: Pd (II):100ng/ml; pH: 9.7; CαFD: 3x10⁻⁴M; Eacc: -0.4V; tacc: 30s; scan rate: 50 mVs-1 and frequency: 50Hz.
3.3 Analytical parameters
[image:12.596.191.402.81.247.2] [image:12.596.150.449.456.611.2]
metal ion was recorded to estimate the analytical characteristics of the developed square wave adsorptive stripping voltammetry method.
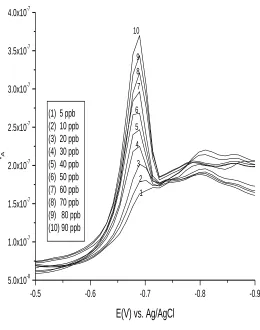
3.3.1. Calibration Graph and Detection Limit
The square wave cathodic stripping voltammogram( Fig.12) and the calibration graph (Fig.13) for the determination of palladium was obtained under the optimized conditions. (pH: 9.7; CαFD: 3x10⁻⁴ mol l-1; tacc: 30s; Eacc: -0.40V).
Linearity was evaluated by increasing palladium concentration up to100 ng/ml. The calibration plot obtained was linear over the range 5-90 ng/ml with the correlation coefficient of 0.99993. The precision expressed as the relative standard deviation (RSD) was1.74 % for nine successive measurements of the same sample containing 100.0 ng/ml of Pd (II) at optimized condition. The limit of detection (LOD) was calculated by carrying out the above procedure on 9 blank samples using the equation LOD=3Sd/m, where Sd is standard deviation of the blank peak current and m is the slope of the calibration curve.
-0.5 -0.6 -0.7 -0.8 -0.9
5.0x10⁻⁸
1.0x10⁻⁷
1.5x10⁻⁷
2.0x10⁻⁷
2.5x10⁻⁷
3.0x10⁻⁷
3.5x10⁻⁷
4.0x10⁻⁷
10
8 9
6
4
1 2 5
7
3
iA
E(V) vs. Ag/AgCl
(1) 5 ppb (2) 10 ppb (3) 20 ppb (4) 30 ppb (5) 40 ppb (6) 50 ppb (7) 60 ppb (8) 70 ppb (9) 80 ppb (10) 90 ppb
[image:13.596.171.431.369.699.2]
0 20 40 60 80 100 120
0 50 100 150 200 250
inA
[image:14.596.182.420.87.377.2]concentration,ppb
Figure 13. Calibration curve at optimum condition.
The detection limit obtained is equal to 0.029 ng / ml. In previous studies [24, 32-34] concerning the determination of palladium (II) using different ligands and adsorptive stripping voltammteric techniques, the detection limit were found to be in the range of 1-2 ng / ml. Comparing these values for the detection limit with the one obtained in this work, one can find a pretty much good enhancement in the detection limit value for the determination of palladium (II).
3.4. Infulence of other metals ions
Table 2. Effect of interfering species on the Pd--α-FD reduction peak
Substance added Concentration (ppb) Change in ip %
Pb2+ 2000 -5.38
Co2+ 500 -7.33
Ni2+ 100 -3.53
Cd2+ 60 +8.86
PO43- 10000 -4.87
HCO3 - 9000 -9.96
NO3- 500 -7.63
F - 800 -1.85
Br - 800 -4.53
[image:14.596.45.557.586.762.2]
The α-FD is not completely specific for Pd (II) and can form complexes with other metal species. Thus, the effect of a number of common metal ions and anions on the determination of 100 ppb Pd (II) has to be assessed. The results of this study on the palladium- α-FD reduction peak are summarized in Table1.The criterion for interference was a peak height varying by more than 5% from the expected value. The results indicate that common anions including, bromide, nitrite, phosphate, chloride, bicarbonate do not interfere with the measurements at a mass ratio (anion:Pd) >500(Table 2). No response or interference was observed with added 20 fold Pb (II). A reduction peak was obtained with added Ni(II) evidently resulting from the reduction of an adsorbed Ni (II) complex.
3.5. Application
Fortunately, palladium is not found in natural water. Hence, the proposed method is applicable to drinking water where palladium is absent. So this proposed method was applied for the determination of untreated tap water spiked with Pd (II). Well defined peaks, similar to those found in the pure solution, were the obtained voltammogram of the tap water sample has peaked around the Pd (II)–α-FD peak is shown in Fig.14 and the corresponding graph shown in Fig.15. A good recovery is found as a result within the normal error (Table 3).
-0.5 -0.6 -0.7 -0.8 -0.9 -1.0
5.0x10⁻⁸ 1.0x10⁻⁷ 1.5x10⁻⁷ 2.0x10⁻⁷ 2.5x10⁻⁷ 3.0x10⁻⁷ 3.5x10⁻⁷ 4.0x10⁻⁷
4
3 2
1
iA
E(V) vs. Ag/AgCl
[image:15.596.194.405.398.675.2]
0 20 40 60 80 100 120
0 50 100 150 200 250
inA
[image:16.596.187.412.90.366.2]concentration,ppb
Figure 15. Calibration curve at optimum condition
Table 3. Results for the determination of Pd(II) in untreated tap water spiked with Pd(II)
Sample (ng ml−1) Palladium found Recovery rate(%)
20 21±1.22 105.0±6.1
30 30.32±1.43 101.6±4.8
40 41.40±0.44 103.5±1.10
70 71.33±1.77 101.9±2.5
4. CONCLUSION
The optimized working conditions of square wave adsorptive cathodic stripping voltammetry for the determination of trace level of palladium on hanging mercury drop electrode (HMDE) using α-FD as a preconcentrating agent were obtained. From the results obtained, the detection limit obtained was 0.029 ng/ml and the proposed method was applied for the determination of untreated tap water spiked with Pd (II). The results of the theoretical treatment indicate that the α-FD molecule would an interesting point for studying its redox potential and the mechanism of interaction with the palladium. ACKNOWLEDGMENT
[image:16.596.44.464.469.550.2]
References
1. M.Moldovan,; S.Rauch,; M.Gomez,; M.A.Palacios,; G.M.Morrison,; Water Res. 35 (2001) 4175– 4183.
2. K.Ravindra,; L.Bencs,; R.V.van Grieken,; Sci. Total Environ. 318 (2004) 1–43. 3. K.H.Ek,; G.M.Morrison,; S.Rauch,; Sci. Total Environ. 334–335 (2004) 21–38. 4. F.Zereini,; C.Wiseman,; W.Püttmann,; Environ. Sci. Technol. 41 (2007) 451–456. 5. T.B.Jarbawi,; W.R.Heineman,; G.J.Patriache,; Anal. Chim. Acta 126 (1981) 57. 6. A.R.Freeman,; M.A.Spirtes,; Biochem. Pharmacol. 12 (1963) 1237.
7. M . Ku¨hn, M. Kriews, Fresenius J. Anal. Chem. 367 (2000) 440. 8. I . Jarvis, M.M. Totland, K.E. Jarvis, Analyst 122 (1997) 19.
9. C . Barbante, G. Cozzi, G. Capodaglio, K. Van de Velde, C. Ferrari, A. Veysseyre, C. Boutron, G. Scarponi, P. Cescon, Anal. Chem. 71 (1999) 4125.
10. J . Tilch, C. Lu¨dke, E. Hoffmann, Fresenius J. Anal. Chem. 355 (1996) 913.
11. M . Schwarzer, M. Schuster, R. Von Hentig, Fresenius J. Anal. Chem. 368 (2000) 240. 12. Y .B. Qu, Analyst 121 (1996) 139.
13. S .J. Al Bazi, A. Chow, Talanta 31 (1984) 815.
14. M . Schuster, M. Schwarzer, Anal. Chim. Acta 328 (1996) 1. 15. K . Brajter, K. Slonawska, Talanta 30 (1983) 471.
16. P . Di, D.E. Davey, Talanta 42 (1995) 685.
17. A . Cantarero, M.M. Gomez, C. Camara, M.A. Palacios, Anal. Chim. Acta 296 (1994) 205. 18. E . Ivanova, F. Adams, Fresenius J. Anal. Chem. 361 (1998) 445.
19. Z .X. Su, Q.S. Pu, X.Y. Luo, X.J. Chang, G.Y. Zhan, F.Z. Ren, Talanta 42 (1995) 1127. 20. M .L. Lee, G. To¨lg, E. Beinrohr, P. Tscho¨pel, Anal. Chim. Acta 272 (1993) 193. 21. K, Terada, K. Matsumoto, Y. Taniqushi, Anal. Chim. Acta 147 (1983) 411. 22. H. Bem, D.E. Ryan, Anal. Chim. Acta 169 (1985) 79.
23. J.Wang, K. Varughese, Anal. Chim. Acta 199 (1987)185-189. 24. Sung-II Kim and Ki-Won Cha. Talanta 57(4) (2002) 675–679.
25. G. Raber, K. Kalcher, C. G. Neuhold, C. Talaber, G. Kölbl, Electroanalysis 7(2) (1995)138–142. 26. Fresenius', J. Anal. Chem. 357(7) (1997) 874–880.
27. Z. Zhao, Z. Gao, J. Electroanal. Chem. 256 (1) (1988) 65-75.
28. J.Wang,; in: A.J. Bard (Ed.), Electroanalytical Chemistry, vol. 16, Marcel Dekker, New York, 1987, pp. 1–89.
29. C.Brihaye,; G.Dugckaerts,; Anal. Chim. Acta 146 (1983) 37. 30. V.Starav,; M.Kopanica,; Anal. Chim. Acta 159 (1984) 105.
31. T.K.Hong,; Y.S.Kwon,; M.Z.Czae,; Anal. Sci. Technol. 10 (1997) 119. 32. J.Wang,; K.Varughese,; Anal. Chim. Acta 199 (1987) 185.
33. H.Sanke Gowda,; P.G.Ramappa,; B.Narayana Acha,; A. Fresenius, Z. Anal. Chem. 275 (1975) 127. 34. H.Sanke Gowda,; K.N.Thimmaiah,; Z. Anal. Chem. 279 (1976) 208.
35. R. Benassi, P. Ferrarini, C. Fontannesi, L. Benedetti, F.J. Paolucci, J. Electroanal. Chem. 564 (2004) 231.
36. L. Benedetti, C.B. Gavioli, C. Fontanesi, J. Chem. Soc., FaradayTrans. 86 (1992) 329. 37. C. Fontanesi, J. Mol. Struct. (Theochem) 329 (1997) 87.
38. [M. Harada, I. Watanabe, H. Watarai, Chem. Phys. Lett. 301 (1999) 270.
39. C. Fontanesi, P. Baraldi, M. Marcaccio, J. Mol. Struct. (Theochem) 548 (2001) 13.
Gomperts, R. E. Stratmann, O. Yazyev, A. J. Austin, R. Cammi, C. Pomelli, J. W. Ochterski, P. Y. Ayala, K. Morokuma, G. A. Voth, P. Salvador, J. J. Dannenberg, V. G. Zakrzewski, S. Dapprich, A. D. Daniels, M. C. Strain, O. Farkas, D. K. Malick, A. D. Rabuck, K. Raghavachari, J. B. Foresman, J. V. Ortiz, Q. Cui, A. G. Baboul, S. Clifford, J. Cioslowski, B. B. Stefanov, G. Liu, A. Liashenko, P. Piskorz, I. Komaromi, R. L. Martin, D. J. Fox, T. Keith, M. A. Al-Laham, C. Y. Peng, A. Nanayakkara, M. Challacombe, P. M. W. Gill, B. Johnson, W. Chen, M. W. Wong, C. Gonzalez, and J. A. Pople, Gaussian 03, Revision E.01, Gaussian, Inc., Wallingford CT, 2004. 41. P. Politzer, J. Murray, Theor. Chem. Acc 108 (2002) 134–142.
42. V. Balachandran , A. Nataraj, T. Karthick, Spectrochim. Acta 104 A (2013) 114–129. 43. Xavier Assfeld, J.L. Rivail, Chem. Phys. Lett. 263 (1996) 100–106.
44. Haining Liu, Larry A. Walker, Robert J. Doerksen, Chem Res Toxicol. 24(9) (2011) 1476–1485. 45. F.J. Luque, J.M. Lopez, M. Orozco, Theor. Chem. Acc. 103 (2000) 343–345.
46. N. Okulik, A.H. Joubert, Internet Electron. J. Mol. Des. 4 (2005) 17–30