Int. J. Electrochem. Sci., 11 (2016) 1496 - 1511
International Journal of
ELECTROCHEMICAL
SCIENCE
www.electrochemsci.org
Electrochemical degradation of formaldehyde with a novel
Pd/GO modified graphite electrode
Qing Hao, Yonggang Zhang*
State Key Laboratory of Separation Membranes and Membrane Processes, Tianjin Polytechnic University, Tianjin, China
*
E-mail: [email protected]
Received: 22 October 2015 / Accepted: 4 December 2015 / Published: 1 January 2016
A novel Pd/GO modified graphite electrode for anodic degradation of formaldehyde was successfully prepared via impregnation and electrodeposition processes. The surface morphology of the modified electrode was characterized by scanning electron microscope (SEM), energy dispersive X-ray spectroscopy (EDX), X-ray diffraction (XRD) and X-ray photoelectron spectroscopic (XPS) techniques. The electrocalytic behavior of the electrode was characterized by cyclic voltammetry, it indicated that the modified graphite had excellent catalytic performance. The as-deposited Pd/GO/graphite modified electrode was applied to electro-degradation formaldehyde. Various factors influencing the degradation efficiency of formaldehyde such as current density, initial concentration of formaldehyde and initial pH were systematically investigated. The removal efficiency of formaldehyde, COD and TOC could reach 90.6%, 83.6% and 85% in pH 4 after 120 min electrolysis with a 0.5 mol L-1 Na2SO4 at a current density of 15 mA cm-2, which gave the direct evidence of the electrocatalytic
capability of the electrode. The electrochemical degradation of formaldehyde at Pd/GO/graphite followed pseudo-first-order kinetics. These results indicated that the Pd/GO/graphite modified electrode would be a promising anode for electrochemical degradation of formaldehyde.
Keywords: Palladium nanoparticles, Graphene oxide, Electrocatalytic oxidation, Pd/GO/graphite
electrode, Formaldehyde
1. INTRODUCTION
attentions. At present, various methods of formaldehyde removal have been used by biological treatment [7], adsorption [8, 9], photocatalytic [10-12], plasma [13, 14], and thermal catalytic oxidation [15], yet there exist many limitations [16, 17]. The adsorption technology is limited by the adsorbent capacity, and the photocatalytic oxidation is easy to produce secondary pollution as well as having not efficient processing capacity. Plasma technique needs high cost. Thermal catalytic oxidation needs high temperature and high pressure. Therefore, an effective and low-cost method to formaldehyde removal needs to be developed.
Electrochemical degradation of organic pollutants has been investigated by many researchers [22-24]. And it has been proved as a cost-effective technology. Thus electrochemical degradation is a good choice of removing formaldehyde. As a new and attractive technology, electrochemical oxidation of organic pollutants has gained significant attentions over the past two decades [18-21]. The electrocatalytic degradation could resolve the possible secondary pollution due to the photocatalytic oxidation. One of the most important parts of electro-catalytic oxidation is obviously the electrode materials [27]. Good electrode materials should not only be effective in pollution degradation, but also be electrochemically stable and inexpensive.
There are many reports published about various modified electrodes materials. Safavi et al. [25] have developed palladium nanoparticles electrodeposited on carbon ionic liquid composite electrode for using electrocatalytic oxidation of formaldehyde. Ojani et al. [26] have investigated palladium nanoparticles on TiO2 nanotube electrode to be applied to electrochemical oxidation of
formaldehyde. Considering the graphite electrodes’s (GEs) advantages such as commercial availability, low costs and easy of modification [28-30], as well as the Pd/GO composite’s excellent catalytic activity for small organic molecules [31-33], a novel Pd/GO/graphite modified electrode as the anode for electro-degradation of formaldehyde. The electrode was characterized by SEM, EDX, XRD, XPS and cyclic voltammetric. And the electrochemical degradation of formaldehyde in aqueous solution was studied by galvanostatic electrolysis using the modified electrode as anode under different conditions. In addition, the degradation of higher concentration formaldehyde was also investigated.
2. EXPERIMENTAL
2.1. Reagents and Materials
Formaldehyde, palladium chloride, concentrated sulfuric acid and other reagents are of analytical reagent grade. All solutions were prepared with double distilled water. Supporting electrolyte used in the cyclic voltammetry was 0.1mol L-1 NaOH and 0.5mol L-1 Na2SO4 in the
degradation test.
2.2. Apparatus
Technologies Corporation, Japan. X-ray diffraction analysis was carried out using a D/Max-3C diffractometer (Japan) with Cu Kα radiation source (λ=0.15418nm). Cyclic voltammetry were performed on a CHI 660D electrochemical workstation (CH Instrumental Co. China) using a single-compartment cell with a conventional three electrodes. The modified electrode (d=6mm) was used as the working electrode. A saturated calomel electrode (SCE) and a platinum wire were used as the reference and auxiliary electrode, respectively.
2.3 Preparation of the Pd/GO/GE
Prior to experiment, the surface pretreatment of GE was performed by hand polishing of the electrode surface with successive grades of emery papers down to 3000 grit up to a mirror finish. The polished electrode was then degreased with 1:1 nitric acid solution, acetone and washed with running doubly distilled water and utilized for further electrodeposition. GO/Pd composite was fabricated on the GE surface by a simple two-step process. 10μl of 1 mg mL−1 GO suspension was drop casted on the pre-cleaned GE and allowed to dry for 12 h at room temperature. Then the palladium nanoparticles electrodeposition was performed by cyclic voltammetry in a solution containing 1 mmol L-1 PdCl2 and
0.1 mol L-1 hydrochloric acid. In which twenty consecutive cyclic voltammograms were recorded in the sweeping potential range between 0.4 to -0.25V and the scan rate was set at 50 mV s−1 [32]. The loading of Pd on the GO/GE surface was determined by inductively coupled plasma (ICP). For comparison, Pd/GE electrode was also prepared by electrodeposition of Pd on the surface of graphite under the same experimental conditions.
2.4 Formaldehyde degradation
The electrochemical degradation experiments were carried out by batch processes and the apparatus mainly consisted of a DC power supply, a heat-gathering style magnetic stirrer and a glass reactor. The anode was the modified electrode and cathode was stainless steel mesh surrounding the anode. The distance of the anode and cathode was 2 cm. For electrochemical degradation of formaldehyde tests, electrochemical cell with 100mL of 0.05mol L-1 formaldehyde solution and 0.5 mol L-1 Na2SO4 as supporting electrolyte were used. The experiments were conducted with different
constant applied current density, with constant current used, and stainless steel cathode and magnetic stirrer was used for solution mixing.
3. RESULTS AND DISCUSSION
3.1. Characterization
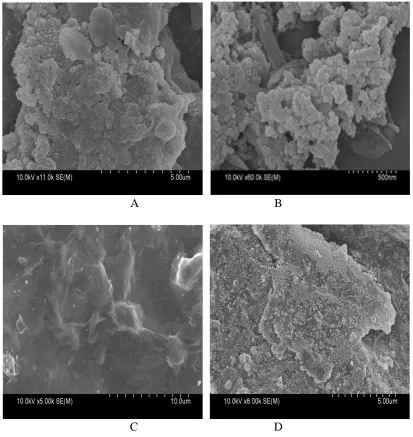
Fig. 1(A-E) showed the SEM images of the surface morphology of GO/GE, Pd/GE, Pd/GO/GE. Fig. 1(A) and (B) showed SEM images of Pd/GE with different magnification. It can be seen that Pd nanoparticles are deposited on graphite surface, however, their dispersion is not uniform and some Pd nanoparticles agglomerated together. The conglobatus Pd nanoparticles easily dropped from GE surface, which will result in shorter electrode durability, lower conversion efficiency and secondary pollution of Pd nanoparticles. Fig. 1(C) showed the surface of GO/GE, GO layers with plenty of wrinkles owing to the thin structure of the sheet could found on the electrode surface. Compared with Pd/GE (Fig. 1(A) and 1(B)), the Pd/GO/GE composite electrode displays a more uniform and compact morphology (Fig. 1(D) and 1(E)). And the deposited Pd particles in the presence of GO are obviously smaller, and have sufficient number of active catalytic sites and large surface area. Furthermore, the EDS spectrum of the Pd/GO/GE (Fig. 1(F)) confirms the presence of Pd.
A B
[image:4.596.92.505.333.770.2]
E F
Figure 1. The SEM images of Pd/GE (A), GO/GE (C), Pd/GO/GE (D), higher magnification SEM
images of Pd/GE (B), Pd/GO/GE (E), and EDS analysis of Pd/GO/GE (F).
Fig. 2 showed the XRD patterns of graphite and Pd/GO/GE electrodes. For the spectrum of graphite, the diffraction peak centered at 2θ of 26.5◦ is attributed to the (002) plane reflection of hexagonal crystalline graphite [36]. For the spectrum of Pd/GO/GE, it exhibits diffraction peaks at 2θ values of 10.94◦, 40.1◦and 46.6◦ corresponding respectively to the (001) and (111) planes of GO and Pd [37], confirming that Pd particles are successfully deposited on graphite electrode. This result was consistent with the SEM observation.
0 10 20 30 40 50 60 70 80 90
P
d
(2
0
0
)
P
d
(1
1
1
)
C(002)
In
te
n
si
ty
/a
.u
.
2/degree
C(002)
b
a
[image:5.596.96.502.68.279.2]C(001)
Figure 2. The XRD pattern of GO (a), Pd/GO/GE (b).
[image:5.596.169.421.480.690.2]
were performed. In Fig. 3 (A), it can be seen that there is a peak near 340 eV corresponding Pd 3d, this indicated that the Pd nanoparticles deposited on the electrode successfully. Fig. 3 (B) presents the C 1s spectra of Pd/GO/GE, the main peak centered at 284.6 eV is associated with C-C bonds. Another peak centered at 286.6 eV is due to C-O bonds. It is due to the existence of oxygen-containing functional groups or hydroxyl, but it is weak obviously. Fig. 3(C) showed apparent Pd 3d signals of Pd/GO/GE. It can be deconvoluted into double peaks (335.5 eV and 341.1 eV) corresponding to metallic Pd 3d5/2 and
Pd 3d3/2, respectively. From the XPS results, it can be concluded that the GO and Pd nanaoparticles
can deposited on the electrode surface.
0 200 400 600 800 1000 1200
In
te
n
s
it
y
/a
.u
O 1s
Pd 3d C 1s
A
280 282 284 286 288 290
In
te
n
si
ty
/a
.u
C-C
C-O B
328 330 332 334 336 338 340 342 344
Pd 3d3/2
In
te
n
si
ty
/a
.u
Binding Energy/ev
C
Pd 3d5/2
Figure 3. XPS spectra of Pd/GO/GE (A), C 1s XPS spectra of Pd/GO/GE (B), and the Pd 3d XPS
spectra of Pd/GO/GE (C).
3.2. Cyclic voltammetry analysis
[image:6.596.89.500.226.602.2]
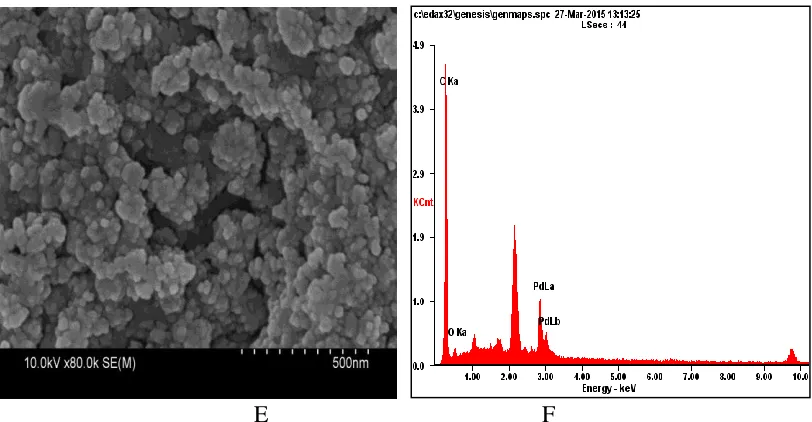
obtain stable voltammogram. Then typical results obtained for a potential scan from -0.8 to 0.8 V versus SCE are shown in Fig. 4(a) and (b), respectively. As can be seen, two anodic peaks can be clearly observed in the cyclic voltammograms. The forward scan of the CV curves is characterized by a strong current peak mainly attributed to the oxidation of COads to CO2, resulted from dissociative
adsorption of formaldehyde [35]. With the sweeping potential towards more positive values, COads was released from the surface and forward anodic peak was followed by a current drop due to the formation of Pd oxide layer which is nearly inactive for formaldehyde oxidation. In the reverse sweep, another anodic peak is observed due to the complete oxidation of HCHO to CO2 via a dehydrogenation
reaction [36].
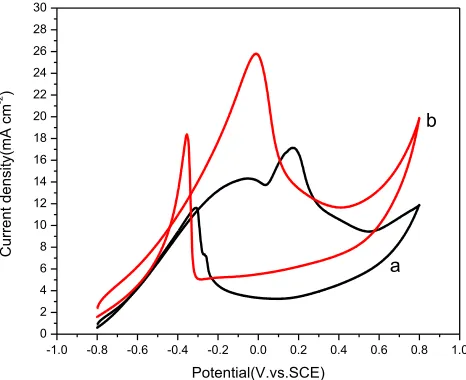
The anodic peak current density reflects the amount of formaldehyde oxidized at the Pd electrocatalysts, and the anodic peak potential represents the ability of electrocatalysts to catalyze formaldehyde oxidation. Therefore, the anodic peak current density and the peak potential are two important parameters to evaluate the electrocatalytic activity of catalysts [37-39]. In comparison with (a) and (b), it can be observed that there is an increment in the peak current density and a decrease in oxidation onset potential and peak potential. The oxidation peak current density was 17.2 mA cm-2 at +0.14 V on the Pd/GE and 26 mA cm-2 at -0.02 V on the Pd/GO/GE. These data can be attributed to that the large electrochemical active surface area of the electrodes due to that graphite as a carbon based support has a good adhering strength for nanoparticles. The higher electrocatalytic activity of the Pd/GO/GE may be related to that the thinnest 2D structure of graphene oxide can prevent metal nanoparticles from agglomerating in turn. On that account, graphene oxide sheets enhance the surface area of the nanocatalyst supported by them effectively, which eventually leads to a rise in catalytic activities [31, 40, 41]. In this section, a comparative study was done for the present electrode and some previous works in terms of onset and peak potential of formaldehyde oxidation (Table 1). From the data, it is evidence that the Pd/GO/GE has superb performance and can it act as an active electrode for formaldehyde oxidation.
-1.0 -0.8 -0.6 -0.4 -0.2 0.0 0.2 0.4 0.6 0.8 1.0
0 2 4 6 8 10 12 14 16 18 20 22 24 26 28 30
C
urre
nt
d
en
si
ty(mA
cm
-2 )
Potential(V.vs.SCE)
[image:7.596.175.408.518.708.2]a b
Figure 4. CVs of 0.03mol L-1 formaldehyde in 0.1 mol L-1 NaOH solution at Pd modified electrode (a)
Table 1. Comparison of the efficiency of Pd/GO/GE with some of the previously reported electrodes
for formaldehyde oxidation.
Modified electrode CElectrolyte/CFormaldehyde (M) V(mV s−1) Epvs.SCE/V j(mAcm−2) References
Pd–fMWNT 0.1 mol/L NaOH 0.3 50 0.7 82 (35)
Pt–Pd/SWCNT 0.5 mol/L H2SO4 0.5 50 0.78 33.56 (48)
Pd–CILE 0.1 mol/L NaOH 0.3 100 0.15 9.8 (24)
Pd‐MWNT/GCE 0.1 mol/L NaOH 0.3 50 0.42 9.7 (43)
Pt/PAANI/MWNTs/GCE 0.5 mol/L H2SO4 0.5 50 0.45 7.32 (44)
Pt/PAANI/GCE 0.5 mol/L H2SO4 0.5 50 0.50 5.63 (44)
Cu/P(2ADPA)/MCNTPE 0.1 mol/L NaOH 0.17 20 0.63 24.56 (45)
Pd/TiO2NT/Ti 0.1 mol/L NaOH 0.051 100 0.01 20.4 (25)
Pd/GE 0.1 mol/L NaOH 0.03 50 0.14 17.2 This work
Pd/GO/GE 0.1 mol/L NaOH 0.03 50 -0.02 26 This work
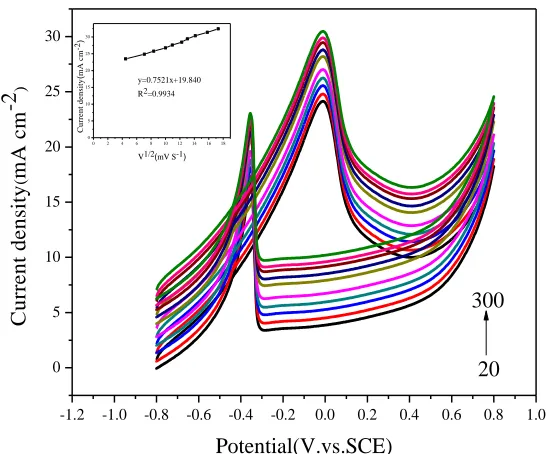
3.3. Effect of formaldehyde concentration and scan rate
-1.0 -0.8 -0.6 -0.4 -0.2 0.0 0.2 0.4 0.6 0.8 1.0
0 5 10 15 20 25 30
C
u
rr
e
n
t
d
e
n
si
ty
(m
A
c
m
-2 )
Potential(V.vs.SCE)
0.1M 0.01M 0.03M 0.05M 0.08M
Figure 5. Cyclic voltammograms of different concentrations of formaldehyde in 0.1 M NaOH, (a-f:
0.010, 0.030, 0.050, 0.080, 0.10mol L-1., at scan rate 50 mV s-1).
-1.2 -1.0 -0.8 -0.6 -0.4 -0.2 0.0 0.2 0.4 0.6 0.8 1.0 0
5 10 15 20 25 30
0 2 4 6 8 10 12 14 16 18 0
5 10 15 20 25 30
C
u
rr
e
n
t
d
e
n
si
ty
(
m
A
c
m
-2)
V1/2(mV S-1) y=0.7521x+19.840 R2=0.9934
C
u
rr
e
n
t
d
e
n
si
ty
(
m
A
c
m
-2
)
Potential(V.vs.SCE)
20 300
Figure 6. Cyclic voltammograms of 0.03mol L-1 HCHO in 0.1mol L-1 NaOH solution at the
Pd/GO/GE at different scan rate: 20, 50, 70, 100, 120, 150, 170, 200, 250, 300mV s-1. Insert: variation of forward anodic peak current density of HCHO versus ν1/2
.
3.4. Electrocatalytic of formaldehyde using Pd/GO/GE electrode 3.4.1. Effect of different current density
[image:9.596.165.417.94.295.2] [image:9.596.153.426.366.593.2]
cathode were connected by a DC regulated power supply to constitute for the formaldehyde treatment. The current density was obtained in accordance with the current divided by the area of the anode. The initial concentration of formaldehyde during the experiment runs was 150 mg L-1 of a volume of 100mL, and Na2SO4 was used as the supporting electrolyte. During the treatment, every predetermined
time intervals, 5mL of samples were withdrawn from the catholyte for analysis.
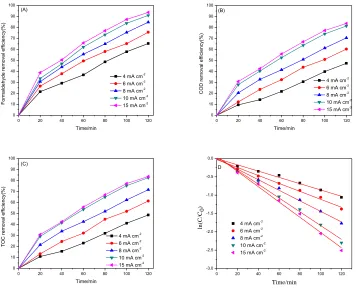
The applied current density is a key experimental parameter that affects the electrochemical degradation process as it regulates the capability of hydroxyl radical generation on the electrode surface [42]. Initial experiments were done in the experimental unit with current densities of 4, 6, 8, 10 and 15 mA cm-2, for a reaction time of 2 h. Fig. 7 (A–C) present plots of formaldehyde, TOC and COD concentrations as a function of electrolysis time. Initial formaldehyde concentration was 150 mg L-1, COD was 360mg L-1, TOC was 240mg L-1.
0 20 40 60 80 100 120
0 10 20 30 40 50 60 70 80 90 100
4 mA cm-2 6 mA cm-2 8 mA cm-2 10 mA cm-2 15 mA cm-2
F o rma ld e h yd e re mo va l e ffi ci e n cy(% ) Time/min (A)
0 20 40 60 80 100 120
0 10 20 30 40 50 60 70 80 90 100
4 mA cm-2 6 mA cm-2 8 mA cm-2 10 mA cm-2 15 mA cm-2
C O D re mo va l e ffi ci e n cy(% ) Time/min (B)
0 20 40 60 80 100 120
0 10 20 30 40 50 60 70 80 90 100
4 mA cm-2 6 mA cm-2 8 mA cm-2 10 mA cm-2 15 mA cm-2
T O C re mo va l e ffi ci e n cy(% ) Time/min (C)
0 20 40 60 80 100 120
-3.0 -2.5 -2.0 -1.5 -1.0 -0.5 0.0
4 mA cm-2 6 mA cm-2 8 mA cm-2 10 mA cm-2 15 mA cm-2
ln (C /C0 ) Time/min D
Figure 7. Removal efficiency of formaldehyde, COD and TOC on Pd/GO/GE (A-C) and kinetics of
formaldehyde degradation (D). Initial concentration of formaldehyde: 0.05mol L-1. Supporting electrolyte: 0.5mol L-1 Na2SO4. Initial pH: 4
[image:10.596.117.473.270.560.2]
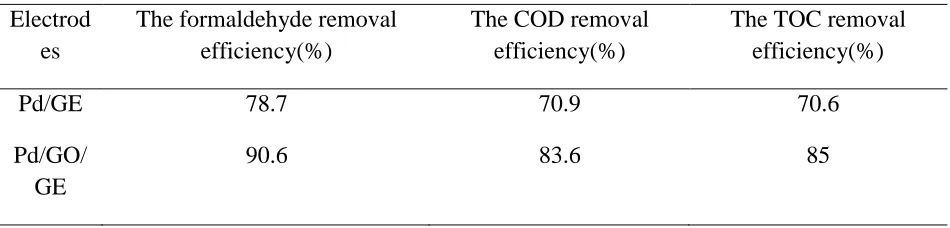
formaldehyde was removed after 120 min. The COD removal efficiency and the TOC removal efficiency also reached 83.6% and 85% when the current density was 15mA cm-2 and the electrocatalytic time was 120 min. However the formaldehyde, COD and the TOC removal efficiency of the Pd/graphite were just 78.7%, 70.9%, 70.6% (Table 2) when the current density was 15mA cm-2. This result is due to the higher electrochemical active surface area of the modified electrode. This result also indicated that the presence of GO greatly enhanced the active surface areas of Pd particles deposited on graphite. This is relevant to the cyclic voltammograms result (Fig. 4). The results illustrate that the Pd/GO/GE has higher degradation removal efficiency, also demonstrating the advantage of the present GO based electrode.
Table 2. Comparison of the removal efficiency of Pd/GO/GE with Pd/GE after 120 min electrolysis
with a 0.5 mol L-1 Na2SO4 at a current density of 15 mA cm-2
Electrod es
The formaldehyde removal efficiency(%)
The COD removal efficiency(%)
The TOC removal efficiency(%)
Pd/GE 78.7 70.9 70.6
Pd/GO/ GE
90.6 83.6 85
3.4.2 Effect of initial solution pH
Solution pH is one of the important factors that affect the performance of electrochemical oxidation process [49]. The effect of pH value on electro-oxidation efficiency differs and always depends on the material of electrode[50]. To investigate the effect of pH values on electrooxidation of formaldehyde process, we studied the degradation of formaldehyde on Pd/GO/GE at different initial pH values which were adjusted with 0.1M H2SO4 and 0.1M NaOH. It was found that the removal
[image:11.596.62.537.277.391.2]
0 20 40 60 80 100 120
0 10 20 30 40 50 60 70 80 90 100 pH=7 pH=10 pH=4 F o rma ld e h yd e re mo va l e ffi ci e n cy(% ) Time/min (A)
0 20 40 60 80 100 120
0 10 20 30 40 50 60 70 80 90 100 pH=7 pH=10 pH=4 C O D re mo va l e ffi ci e n cy(% ) Time/min (B)
0 20 40 60 80 100 120
0 10 20 30 40 50 60 70 80 90 100 pH=7 pH=10 pH=4 T O C re mo va l e ffi ci e n cy(% ) Time/min (C)
0 20 40 60 80 100 120
-3.0 -2.5 -2.0 -1.5 -1.0 -0.5 0.0 pH=7 pH=10 pH=4 ln (C /C0 ) Time/min D
Figure 8. Removal efficiency of formaldehyde, COD and TOC on Pd/GO/GE (A-C) and kinetics of
[image:12.596.115.474.85.374.2]formaldehyde degradation (D)by applying different pH. Current density: 15 mA cm-2. (Supporting electrolyte: 0.5M Na2SO4. Initial concentration of formaldehyde: 0.04M).
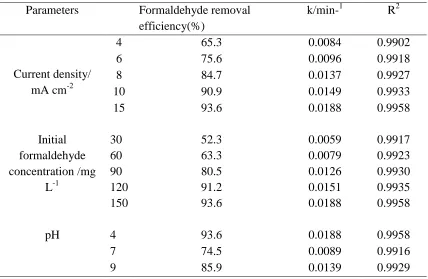
Table 3. Effect of current density, initial formaldehyde concentration, initial pH on pseudo first order
rate constant(κ) results for the electrochemical degradation of formaldehyde removal. Parameters Formaldehyde removal
efficiency(%)
k/min-1 R2
Current density/ mA cm-2
4 65.3 0.0084 0.9902
6 75.6 0.0096 0.9918
8 84.7 0.0137 0.9927
10 90.9 0.0149 0.9933
15 93.6 0.0188 0.9958
Initial formaldehyde concentration /mg
L-1
30 52.3 0.0059 0.9917
60 63.3 0.0079 0.9923
90 80.5 0.0126 0.9930
120 91.2 0.0151 0.9935
150 93.6 0.0188 0.9958
pH 4 93.6 0.0188 0.9958
7 74.5 0.0089 0.9916
[image:12.596.85.513.488.767.2]
3.4.3 Effect of initial concentration of formaldehyde on the electrochemical degradation
From the application angle, it was important to investigate the effect of initial concentration of formaldehyde. Fig. 9 shows the removal efficiency of formaldehyde concentration, COD and TOC when the initial pH was 4 and the current density was 15mA cm-2. It could be seen that all the removal efficiency of formaldehyde concentration, COD and TOC were increased with increasing the initial concentration of formaldehyde. For 120 min electrodegradation process, the formaldehyde removal efficiency was increased from 82.1% to 93.6% when the initial concentration of formaldehyde was increased from 30 mg L-1 to 150 mg L-1. It is considered that under the certain current density, the amount of OH· produced in the electrolysis was a constant. In theelectrocatalytic oxidation process, the controlling step is diffusion process. The increase of the initial concentration of formaldehyde improves the diffusion velocity, and thus enhancing the removal efficiency of formaldehyde. Moreover, the high concentration of formaldehyde is advantageous to the full occupation of adsorption sites on the electrode surface. As a result, the active sites on the electrode surface are fully employed, which increases the utilization level of active OH· produced from the electrode reaction. Hence, the current efficiency is pronounced at high initial concentration of formaldehyde.
0 20 40 60 80 100 120
0 10 20 30 40 50 60 70 80 90 100 30 mg 60 mg 90 mg 120 mg 150 mg F o rma ld e h yd e re mo va l e ffi ci e n cy(% ) Time/min (A)
0 20 40 60 80 100 120
0 10 20 30 40 50 60 70 80 90 100 30 mg 60 mg 90 mg 120 mg 150 mg C O D re mo va l e ffi ci e n cy(% ) Time/min (B)
0 20 40 60 80 100 120
0 10 20 30 40 50 60 70 80 90 100 30 mg 60 mg 90 mg 120 mg 150 mg T O C r e m o v a l e ff ic ie n c y (% ) Time/min (C)
0 20 40 60 80 100 120
-3.0 -2.5 -2.0 -1.5 -1.0 -0.5 0.0 30 mg 60 mg 90 mg 120 mg 150 mg ln (C /C 0 ) Time/min
Figure 9. Removal efficiency of formaldehyde, COD and TOC on Pd/GO/GE electrode (A-C) by
[image:13.596.112.474.367.671.2]
3.5 Electrocatalytic oxidation of higher concentration of formaldehyde
In the conventional methods of removing formaldehyde, a lot of technology has not good effect for high concentration of formaldehyde. Thus in a new experiment, a formaldehyde solution of higher concentration was subjected to electrolysis at 15 mA cm-2 and the pH was 4, initial formaldehyde concentration was 1500mg L-1. In the Fig. 10, it can be seen that for 120 min electrodegradation process, the formaldehyde removal efficiency still can reach 64.4%, which demonstrate the electrode has high electrocatalytic performance and the electrochemical approach shows good removal effect for higher concentration formaldehyde.
0 20 40 60 80 100 120
0 10 20 30 40 50 60 70 80 90 100
4 mA cm-2
6 mA cm-2
8 mA cm-2
10 mA cm-2
15mA cm-2
F o rm a ld e h y d e r e m o v a l e ff ic ie n c y (% ) Time/min (A)
0 20 40 60 80 100 120
0 10 20 30 40 50 60 70 80 90 100
4 mA cm-2
6 mA cm-2
8 mA cm-2
10 mA cm-2
15mA cm-2
C O D r e m o v a l e ff ic ie n c y (% ) Time/min (B)
0 20 40 60 80 100 120
0 10 20 30 40 50 60 70 80 90 100
4 mA cm-2
6 mA cm-2
8 mA cm-2
10 mA cm-2
15mA cm-2
T O C r e m o v a l e ff ic ie n c y (% ) Time/min (C)
Figure 10. Removal efficiency of formaldehyde, COD and TOC on Pd/GO/GE electrode (A-C) by
applying high formaldehyde concentration. Current density: 15 mA cm-2. Supporting electrolyte: 0.5M Na2SO4. Initial concentration of formaldehyde: 1500 mg L-1.
4. CONCLUSION
(1) A modified Pd/GO/graphite electrode was prepared successfully, characterized by SEM, EDS, XRD, XPS and cyclic voltammetry, the modified electrode had a good structure and electro-catalytic performance.
(2) The as-deposited Pd/GO/graphite modified electrode was applied to electro-degradation formaldehyde. When the electrolyte was 0.5 mol L-1 Na2SO4, current density was 15 mA cm-2, initial
[image:14.596.119.471.229.512.2]
(3) The degradation followed pseudo-first-order reaction process. Our work demonstrates the good prospect of the developed Pd/GO/graphite modified electrode for electrochemical degradation formaldehyde.
Reference
1. S. Achmann, M. Hmmerle, R. Moos, Electroanalysis, 20 (2008) 410.
2. M.B. Ali, M. Gonchar, G. Gayda, S. Paryzhak, M.A. Maaref, N. Jaffrezic-Renault, Y. Korpan, Biosens. Bioelectron, 22 (2007) 2790.
3. R. Knake, P. Jacquinot, P.C. Hauser, Electroanalysis 13 (2001) 631.
4. A.A. Mohamed, A.T. Mubarak, Z.M.H. Marestani, K.F. Fawy, Talanta, 74 (2008) 578.
5. Y.I. Korpan, M.V. Gonchar, A.A. Sibirny, C. Martelet, A.V. El’skaya, T.D. Gibson, A.P. Soldatkin, Biosens. Bioelectron, 15 (2000) 77.
6. X.Q. Zhao, Z.Q. Zhang, Talanta, 80 (2009) 242.
7. N. Lu, J.J. Pei, Y.X. Zhao, Building and environment, 57 (2012) 253. 8. W. Chen, J.S. Zhang, Z. Zhang, ASHRAE Teans, 112 (2005) 1101.
9. X. Bai, T. Metz, F. Ossler, Molecular and Biomolecular Spectroscopy, 60 (2004) 821. 10.T.N. Obee, Environ Sci Technol, 30 (1996) 3578.
11.Y. You, S.Y. Zhang, L. Wang, Applied surface science, 258 (2012) 3469. 12.C.L. Wu, Applied surface science, 319 (2014) 237.
13.H.X. Ding, A.M Zhu, X.F. Yang, J Phys D Appl Phys, 38 (2005) 4160. 14.X.B. Zhu, X. Gao, Q. Rui, Applied catalysis B-environmental, 170(2015) 293. 15.Q. Xu, Y. Zhang, J. Mo, X. Li, Environ Sci Technol, 45 (2011) 5754.
16.N.L. Gilbert, M. Guay, D. Gauvin, Atmos Environ, 42(2008) 2424. 17.H. Schmitz, U. Hilgers, M. Weidner, New Phytol, 147 (2000) 307.
18.H. Karadeniz, B. Gulmez, F. S ahinci, A. Erdem, G.I. Kaya, N. Unver, B. Kıvcak, M. Ozsoz, J. Pharm. Biomed. Anal, 33 (2003) 295.
19.S.M. Pawar, A.V. Moholkar, P.S. Shinde, K.Y. Rajpure, C.H. Bhosale, Journal of Alloys and Compounds, 459 (2008) 515.
20.J. Vazquez-Arenas, R. Cruz, L.H. Mendoza-Huizar, Electrochimica Acta, 52 (2006) 892. 21.I. Danaee, Journal of Electroanalytical Chemistry, 662 (2011) 415.
22.M. Li, C.P. Feng, W.W. Hu, Journal of hazardous materials, 162 (2009) 455. 23.Y.Y. Chu, D. M. Zhang, L.Liu, Journal of hazardous materials, 252 (2013) 306. 24.Y.R. Zhang, Y. Nan, Journal of hazardous materials, 244 (2013) 295.
25.A. Safavi, N. Maleki, F. Farjami, E. Farjami, Journal of Electroanalytical Chemistry, 626 (2009) 75.
26.R. Ojani, J.B. Raoof, S. Safshekan, Electrochimica Acta, 138 (2014) 468. 27.Y. Liu, H.L. Liu, Electrochimica Acta, 53 (2008) 5077.
28.A. Levent, Y. Yardım, Z. S. enturk, Electrochim. Acta, 55 (2009) 190. 29.A. Ozcan, Y. S, ahin, Electroanalysis, 21 (2009) 2363.
30.H. Karadeniz, B. Gulmez, F. S ahinci, A. Erdem, G.I. Kaya, N. Unver, B. Kıvcak, M. Ozsoz, J. Pharm. Biomed. Anal, 33 (2003) 295.
31.M.M. Zhang, J.M. Xie, Q. Sun, Electrochimica Acta, 111 (2013) 855. 32.L. Zhang, H. Wang, X.C. Li, Electrochimica Acta, 172 (2014) 42. 33.Z.L. Wen, S.D. Yang, Y.Y. Liang, Electrochimica Acta, 56 (2010) 139.
36.B. Seger, P.V. Kamat, Journal of PhysicalChemistry C, 113 (2009) 7990.
37.F. Cheng, H. Wang, Z. Sun, M. Ning, Z. Cai, M. Zhang, Electrochemistry Communications, 10 (2008) 798.
38.Z.Z. Zhu, Z. Wang, H.L. Li, Journal of Power Sources, 186 (2009) 339. 39.Z. Wang, Z.Z. Zhu, J. Shi , H.L. Li, Applied Surface Science, 253 (2007) 8811. 40.C. Lamy, Electrochim. Acta, 29 (1984) 1581.
41.M. Gholamian, A.Q. Contractor, J. Electroanal. Chem, 289 (1990) 69. 42.G.Y. Gao, D.J. Guo, H.L. Li, Journal of Power Sources, 162 (2006) 1094. 43.C. Jiang, H. Chen, C. Yu, S. Zhang, Electrochim Acta, 54 (2009) 1134.
44.Reza Ojani, Jahan-Bakhsh Raoof, Yusef Ahmady-Khanghah, Saeid Safshekan International Journal of Hydrogen Energy, 38 (2013) 5457.
45.W.Z. Tang, C.P. Huang, Chemosphere, 33 (1996) 1621.
46.R.M. Liou, S.H. Chen, M.Y. Hung, C.S. Hsu, J.Y. Lai, Chemosphere, 59 (2005) 117.
47.V. Selvaraj, A. Nirmala Grace, M. Alagar, Journal of Colloid and Interface Science, 333 (2009) 254.