Int. J. Electrochem. Sci., 10 (2015) 8028 - 8040
International Journal of
ELECTROCHEMICAL
SCIENCE
www.electrochemsci.orgEffect of Cr Content on Microstructure and Mechanical
Properties of Low Carbon Steel Welds
Hee-jin Lee, Hae-woo Lee*
Department of Materials Science and Engineering, Dong-A University, 840 Hadan-dong, Saha-gu, Busan 604-714, Korea
*
E-mail: [email protected]
Received: 9 July 2015 / Accepted: 10 August 2015 / Published: 26 August 2015
The effect of Cr content on the formation of acicular ferrite was investigated in low carbon steel welds where submerged arc welding was performed. Three specimens with different Cr content were fabricated and their properties were evaluated. Upon analyzing the microstructure of the welds using optical microscopy, it was observed that a specimen with higher Cr content showed a lower Widmanstatten ferrite content, whereas the proportion of acicular ferrite was increased. Acicular ferrite improves the toughness of welds, and when present in the microstructure, it acts as an obstacle to cleavage fracture. A higher impact absorption energy was measured in a specimen with finer acicular ferrite structures from the impact test. In addition, since Cr is a ferrite-stabilizing element, a higher hardness value was measured for a specimen with higher Cr content. The electrochemical test result showed that as the Cr content increased, the corrosion potential increased and the corrosion current density decreased.
Keywords: metals, welding, mechanical properties, electron backscattering diffraction (EBSD)
1. INTRODUCTION
various dedicated offshore wind power installation vessels are being proposed because offshore wind power structures with integrated upper and lower parts are being developed. Jack-up leg, usually used in offshore wind power structures, has a diverse range of applications. For legs used in offshore wind power installation vessels and jack-up rigs for drilling, development of steel welding technology for ultra-thick plate is necessary since an increase is expected in the demand for new offshore structures because of increased safety and environmental regulations. Since jack-up leg and rack & chord, which are core components of a wind power installation barge, a high value-added special vessel, are all dependent on foreign countries, their domestic development in South Korea is urgently required. In addition, since an offshore structure stays at one place for a long time once installed, there are limitations on the maintenance and repair when equipment fails. The environments where offshore structures are installed are mostly extreme locations with temperatures as low as -40C, and deep seas compared to those of ships. Because they are exposed to much wider external environments, excellent performance is required. Therefore, the rack & chord used in offshore structures must be manufactured with high precision. To be used as offshore structures in accordance with such trends, the low temperature toughness evaluation of steel is important. In the case of deep seas, ultra-high pressure resistance must be excellent.[1,2]
In this study, three specimens of welds were fabricated by changing the Cr content in low carbon steel, and their properties were evaluated to determine their suitability for jack-up leg. Cr is an element that increases the strength of welds and their ability to harden, and is known as an element that promotes an increase in the proportion of acicular ferrite. Acicular ferrite has a desirable microstructure, increasing the toughness and strength of welds.[3,4] Therefore, this study was conducted to investigate the effect of Cr addition on the formation of acicular ferrite at welds. Using an optical microscope, changes in the microstructure with Cr content were observed, and through electron back scattering diffraction (EBSD), the crystallographic structure and crystal grain size distribution were determined. Through a tensile test and Charpy-V Notch impact test, the effect of acicular ferrite on the mechanical properties was examined, and through an electrochemical test, the corrosion resistance was evaluated.
2. TEST METHOD
2.1 Welding materials and conditions
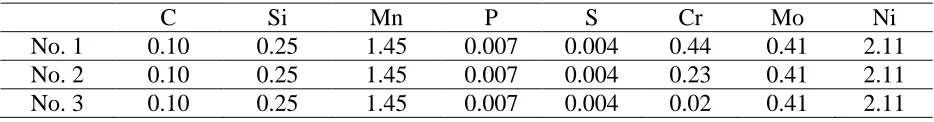
Table 1. Chemical composition of weld metal (wt%)
C Si Mn P S Cr Mo Ni
No. 1 0.10 0.25 1.45 0.007 0.004 0.44 0.41 2.11
No. 2 0.10 0.25 1.45 0.007 0.004 0.23 0.41 2.11
No. 3 0.10 0.25 1.45 0.007 0.004 0.02 0.41 2.11
Table 2. Welding condition
Manufacture Dia (mm) Current (A) Voltage (V) Welding speed (mm/sec) Heat input (kJ/mm) No. 1
4.0 600 30 5 3.6
No. 2 No. 3
Preheating Temperature: 120C Inter pass Temperature: 150C Shielding gas: 80% Ar + 20% CO₂
Polarity: DCEP
2.2 Observation of the macro and microstructure
To observe the macro and microstructures of each weld, machine processing, grinding, and polishing were performed. The macrostructures were observed using a low-magnification microscope after corroding for 10 s with Nital 3%, and the microstructures were observed using an optical microscope after corroding with Nital 7%. The crystallographic structure and crystal grain size distribution were determined using EBSD.
2.3 Mechanical property evaluation
For the hardness measurement of welds, a micro Vickers hardness tester, FV-700 was used. Here, the test load and dwell time were set at 500 gf and 10 s, respectively, and the hardness measurement was performed at the center of the weld at 1 mm intervals. The impact test was conducted at -20C, -40C, and -60C for each specimen by using the Charpy V-notch impact tester, and the tensile test was conducted by collecting the tensile specimens from the deposited metal in parallel with the welding direction according to ASTM A 370-11.
2.4 Electrochemical test
[image:3.596.66.530.208.347.2]
respectively. The electrochemical test was conducted in 0.1 M HCl aqueous solution, between -1 V and 1 V and a scan rate of 1 mV/s.
3. RESULTS AND DISCUSSION 3.1 Macrostructure
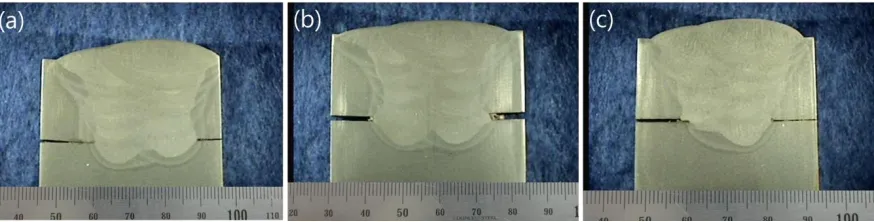
Cross-sectional macrostructures of the weldments formed using SAW are shown in Fig. 1. Compared to the affected zone on the base metal side right next to the fusion line, the heat-affected zone formed between the weld layers during multi-pass welding showed noticeable differences in the microstructure as well as impact properties. The grain-coarsening region of the affected zone in the base metal side is the most vulnerable in the weld. On the other hand, at the heat-affected zone produced inevitably between weld layers during multi-pass welding, the impact value and strength are improved by decomposition of the grain boundary ferrite and the Widmanstatten ferrite, which are vulnerable structures, to fine polygonal ferrite and pearlite, which have relatively excellent toughness. [5–7]
Figure 1. Macrostructures of weldment (a) No. 1, (b) No. 2, (c) No. 3
3.2 Microstructure analysis
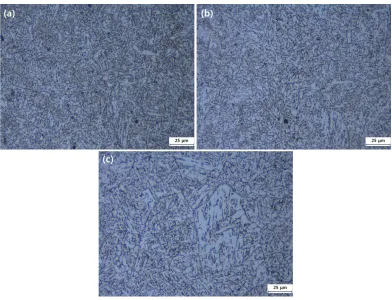
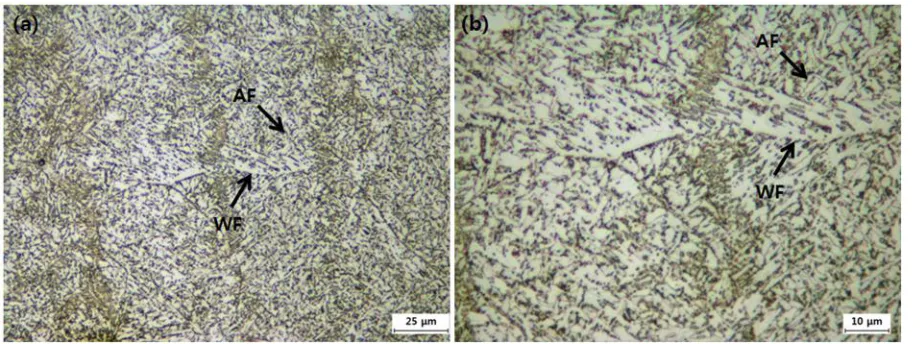
3.2.1 Microstructure of weld according to added amount of Cr
[image:4.596.84.521.384.495.2][image:5.596.104.496.213.513.2]
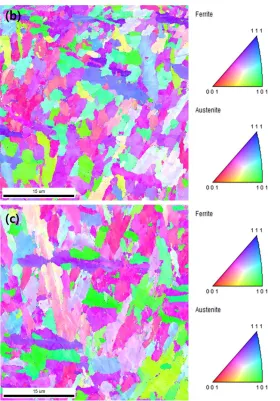
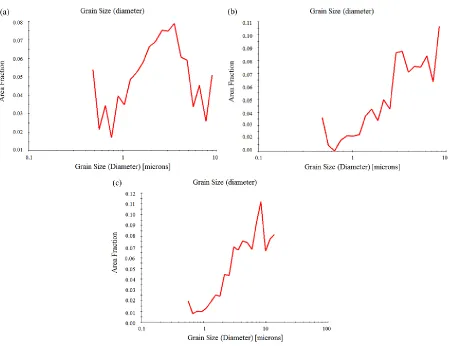
In addition, the grain size of the microstructure, crystal orientation distribution, and phase fraction were measured using EBSD. The crystal orientation distribution is shown in Fig. 3, which shows the IPF (Inverse Pole Figure) maps of EBSD, and the crystal orientation distribution is viewed as different colors. Growth is observed in the [100], [110], and [331] directions of acicular ferrite. [9] It is observed that the grain size increases from (a) to (c) in Fig. 3. In the next section, the effect of microstructure on the mechanical properties, examined through the grain size distribution and phase map using EBSD, is discussed.
[image:5.596.158.439.554.753.2]
Figure 3. EBSD inverse pole figure map of weld metal (a) No. 1, (b) No. 2, (c) No. 3
3.2.2 Effect of acicular ferrite
that the acicular ferrite is not formed well. [8] Therefore, if the inclusion does not exist, more bainite will be formed compared to acicular ferrite. If bainite is also present inside the microstructure, it will hider crack propagation and will aid the toughness of the weldment, but it will not be more effective than acicular ferrite.
Furthermore, as shown in Fig. 4, the acicular ferrite exists mutually interlocked with the Widmanstatten ferrite. The irregular arrangement of the ferrite plate increases the toughness of the weldment, and it is reported that because of the crystallization and disorder of acicular ferrite a better toughness is observed compared to bainite. [18, 19] The inclusions for nucleation of acicular ferrite decrease elements such as C, Mn, and Si of austenite. Such a decrease in the elements leads to an increase in the driving force for nucleation on the inclusion surfaces.[20]
Figure 4. Acicular ferrite and Widmanstatten ferrite microstructure in weld metal (a) 500x, (b) 1000x
3.3 Impact properties
Fig. 5 shows the impact test results at test temperatures of -20℃, -40℃, and -60℃. As shown in the graph, a specimen with more Cr had higher absorbed energy. The value of the absorbed energy in the impact test is the energy required to fracture the specimen. Cr is a ferrite stabilizing element and an element promoting the increase in the acicular ferrite fraction inside the weldment. Acicular ferrite is a desirable structure from a toughness aspect for resisting impact because the grains are fine and dense. Therefore, a specimen with higher Cr content has a higher impact energy because the acicular ferrite content is increased.
[image:7.596.73.533.267.439.2]
moving a dislocation in crystal. This stress is related to the yield strength and temperature. As the temperature drops, the movement of potential is slowed down and the force required in moving the potential becomes larger, increasing the Peierls stress and the yield strength of the material. In other words, the yield strength and the toughness of a material are inversely related. Therefore, as the temperature drops, a lower absorbed energy is observed.
Figure 5. Results of Charpy V-notch impact tests for weldments
[image:8.596.195.401.185.343.2] [image:8.596.76.526.397.743.2]
3.4 Tensile strength and hardness
In Fig. 7, the tensile test results of the weldment, i.e., yield strength, tensile strength, and elongation are shown. It can be seen that the yield strength of No. 1, No. 2, and No. 3 specimens increase gradually. This is because of the differences in the Cr content. When a specimen has more Cr, the fraction of acicular ferrite increases, and disordered arrangements of such acicular ferrite hinder the propagation of cracks and affect the toughness improvement of the weldment. However, the toughness and the yield strength are inversely related. Therefore, because a specimen with higher Cr content has a larger amount of acicular ferrite with excellent toughness, it was observed that the yield strength value is low in the tensile test result.
[image:9.596.55.556.264.460.2]Figure 7. Tensile strength test results (a) Tensile strength and Yield strength, (b) Elongation
[image:9.596.168.429.517.712.2]
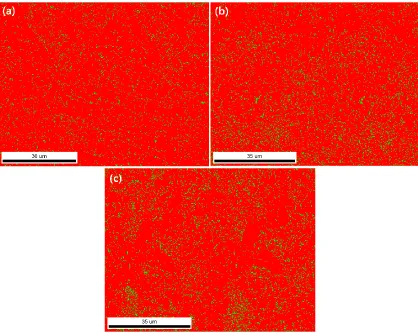
Figure 9. EBSD phase map of weld metals (a) No. 1, (b) No. 2, (c) No. 3
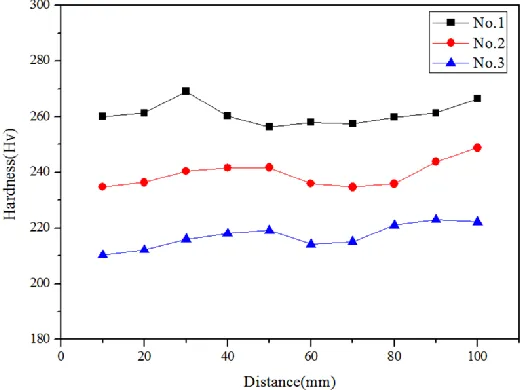
Fig. 8 shows the measured values of hardness for each weld metal. Specimen No. 1 has the relatively highest hardness value. It seems that higher the Cr content, the higher is the hardness value. This result can be explained by analyzing the results of Fig. 8 and Table 3. Fig. 9 is a result of the analysis of the phase of weld metals through phase maps. The red color shows the ferrite and the green color shows the austenite, and the fraction of each phase is shown in Table 3. When a specimen has a higher Cr content, it can be confirmed that the fraction of ferrite is higher, and in general, ferrite is known to have a higher strength than the austenite structure. As a result, the hardness of specimen No. 1, with a high ferrite content because of Cr, was higher.
Table 3. Phase fraction of the weld metals (%)
Specimens Fraction of Ferrite Fraction of Austenite
No. 1 94.4 5.6
No. 2 91.6 8.4
3.5 Electrochemical Test
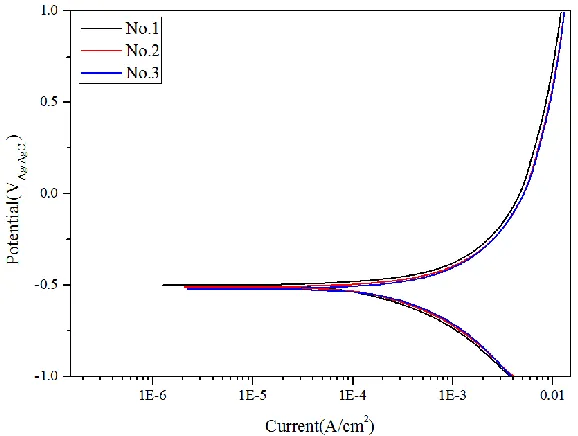
Fig. 10 exhibits a potentiodynamic polarization curve of each specimen in 0.1 M HCl. A passive state is not formed in every specimen, and an active corrosion behavior is observed whereby the current density increases according to the increase in potential. Since Cl- present in the aqueous solution changes the water solubility of a passive state film, no passive state is observed. In the corrosion test performed, a typical polarization behavior of uniform corrosion is observed whereby the dissolved Fe cations are converted into an oxide on the surface of the electrode and corrosion occurs evenly on the entire surface of the specimen. [22–24] Corrosion potential (Ecorr), corrosion current density (Icorr), βc, and βa which are corrosion parameters can be obtained by expanding the Tafel region on the polarization curve, and the results are shown in Table 4. It has been reported that in general, Cr forms Cr oxide, which is a surface oxide, and enhances the corrosion resistance of the alloy in salt solution. [25-27] The Cr oxides resulting from the addition of Cr reduced oxidation and reduction reactions. [28] As shown in the corrosion test results of Table 4, as the Cr content increased, the corrosion potential increased and the corrosion current density decreased. Similar to previous reports, the specimens of the corrosion test performed in this study did not have a large enough difference in Cr content to show a clear degree of corrosion.
[image:11.596.154.443.382.600.2]Figure 10. Corrosion test results of weld metal in 0.1 M HCl
Table 4. Corrosion potential and current of weld metal
Specimens Ecorr (mV) Icorr (μA/cm2) βc (mV/dec) βa (mV/dec)
No. 1 -500.920 241.625 418.274 224.811
No. 2 -510.965 429.239 596.667 286.188
[image:11.596.45.552.673.734.2]
4. CONCLUSION
The microstructure and mechanical properties of low carbon steel welds with Cr addition are as follows.
1. Cr is an element that increases the strength of welds and their ability to harden, and promotes an increase in the proportion of acicular ferrite. From the microstructural analysis, more acicular ferrite was observed at the weldment in a specimen with higher Cr content.
2. Since acicular ferrite improves the toughness and strength of a weldment, as it becomes finer, it acts as an obstacle for cleavage fracture. In the grain size distribution using EBSD, a specimen with higher Cr content showed a higher micrograin distribution. Therefore, when the Cr content increased, a higher absorbed energy was measured in the impact test results.
3. Since the toughness and yield strength are inversely proportional, the value of yield strength obtained from the tensile test is low for a specimen in which a high fraction of acicular ferrite was formed because a large amount of Cr was added. In addition, because Cr is a ferrite-stabilizing element, the measured hardness value of a specimen with higher ferrite content was higher.
4. The result of the electrochemical test shows that as the Cr content increases, the corrosion potential increases and the corrosion current density decreases.
ACKNOWLEDGEMENT
This investigation was supported by the Dong-A University Research Fund. References
1. European Committee for Standardisation, Eurocode 3: Design of steel structures – Part 1-10: Material toughness and through-thickness properties (2005)
2. I. P. Kim, Y. Heo, Y. S. Park and T. Y. Yoon, J. KSCE, 56(10) (2008), 59
3. J. C. F. Jorge, L. F. G. Souza, J. M. A. Rebello and G. M. Evans, Mater. Charact., 47(3) (1992), 195
4. R. A. Ricks, P. R. Howell and G. S. Barritte, J. Mater. Sci., 17(3) (1982), 732
5. A. Joarder, S. C. Saha and A. K. Ghose, Welding Research Supplement, 70 (1991), 141
6. C. L. Jenney and A. O’Brien, Welding Handbook, Vol. 1(8th), pp. 368, American Welding Society (1987)
7. J. H. Jeon, J. Y. Hong and H. W. Lee, Korean J. Met. Mater., 51(1) (2013), 033 8. M. Honjo and Y. Saito, ISIJ, 40 (2000), 914
9. R. A. Farrar and P. L. Harrison, J. Mater. Sci., 22 (1987), 3812
10. S. Babu, Ph.D. Thesis, pp. 1–15, University of Cambridge, England (1991) 11. S. W. Kang, M. H. Kim, W. T. Shin and H. W. Lee, J. SNAK, 41 (2004), 41 12. K. H. Kim, H. J. Kim and M. Y. Huh, JWJ, 27 (2009), 14
13. G. L. F. Powell and G. Herfurth, Metall. Mater. Trans. A, 29A(11) (1998), 2775 14. G. Thewlis, Mater. Sci. Tech., 2(10) (1994), 110
15. J. H. Tweed and F. F. Knott, Acta Metall., 35(7) (1987), 1401
16. S. W. Thompson, D. J. Colvin and G. Kraus, Metall. Mater. Trans., 27A(6) (1996), 1557 17. H. K. D. H. Bhadeshia, Bainite in steels. 2nd ed. Carlton House Terrace, London: IOM
Communications Limited (2001)
18. M. Diaz-Fuentes, A. Iza-Mendia and I. Gutierrez, Metall. Mater. Trans. A, 34A (2003), 2505 19. S. S. Babu, Curr. Opin. Solid State Mater. Sci., 8 (2004), 267
21. R. Peierls, Proc. Phys. Soc., 52 (1940), 34
22. M. J. Jang, Y. W. Jang, Y. Y. Ha, J. J. Kim and J. K. Kim, Korean J. Electrochem. Soc., 13 (2010), 96
23. D. A. Jones, Principles and Prevention of Corrosion, pp.109–132, Prentice Hall, New Jersey (2007) 24. E. M. Sherif, R. M. Erasmus and J. D. Comins, Electrochim. Acta, 55 (2010), 3657
25. S. A. Park, W. S. Ji and J. G. Kim, Int. J. Electrochem. Sci., 8 (2013), 7498 26. J. W. Schultze and M. M. Lohrengel, Electrochim. Acta, 45 (2000), 2499 27. P. Schmuki, J. Solid State Eletrochem., 6 (2002), 145
28. S. W. Kim and H. W. Lee, Int. J. Electrochem. Sci., 9 (2014), 4709