Int. J. Electrochem. Sci., 8 (2013) 11264 - 11277
International Journal of
ELECTROCHEMICAL
SCIENCE
www.electrochemsci.org
A Novel Sensor of Quinazolin Derivative Self-Assembled
Monolayers over Silver Nanoparticles for the Determination of
Hydroxylamine
Navid Nasirizadeh1,2,*, M. Mehdi Aghayizadeh1, S. Mansour Bidoki2, M. Esmail Yazdanshenas1
1
Department of Textile Engineering, Yazd Branch, Islamic Azad University, Yazd, Iran
2
Scientific Society of Nanotechnology, Yazd Branch, Islamic Azad University, Yazd, Iran
3
Department of Textile, Yazd University, Yazd, Iran
*
E-mail: [email protected]
Received: 11 June 2013 / Accepted: 19 July 2013 / Published: 20 August 2013
The electrochemical study of a quinazolin silver nanoparticles−modified glassy carbon electrode (QMSNPs−GCE) as well as its efficacy for electrocatalytic oxidation of hydroxylaminein presence of such self−assembled monolayer (SAM) modified electrodeis described. The QMSNPs−GCE demonstrated a highly catalytic activity in hydroxylamine oxidation. Results indicated that hydroxylamine peak potential at QMSNPs−GCE shifted for 170 and 260 mV to negative values compared to quinazolin−modified glassy carbon electrode (QMGCE) and silver nanoparticles coated glassy carbon electrode (SNPs−GCE) respectively. It was also shown that a combination of SNPs and modifier definitely improves the characteristics of hydroxylamine oxidation. The surface charge transfer rate constant, ks, and the charge transfer coefficient, α, for electron transfer between GCE and
electrodeposited quinazolin modified GCE were calculated as 39.5±1.1 s−1 and 0.53 respectively at pH=7.The electron transfer coefficient, α, and the heterogeneous rate constant, k′, for the oxidation of hydroxylamine at QMSNPs−GCE were also determined by cyclic voltammetry measurements. Furthermore, amperometric detection of hydroxylamine was carried out at 270 mV in a 0.1 M phosphate buffer solution (pH 7.0) resulting in two linear response ranges of 1.0−101.5 µM and 101.5−9410.8 µM and the limit of detection of 0.38 µM. Moreover, QMSNPs−GCE was successfully used to determine hydroxylamine in various water samples.
Keywords: Quinazolin, Hydroxylamine, ElectrocatalyticOxidation, Silver Nanoparticles, Self−Assembled monolayer layer.
1. INTRODUCTION
have found wide applications in analytical methods [2−5]. Different kinds of nanomaterials, such as metals, metal oxides, semiconductor nanoparticles and carbon based materials have been used for fabricating electrochemical sensors and biosensors [6−9].
Among these nanomaterials, metallic nanoparticles have attracted much more attention in electro−analysis because of their excellent physical and chemical propertiessuch as large surface−to−volume ratio, good electrical properties, strong adsorption ability, high surface reaction activity, small particle size and good surface properties [10, 11]. The unique properties of metal nanoparticles make them highly suitable for designing and improving electrochemical sensors and biosensors [12]. Various nanoparticles such as Au, TiO2, Pt, Cu, Pd, Ni and Ag were studies in the
recent decades amongst them, silver nanoparticles (SNPs) attracted considerable interests because of their unique properties such as the capacitance character, excellent biocompatibility, good electrical conductivity and high catalytic activity [10, 13]. Recently, SNPs have gained in popularity and have been widely applied in construction of electrochemical sensors and biosensors [11, 14, 15]. For example Rounaghi et al. described the use of a crown ether and silver nanoparticle as modifiers in carbon paste electrodes for measurement of 4−nitrophenol [10]. Lian et al. developed an imprinted electrochemical sensor for neomycin recognition based on chitosan−silver nanoparticles (CS−SNP)/graphene−multiwalled carbon nanotubes (GR−MWCNTs) composites decorated gold electrode [11]. Zhou et al. fabricated a H2O2 biosensor based on the immobilization of sacrosine
oxidase (SOX) on SNPs and graphene–chitosan composite film modified glassy carbon electrode (GCE) [13].
Self−assembled monolayers (SAMs) of S−functionalized compounds on metals were used in preparing chemical interfaces with stable and structurally well−defined monolayers [16]. Using SAMs to functionalize metal surfaces provides a simple route to functionalize electrode surfaces by organic molecules. Due to the high affinity of SH groups towards metals, thiol−terminated SAMs have attracted tremendous attention for construction of biomolecular electronic devices [17]. The materials used for the SAM preparation are Au [18], Cu [19], Pt [20], Pd [21], InP [22], GaAs [23] and Ag [24]. On the other hand, surface modifications using metallic nanoparticles could largely increase the immobilized amount of S−functionalized compounds and enhance stability of SAMs layer.
In the present work, we report the preparation of a thio−quinazolin derivative self−assembled layer on SNPs and application of this modified electrode as a new electrode for determination of hydroxylamine. The thio−quinazolin derivative was deposited on SNPs surface by self−assembling procedure. A new voltammetric sensing set−up was assembled using the fabricated electrode for studying the electrocatalytic oxidation of hydroxylamine. Cyclic voltammetry and amperometryhave been also used to investigate the electrochemical properties and electrocatalytic activity of the modified electrode for determination of hydroxylamine. In previous study, we reported the characteristics of a modified electrode prepared by electrodeposition of a thio−quinazoline derivative on the multi-wall carbon nanotubes modified glassy carbon electrode (QMWCNT-GCE) [25]. The charge transfer rate constant, ks, was obtained 12.6±0.3 s−1 in pH 7.0 between thio−quinazoline and
MWCNT−GCE. While in this work, ks, is obtained 39.5±1.1 s −1
might confirm that the self−assembled layer of thio−quinazolin derivative on SNPs covered GCE improves the sensitivity, linear range, and detection limit of hydroxylamine determination.
2. EXPERIMENTAL
2.1. Materials and instrumental
Athio−quinazolin derivative, 2 − [(4, 5 – Dihydroxy – 2 − methylphenyl) thio] quinazolin − 4(3H) – one (see Scheme 1 for structure) was incorporated and purified in accordance to the method described before [26]. In the present paper, we revert to this derivative as quinazolin (Q) for simplicity. Silver nitrate, dimethyl formamide (DMF), hydroxylamine (NH2OH), and the other chemical reagents
used for preparation of the buffersolutions was analytical grades from Merck Companyand used as received.All the solutions were prepared with doubly distilled water. Hydroxylamine solutions were allprepared immediately prior to the useand all the experiments were carried out at room temperature. The phosphate buffer solution (0.1 M) was supplied with H3PO4 and the pH was adjusted using 2 M
NaOH solution. All solutions tested were deaeratedby passing highlypure nitrogen (99.999%) before the electrochemicalexperiments.
An Autolab potentiostat−galvanostat PGSTAT 30 (Eco Chemie, Ultrecht, Netherlands) equipped with GPES 4.9 software, in connection with a three−electrode system and a personal computer was used for electrochemical measurements. The geometric area of quinazolin silver nanoparticles−modified glassy carbon working electrode (QSNPs−GCE) was 0.0314 cm2. A platinum
electrode (Azar Electrode Co, Iran) and a saturated calomel electrode (SCE) were used as the counter and reference electrodes respectively. All the potentials in the context are quoted versus this reference electrode. The pH measurements were done with a Metrohm model 827 pH/mV meters.
2.2. Electrodes preparation
Prior to modification, the bare glassy carbon electrode was polished consecutively with 0.05 μm Al2O3 slurry on apolishingcloth and then rinsed with doubly distilled water after each polishing
step. Then, the electrode was consecutively inserted in 1:1 nitric acid, absolute ethanol and doubly distilled water in ultrasonic bath for 2 min. After being washed again with distilled water, the bare GCE (BGCE) was modified by acontinuous potentialcycling from–0.7 to 1.9 V at a sweep rate of 80 mV s−1 for 11 cycles in a solution containing 100 mM nitric acid and 1 mM AgNO3 [27]. Finally, the
quinazolin layer on SNPs−GCE surface, the modified electrodewas rinsedthoroughly with distilled water and was dipped into the buffersolution for testing its electrochemical behavior.
3. RESULTS AND DISCUSSION
3.1. Electrochemical behavior of QMSNPs−GCE
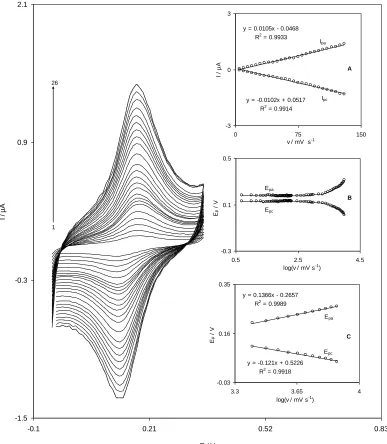
The cyclic voltammograms of a QMSNPs−GCE in a 0.1 M phosphate buffer (pH 7.0) at various scan rates are shown in Fig. 1.
-1.5 -0.3 0.9 2.1
-0.1 0.21 0.52 0.83
E / V
I
/
µ
A
y = 0.1366x - 0.2657 R2 = 0.9989
y = -0.121x + 0.5226 R2 = 0.9918 -0.03
0.16 0.35
3.3 3.65 4
log(v / mV s-1)
E
p
/ V
y = 0.0105x - 0.0468 R2 = 0.9933
y = -0.0102x + 0.0517 R2 = 0.9914
-3 0 3
0 75 150
v / mV s-1
I
/
µ
A
-0.3 0.1 0.5
0.5 2.5 4.5
log(v / mV s-1)
E
p
/ V
1 26
Ipa
Ipc
Epa
Epc
A
B
C
Epa
Epc
[image:4.596.103.490.244.688.2]
The plots of the anodic and cathodic peak currents versus the scan rate exhibit a linear relation (Fig. 1A) as predicted theoretically for a surface−immobilized redox couple. In addition, the ratio of cathodic to anodic peak currents at various scan rates was almost constant. Moreover, because of the facility of charge transfer kinetics over the range of 5 to 1000 mV s−1, the formal potential (E'0) was
almost independent of the potential scan rate for sweep rates at this range.
The formal potential (E'0) value, which was obtained from the equation of E0'=Epa–α(Epa−Epc)
[28], is about 151 mV and for sweep rates ranging from 5 to 1000 mV s−1. According to the method described by Laviron [29], the electron transfer coefficient, α, as well as the heterogeneous rate constant, ks, for the charge transfer between the electrode and the surface confined redox couple can be
calculated from the slope of variation of Ep versus log(V). Inset B of Fig. 1 shows the variations of
peak potentials (Ep) as a function of the potential scan rate. The results show that the Ep values are
proportional to the logarithm of the scan rate, for scan rates higher than 2500 mV s−1 (Fig. 1, inset C).
Using the slope of plots in Fig. 1, inset C, the average values of α=0.53 and ks=39.5±0.5 s −1
were obtained at pH 7.0. This value is greater than the previously reported values for other modifiers such as quinizarine (ks=4.44 s−1) [30], indenedione (ks=2.3 s−1) [31], and even caffeic acid (ks=11.2 s−1) [32].
Also, this value of ks is greater than the value is obtained by QMWCNT−GCE in our previous work
(ks=12.6 s−1) [25].
3.2. Electrochemistry of Hydroxylamine at QMSNPs−GCE
-0.27 0.13 0.53 0.93
0.02 0.24 0.46 0.68
E / V
I
/
µ
A
a b
c d
[image:5.596.178.421.419.689.2]e f
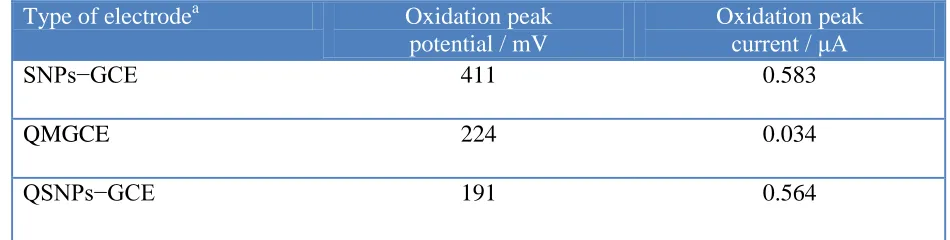
Table 1.Comparison of the electrocatalytic oxidation characteristics of hydroxylamine (0.15 mmol L−1) on various electrode surfaces at pH 7.0
Type of electrodea Oxidation peak
potential / mV
Oxidation peak current / μA
SNPs−GCE 411 0.583
QMGCE 224 0.034
QSNPs−GCE 191 0.564
SNPs−GCE: silver nanoparticles modified glassy carbon electrode, QMGCE: quinazolin modified glassy carbon electrode, QMSNPs−GCE: quinazolin silver nanoparticles modified glassy carbon electrode.
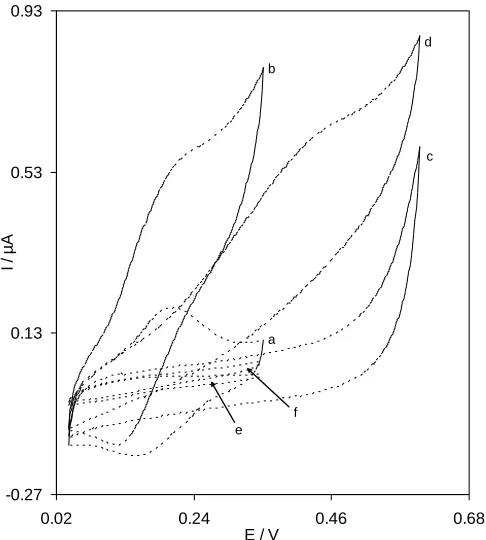
In order to test the potential electrocatalytic activity of the quinazolin layer electrodeposited on GCE towards the oxidation of hydroxylamine, cyclic voltammograms of QMSNPs−GCE (Fig. 2, curves a), SNPs−GCE (Fig. 2, curves c), and QMGCE (Fig. 2, curves e) were obtained without and with 0.15 mM hydroxylamine. In absence of hydroxylamine, an excellent redox peaks couple of QMSNPs−GCE (curve a) can be observed. After addition of 0.15 mM of hydroxylamine, there is a noticeable intensification in the anodic peak currents and a small current is observed in the cathodic peak (Fig. 2, curves b). This behavior is related to a very strong electrocatalytic effect. According to the catalytic current responses shown in voltammograms b and f, this is anoticeableincrease in anodic peak current at QMSNPs–GCE (voltammogram b) compared to the value acquired from the QMGCE (voltammogram f). Actually, the higher current responses of QMSNPs–GCE observed as compared to QMGCE can be related to the increase in the surface area of QMSNPs–GCE. The electrocatalytic oxidation characteristics of hydroxylamine at various modified electrode surfaces at pH 7.0 are summarized in Table 1. Table 1, it is concluded that the best electrocatalytic effect for hydroxylamine oxidation is gained at QMSNPs−GCE surface.Also, the peak potential of hydroxylamine oxidation at QMSNPs−GCE (curve b) shifts by about 260 mV and 170 mV toward the negative values compared with that at a SNPs−GCE (curve d) and QMGCE (curve f), respectively. This means that, the combination of SNPs and a mediator (quinazolin) definitely improves the characteristics of hydroxylamine oxidation. The peak potential of hydroxylamine oxidation at the QMSNPs−GCE in majority of situations is less positive, compared to those reported for electrodes modified with other mediators such as caffeic acid [33], coumestan derinative [34], poly(acid yellow 9)/ nano−TiO2 [35],
[image:6.596.59.534.112.232.2]
-0.08 0.08 0.24 0.4
0.04 0.18 0.32 0.46
E / V
I
/
µ
A
-1.2 -1 -0.8
0.06 0.075 0.09
E / V
lo
g
(
I
/
µ
A
)
a
a b
b c c
d d
B
1 9
A
-0.3 0 0.3 0.6
0.01 0.24 0.47 0.7
E / V
I
/
µ
A
y = 2.1687x + 0.0545 R2 = 0.9988
0.16 0.25 0.34 0.43
0.05 0.09 0.13 0.17
v1/2 / (V s-1)1/2
I
p
/
µ
A
[image:7.596.81.512.79.636.2]
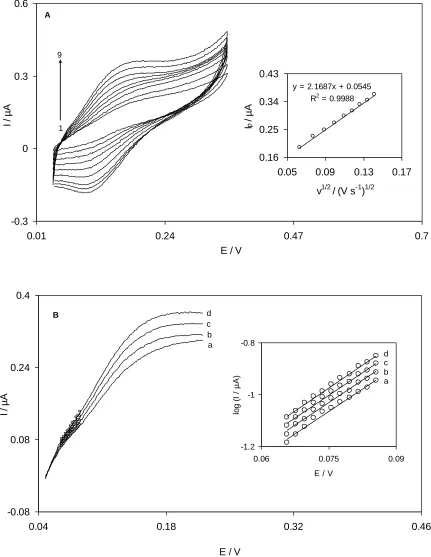
Fig. 3A showsthe cyclic voltammograms of the QMSNPs−GCE at various scan ratesobtained in 0.1 M phosphate buffer solution (pH 7.0) containing 0.07 mM hydroxylamine. The peak current for the anodic oxidation of hydroxylamine is proportional to the square root of scan rate at 4 to 20 mV s−1 (inset of Fig. 3A). This result implies that, at a sufficient overpotential, the reaction is mass transport controlled while it is the best case for quantitative applications [42]. By this plot, the approximate total number of electrons in the overall reactioncan be calculated according to the following equationfor a totally irreversible diffusion controlled process [43]:
Ip=3.01×10⁵n[(1−α)nα]1/2ACbD1/2ν1/2 (1)
Where D=4.11×10⁻⁶ cm2s−1 (diffusion coefficient of hydroxylamine obtained by chronoamperometry), (1–α)nα=0.69, Cb is the bulk concentration of hydroxylamine (mol cm−3), and A
is the electrode surface area (0.0314 cm2).
0 4 8 12
0 22 44 66
t / s
I
/
µ
A
y = 6.9914x + 0.1715 R2 = 0.9986
0 3.5 7
0 0.5 1
[Hydroxylamine] / mM
s
lo
p
e
/
µ
A
s
1
/2
0 2.8 5.6
0.4 0.56 0.72
t-1/2 / s-1/2
I
/
µ
A
A B
1 10
[image:8.596.122.477.289.668.2]1 10
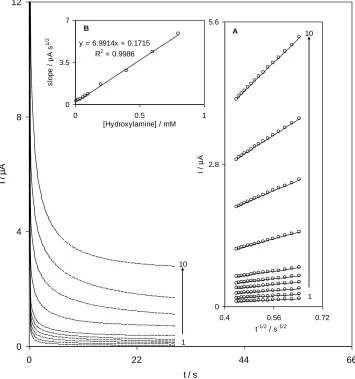
Figure 4. Chronoamperometric response at a QMSNPs−GCE in 0.1 Mphosphate buffer (pH 7.0) at a
It is estimated that the total number of electrons involved in the anodic oxidation of hydroxylamine isn=1.942. Based on the above results, one can describe the catalytic reaction (ErCi′)
mechanism of hydroxylamine at QMSNPs−GCE as shown in equations 2 and 3. For an ErCi′
mechanism, Andrieux and Saveant theoretical model [44] can be used to calculate the catalytic rate constant between hydroxylamine and quinazolin, k′. According to the theoretical model of Andrieux and Saveant and using Fig. 4 in their paper [44], the average value of k′ was calculated to be (1.2±0.03)×10−3 cm.s−1.
(2)
(3)
The overall oxidation of hydroxylamine by the modified electrode is given in equation 4.
2NH2OH → N2O + H2O + 4H++ 4e− (4)
Linear sweep voltammograms of the modified electrode in a 0.1 M phosphate buffer solution (pH 7.0) containing 0.07 mM of hydroxylamine were obtained at different scan rates varying from 4 to 20 mV s−1 (Fig 3B). In order to evaluate information about the rate−determining step, Tafel plots were drawn (inset of Fig. 3B) from points of the Tafel region of the linear sweep voltammograms.The results of polarization studies for the electro−oxidation of hydroxylamine at QMSNPs−GCE show that, for all potential scan rates, the average of the anodic Tafel slopes of the different plots was obtained as11.6 V−1. Referring to equation 5 [42], the mean Tafel slope of 11.6 V−1 concurs well with the involvement of one electron in the rate−determining step of electrode process, supposing a charge transfer coefficient of α=0.31.
Tafel slope=(1−α)nαF/2.3RT (5)
It is essential to mention that, in literatures, the number of electrons involved in the rate determining step of various processes is one. In addition, the exchange current density, J0, is obviously
readily accessible from the intercept of the Tafel plots. The average value of the exchange current density, J0, for hydroxylamine oxidation at the modified electrode surface was found to be 0.5±0.01
μA.cm−2. The value obtained for J0 of hydroxylamine at QMSNPs−GCE is higher than the exchange
current density at coumestan films (0.4 μA cm−2) [34] but it is lower than the J0 value of
hydroxylamine at oracet blue films (2.4 μA cm−2) [40].
3.3. Chronoamperometric studies
determinedat the sensor surface. The chronoamperograms of the QMSNPs−GCE in 0.10M phosphate buffer (pH 7.0) including different concentrations of NH2OH obtained at a potential step of 270 mV
are shown in Fig. 4. For an electroactive material (hydroxylamine) with a diffusion coefficient, D, the current corresponding to the electrochemical reaction (under diffusion control) is delineated by Cottrell equation [42]:
I=nFAD1/2C/π1/2t1/2 (6)
where D and C are the diffusion coefficient (cm2s−1) and bulk concentration (mol.cm−3) of the analyte respectively. Fig. 4A, shows the tentative plots of I againstt−1/2 for different concentrations of hydroxylamine employed in the experiments. The slopes of the resulting straight lines were then plotted versus the hydroxylamine concentration (inset B) which from its slope we found a diffusion coefficient of 4.11×10⁻⁶ cm2s−1 for hydroxylamine. The calculated diffusion coefficient is in a good consent with that previously reported values obtained for hydroxylamine [43].
3.4. Amperometric detection of hydroxylamine at a QMSNPs−GCE
-0.06 1.66 3.38 5.1
0 1600 3200 4800
t / s
I
/
µ
A
A
B
y = 0.0048x + 0.0414 R2 = 0.9995 0
0.2 0.4 0.6
0 38 76 114
[Hydroxylamine] / µM
I
/
µ
A
y = 0.0004x + 0.513 R2 = 0.9994 0
1.6 3.2 4.8
0 3400 6800 10200
[Hydroxylamine] / µM
I
/
µ
A
-0.3 0.15 0.6
0 1000 2000
t / s
I
/
µ
A
C
[image:10.596.158.441.366.691.2]
Amperometry under stirred condition has a much higher current sensitively than cyclic voltammetry and it can be used for determination in the linear range and to estimate the lowest limit of detection of hydroxylamineby a QSNPs−GCE. Fig. 5A shows amperograms which were recorded for a rotating QSNPs−GCE (rotation speed 2000 rpm), under conditions where the potential was held at 270 mV in different concentrations of 1.0−9410.8 µM of hydroxylamine. As shown in Fig. 5, even at very low concentrations such as 1.0 or 10.0 mMof hydroxylamine, very niceand specific responses can be observed in amperograms. After each step of addition of hydroxylamine, a sharp rise in the current was perceived within a response time less than 2 seconds. Also, Fig. 5B and 5C clearly show that the plot of the peak current against the hydroxylamine concentration is formed of two linear segments of 1.0−101.5 and 101.5−9410.8 µM with different slopes. In accordance with the procedure reported in the reference [44], the lower limit of detection, Cm, was procured to be 0.38 µM by utilizing the
equation Cm=3sbl/m, where sbl is the standard deviation of the blank response and m is the slope of the
[image:11.596.60.539.349.592.2]calibration plot in the confine of 1.0−105.5 µM of hydroxylamine (0.0048 µA µM−1).
Table 2. Comparison of the analytical parameters of the hydroxylamine oxidation at various modified electrode surfaces
Modifier electrode Linear range
(µM)
Sensitivity (µA µM)
Limit of detection (µM)
Ref
Caffeic acid 2.5−1000 3.16 0.40 [33]
A coumestan derivative 1.0−40.0 6.10 0.61 [34]
Poly(acid yellow 9)/nano−TiO2
12.0−120.0 − 2.0 [35]
Rutin MWCNT 1.0−33.8
33.8−81.7
0.0228 0.025
1.0 [38]
Triazole 0.10−10.0
10.0−600.0
0.083 0.01 [38]
Hematoxylin 2.0−122.8 0.0208 0.68 [37]
Nickel hexacyanoferrate 1.0−50.0 0.0046 0.024 [39]
Indenedione derivative 1.0−10.0 10.0−100.0
0.1955 0.0841
0.8 [40]
QMSNPs−GCE 1.0−101.5
101.5−9410.8
0. 0048 0.0004
0.38 This work
5A) indicates that after an initiatory decline of current, the response of QMSNPs−GCE has remained almost stable during the whole experiment. It seems to be logical to conclude that there is no suppressive effect of hydroxylamine and its oxidation product (s) on the modified electrode surface. Hence QMSNPs−GCE was found to have outstanding aadvantages such ashigh sensitivity, fast response time, a good limit of detection and a comprehensive linear range for hydroxylamine determination.
[image:12.596.117.481.329.497.2]The utility of the present hydroxylamine sensor for the determination of hydroxylamine in real samples was tested by measuring hydroxylamine in two water samples. In order to run the test, 3 ml of fresh water sample was diluted to 10 mL with a 0.1 M phosphate buffer solution (pH 7.0). Then, definite amounts of hydroxylamine were added and responses of the sensor having QMSNPs−GCE as working electrode were determined in amperometric measurements. The measurements were done using the calibration plots shown in the Fig. 5B. The results are summarized in Table 3.
Table 3. Determination of hydroxylamine concentration in two water samples with QMSNPs−GCE.
Recovery % RSD (%)
Found (µM) Added (µM)
Samples
– 99.3 102.1 –
2.6 2.1 Not found
24.82 51.05 –
25.00 50.00 Well water
– 101.7
98.5 –
3.0 2.3 Not found
30.51 59.10 –
30.00 60.00 Tap water
The results that were obtained by the amperometric technique showed satisfactory recovery, demonstrating that the QMSNPs−GCE could be efficiently used in practical applications.
4. CONCLUSIONS
concentration ranges for hydroxylamine are the great advantages of the newly introduced modified electrode. Finally, it has emerged that amperometric method can be used as an analytical method to determine hydroxylamine in two water samples using the proposed modified electrode.
References
1. X. Tian, C. Cheng, H. Yuan, J. Du, D. Xiao, S. Xie and M. Choi, Talanta, 93 (2012) 79. 2. S. Prakash, T. Chakrabarty, A. K. Singh and V. K. Shahi, Electrochim. Acta., 72 (2012) 157. 3. S. Prakash and V.K. Shahi, Anal. Met., 3 (2011) 2134.
4. R. S. Babu, P. Prabhu and S. S. Narayanan, Talanta, 110 (2013) 135. 5. T.G.S. Babu and T. Ramachandran, Electrochim. Acta., 55 (2010) 1612. 6. H. Gao, X. Qi, Y. Chen and Wei Sun, Anal. Chim. Acta., 704 (2011) 133.
7. N.N. Zhu, Y.Q. Lin, P.Yu, L.Suand L.Q. Mao, Anal. Chim. Acta., 650 (2009) 44. 8. J. Liu, X. Yuan, Q. Gao, H. Qi and C. Zhang, Sens. Actuators. B, 162 (2012) 384. 9. G.J. Li, X.L. Li, J. Wan and S.S. Zhang, Biosens. Bioelectron., 24 (2009) 3281.
10. G. Rounaghi, R. Mohamadzadeh−kakhki and H. Azizi−toupkanloo, Mater. Sci. Eng. C, 32 (2012) 172.
11. W. Lian, S. Liu, J. Yu, J. Li, M. Cui, W. Xu and J. Huang, Biosens. Bioelectron., 44 (2013) 70. 12. M. Arvand, R. Motaghed−Mazhabi and A. Niazi, Electrochim. Acta., 89 (2013) 669.
13. Y. Zhou1, H. Yin, X. Meng, Z. Xu, Y. Fu and S. Ai, Electrochim. Acta., 71 (2012) 294. 14. H. Quan, S. U. Park and J. Park, Electrochim. Acta., 55 (2010) 2232.
15. YShi,Z.L. Liu, B. Zhao, Y. J. Sun, F. G. Xu, Y.Zhang,Z. W.Wen,H. B.Yang and Z. Li, J.Electroanal. Chem., 656 (2011) 29.
16. T. Luczak, Electrochim. Acta., 54 (2009) 5863.
17. M. Mazloum−Ardakani, H. Beitollahi, M. K. Amini, B. F. Mirjalili and F.Mirkhalaf, J. Electroanal. Chem., 651 (2011) 243.
18. J. Jiao, H. Zhang, L. Yu, X. Wang and R. Wang, Colloids Surfaces A, 408 (2012) 1.
19. C. M. Whelan, M. Kinsella, L. Carbonell, H. M. Ho, K. Maex, Microelectron. Eng., 70 (2003) 551. 20. B. Y. Wu, S. H. Hou, F. Yin, Z. X. Zhao, Y. Y. Wang, X. S. Wang and Q. Chen, Biosens.
Bioelectron., 22 (2007) 2854.
21. W.L. Wang, Y.Y. Wang, C.C. Wan and C.L. Leev, Colloids Surfaces A, 275 (2006) 11.
22. J. Lefebvre, P.J. Poole, J. Fraser, G.C. Aers, D. Chithrani and R.L. Williams, J. Cryst. Growth, 234, 2002, 391−398.
23. A. Aierken, T. Hakkarainen, M. Sopanen, J. Riikonen, J. Sormunen, M. Mattila and H. Lipsanen, Appl. Surf. Sci., 254 (2008) 2072.
24. H. Yang, Y. Yang, Z. Liu, Z. Zhang, G. Shen and R. Yu, Surf. Sci., 551 (2004) 1.
25. M. M. Aghayizadeh, N. Nasirizadeh, S. M. Bidoki and M. E. Yazdanshenas, Int. J. Electrochem. Sci., 8 (2013) 8848.
26. A. R. Fakhari, K. Hasheminasab, H. Ahmar and A. A. Alizadeh, Synthesis, 24 (2008) 3963. 27. M. Chao and X. Ma Int. J. Electrochem. Sci., 7 (2012) 6331
28. H. Ju andC. Shen, Electroanalysis, 13 (2001) 789. 29. E. Laviron J. Electroanal. Chem., 101 (1979) 19.
30. M.Mazloum−Ardakani, P. Ebrahimi−Karami,H. Naeimi and B.F Mirjalili, Turk. J. Chem., 32 (2008) 571
31. H. R. Zare, N. Nasirizadeh, F. Chatraei and S. Makarem Electrochim. Acta., 54 (2009) 2828. 32. H.R. Zare and S.M. Golabi, J. Solid State Electrochem., 4 (2000) 87.
33. S. M. Golabi andH. R. Zare, Electroanalysis, 11 (1999) 1293.
36. H. R. Zare, Z. Sobhani and M. Mazloum−Ardakani, Sens. Actuators.B, 126 (2007) 641. 37. H. R. Zare and N. Nasirizadeh,Electrochim. Acta., 52 (2007) 4153.
38. J.A. Ni, H.X. Ju, H.Y. Chen and D. Leech, Anal. Chim. Acta., 378 (1999) 151. 39. A. Salimi, K. Abdi, Talanta, 63 (2004) 475.
40. H. R. Zare and Navid Nasirizadeh, J. Braz. Chem. Soc., 23 (2012) 1070. 41. H. R. Zare, S. H. Hashemi, A. Benvidi, Anal. Chim. Acta., 668 (2010) 182. 42. A. J. Bard, L. R. Faulkner, Wiley. New York, (2001).
43. S. Antoniadou, A. Jannakoudakis, E. Theodoridou, Synth. Met., 30 (1989) 295. 44. C. P. Andrieux, J. M. Saveant, J. Electroanal. Chem., 93 (1978) 163.