Int. J. Electrochem. Sci., 9 (2014) 7471 - 7494
International Journal of
ELECTROCHEMICAL
SCIENCE
www.electrochemsci.org
Effect of Silver Nanoparticles in a Hydroxyapatite Coating
applied by Atmospheric Plasma Spray
V. Orozco Carmona1,*, C. Martínez Pérez2, Renata de Lima3,4, Leonardo Fernandes Fraceto5,6, J. Romero García7, A. Ledezma Pérez7, Swen Marke8, C. Rodríguez González2,
Abel Hurtado Macías1 and A. Martínez-Villafañe1
1
Centro de Investigación en Materiales Avanzados (CIMAV), Miguel de Cervantes 120, 31109 Chihuahua, Mexico.
2
Universidad Autónoma de Ciudad Juárez, (UACJ), 32310 Juarez City, Mexico
3
Departamento de Biotecnologia, Universidade de Sorocaba, Sorocaba, São Paulo, Brazil.
4
Universidade Federal de São Carlos, UFSCar, Sorocaba, São Paulo, Brazil.
5
Universidade Estadual Paulista, Departamento de Engenharia Ambiental, Sorocaba, São Paulo, Brazil.
6
Departamento de Bioquímica da Universidade Estadual de Campinas, Campinas, São Paulo, Brazil.
7
Centro de Investigación en Química Aplicada (CIQA), 25250 Saltillo, Mexico
8
IfU Diagnostic Sytems GmbH, 09244 Lichtenau, Germany
*
E-mail: [email protected]
Received: 11 August 2014 / Accepted: 29 September 2014 / Published: 28 October 2014
In this study, 0.5, 1, 3, and 5 % nano-silver containing hydroxyapatite coatings (nAg-HA) on a Ti6Al4V substrate were developed by atmospheric plasma spray (APS), and their antibacterial efficiency was evaluated in the following bacterial strains: Escherichia coli, Staphylococcus aureus and Pseudomonas aeruginosa. The optimal operating parameters for the coatings application were determined by online diagnostic of thermal HVOF- and plasma spraying processes. Scanning electron microscopy (SEM) showed that both micro and nano-silver (Ag) particles were distributed on the coating surface. The antibacterial efficiency was studied according to the JIS Z2801:2000 standard “Antimicrobial products-Test for antimicrobial activity and efficacy”. The results show that the antibacterial efficiency of a 1 % nAg-HA coating against Escherichia coli, Pseudomonas aeruginosa, and Pseudomonas aeruginosa strains was above 99 % antibacterial rate. Silver ion release tests show that the coatings did not deliver the silver ions in the phosphate buffered saline solution, which generate good cytotoxic properties. The antibacterial mechanisms observed in the coatings are based in the combination of the two following theories proposed by Cao: 1) Disruption of transmembrane proton electrochemical gradient, and 2) ‘‘bacterial charging’’ process. The electrochemical test in SBF solution at 25 and 37 °C showed an icorr higher than 25.00E-6 A/cm2, which justified the good
finally, the study suggests further research to determine which of the two mechanisms proposed by Cao presents the major effect in the antibacterial rate.
Keywords: Silver nano particles; Hydroxyapatite coating; Atmospheric Plasma Spray; Antibacterial Test; Cytotoxic Test; Electrochemical Test.
1. INTRODUCTION
Hydroxyapatite (HA-Ca10(PO4)6(OH)2) is frequently used as bioactive material, because it is
about 69 % of the bone, tooth enamel and dentine inorganic content. Applications of HA include implant coating, periodontal treatment, alveolar ridge augmentation, maxillofacial surgery, and otolaryngology [1]. However, implant-associated infection is one of the most common and serious complications in orthopedic surgery. It is known that such infections are caused by the adhesion and colonization of bacteria on the artificial implant or the tissues adjacent to the implant surface [2]. It has been reported that implant-related infections play an important role in the common clinical complications that result in the failure of orthopedic surgery and increased health care costs [3]. It has been reported that the postoperative infection rate is 5 % for primary cases, 6 % for revision cases, and 43 % for revision of previously infected cases [4].
Silver and silver ions have long been known to have antimicrobial activity [5], and in certain given concentrations, do not generate toxicity in human cells [6]. In addition, bacteria have not yet developed resistance mechanisms against silver.
As antibacterial material, silver particles have been researched through the evaluation of 1) the size effect (µm [7] or nm [9,10,11]); 2) presentation (Ag2O) [8,12]; 3) dispersion methods to obtain
homogeneous silver coating distribution (mechanical milling [7,8,10], soaking [3,10], plasma immersion ion implantation system [9], shaking [13]); 4) combination effects with different matrix (HA [7, 8,12,13,14], TiO2 [9], Wollastonite [10], Ti [3]); and 5) coating application methods
(atmospheric plasma sprayed [9, 10, 15], vacuum plasma sprayed [3, 7], pulse laser deposition [14], flame spraying [12, 13], inductive coupled RF plasma spraying [8]), among others. In all research, it is necessary to incorporate an auxiliary method to obtain homogeneous silver particle dispersion in the coating and/or the use of a sophisticated coating application process to develop an effective coating.
shaking method to disperse the nano-silver particles in the HA, and establishing the optimal parameter through “real thermal” processes for the atmospheric plasma spray method. This would allow the reduction of the silver nano-particle content to below 3 % in order to obtain up to 99% determined, i.e., electrochemical interaction between bacteria and silver nanoparticles in concordance with the antibacterial mechanism proposed by Cao et al. [9,11]. Moreover, the strength adhesion; nano-mechanical properties such as Stifness (S), elastic modulus (E), and hardness (H); and the cytotoxic test of the silver nanoparticles containing hydroxyapatite coating would be defined.
2. MATERIAL AND METHODS
2.1 Preparation of Nano-silver Containing Hydroxyapatite Coatings.
Atmospheric Plasma Spraying is the easiest and most widely applied method to deposit HA coating onto titanium alloy prostheses (90 % of implant manufacturers use this type of coating deposition). The method consists of injection of HA particles into a high temperature (>10 000 K) plasma jet. To develop nano-silver containing hydroxyapatite coatings (nAg-HA), a mixture of commercial HA (CaP Bionmaterials) powders with a 50 μm average size and a semi spherical, granular shape, and silver nano-powder (Alfa Aesar, No. 45509) with a 40 nm average size, an irregular shape and 99.9 % purity were used. The powder mixture was shaken at 70 rpm during 1 hour in a plastic container. Five mixtures were made: a) HA, b) HA-0.5% nAg, c) HA-1% nAg, d) HA-3% nAg, and e) HA-5% nAg. Afterwards, further spraying was applied on the surface of the Ti6Al4V alloy by atmospheric plasma spray thermal (APS) system (SG-100, Praxair). The optimal operating parameters were determined by the Process diagnostic tool GTV NIR-Sensor, and a process parameter variation was obtained. The measured distance to the nozzle was 50 mm. Ti6Al4V disks of 1.25 (diameter) x 0.5 cm were used as substrate. The parameters evaluated were: Current [A], process gas 1 (Ar) pressure, and process gas 2 (He) pressure.
2.2 Surface chemistry and structure characterization
The elemental distribution and surface morphologies of nano-silver containing hydroxyapatite coating was examined by Field Emission Scanning Electron Microscopy, using a JEOL JSM-7401F, operated at 7 kV. SEM images were obtained in backscattered electron image modes. In addition, elemental analysis of the coatings was achieved by means of energy dispersive X-ray spectroscopy (EDS), using an Oxford Inca microanalysis system attached to an electron microscope, with 100 s of live time acquisition and 5 eV/ch of energy dispersion. High-resolution transmission electron microscopy of the cross section of the coatings was performed in a JEOL JEM-2200FS system operated at 200 kV. Samples for HRTEM were prepared using a JEOL JEM-9320 focused ion beam system operated at 30 kV, with Ga ions.
monochromator. The grazing incidence angle was fixed at 0.5°; whereas the scanning angle 2θ was varied between 20° and 110°, at a 0.02° step size.
2.3 Mechanical Properties 2.3.1 Strength Adhesion
The bond strength adhesion of the nAg-HA coatings was evaluated using the ASTM C633 standard tensile adhesion test with three replicates. The counter Ti6Al4V substrates were sandblasted and attached to the surfaces of the nAg-HA coatings using quick set epoxy resin as the adhesive (Armstrong A-12). After curing in an oven at 120 °C for 1 h, the fixtures were subjected to a tensile test at a constant cross-head speed of 0.017 mm/s until failure [17]. The adhesive bond strength was calculated as: failure load/sample area (A = 5.06 cm2). The data are reported as means ± standard deviation.
2.3.2 Nano-mechanical Properties
Nano-mechanical coating properties such as Stifness (S), elastic modulus (E), and hardness (H) were evaluated by means of nano-indentation, using Oliver and Pharr method, employing a Nano Indenter G200 coupled with a DCM II head. The equipment was calibrated using a standard fused silica sample. Tests parameters were the following: the constants area function C0=24.05, C1= -175.30,
C2= 6844.30, C3= -25507.27, and C5= 16602.70; Berkovich diamond indenter with a tip radius of 20
±5 nm; maximum load of 5 mN; strain rate of 0.05 s−1; passion’s coefficient of ν = 0.25; and time load 10 s.
2.4. Antibacterial Test
The antibacterial properties were quantitatively evaluated against strains of importance in the clinical area such as Escherichia coli ATCC 25922, Pseudomonas aeruginosa ATCC 27853 and Staphylococcues aereus ATCC 29213. The antimicrobial activity was evaluated according to JIS Z 2801:2000 “Antimicrobial products-Test for antimicrobial activity and efficacy” standard test method. The Ti6Al4V disk with nAg-HA coating was challenged with 4 mL of bacterial inoculum in a 20 mL vial. The inoculum was a soy trypticase broth diluted 1/500 (v/v), containing 5 x 10⁴ colony forming units (CFU) of bacteria/mL. The vials were placed in an incubator for 24 h at 37°C with RH > 90%. After test and control coatings had been in contact with bacteria from each vial for over 24 h, 1 mL of liquid was taken and diluted to a sterilized physiological saline solution at 10-1, 10-2, 10-3, 10-4, 10-5, 10
-6
The value of antimicrobial activity was obtained according to Eq. 1 [18]:
R = [log (B/A) - log (C/A)] = [log (B/C)]………..…..………(1) Where:
R : value of antimicrobial activity
A : bacteria viable cell average number immediately after inoculation on the untreated test piece
B : bacteria viable cell average number on the untreated test piece after 24 h C : bacteria viable cell average number
The antibacterial ratio K was calculated by the following Eq. 2 [19] :
K = [(A – B)/ A] x 100 ………..………….……….. (2)
Where:
A and B are the average number of bacteria for the control and tested samples, respectively.
2.5 Determination of antibacterial mechanism
For the purpose of determining the main antibacterial mechanism generated by the silver nanoparticles containing coating applied by APS, both the silver ions release and the effect of electrochemical processes were evaluated.
2.5.1 Electrochemical Process Effect of Silver Nano-particle
The electrochemical effect of silver nanoparticles in the behavior of both contexts, 1) in contact with the substrate or 2) in the HA matrix, was evaluated in simulated body fluid solution (SBF) at 25 and 37°C. The SBF solution was prepared in concordance with Kukobo et al. [20]. The Potentiodynamic Polarization Curves were obtained in a PGSTAT 12 Potentiostat/Galvanostat (Autolab); the operating parameters used in the tests were: Sweep potential ± 2000 mV vs Ecorr, and sweep rate 60 mV/min. The experimental cell consisted in reference electrode (SCE) and counter electrode (platinum). Later, the electrochemical test samples were characterized by HRSEM, so the morphological and mechanical evolution of the corrosion and the coating bioactivity were determined. 2.5.2 Silver and Calcium Ions Release
2.6 Cytotoxicity
2.6.1 Cellular Samples - Animal Cells
For the purpose of this study, human lymphocytes were used. The blood sampling method included previously heparin-treated, disposable and sterile needle and syringe, and local-sterile conditions applying iodated alcohol or 70 % alcohol. The sample included 5 mL of blood (voluntarily donated). Lymphocytes were isolated through Ficoll-Paque™ PLUS (GE Healthcare) and placed on containers to initiate treatments. The lymphocytes cells were exposed to the material (substratum, HA, HA-1% nAg and HA – 3% nAg) during 1, 6, 24 and 48h and to the negative control (PBS). After exposition the cells were prepare to Comet Assay (Single Cell Gel Electrophoresis Assay- SCG), image cytometry to measure the viability and Cytogenetic analysis.
2.6.2 Tali® Image-Based Cytometry – Cellular Viability Analysis
Analysis consisted of Tali® image-based cytometry. The treatment included a total of 100 µL. There were 105 cells/mL. Cells and coatings were placed in 6 well plate for 1 hr. After this time the cells without the coated pieces (Ti6Al4V) were removed and centrifuged for 5 min at 1500 rpm. The supernatant was discarded and a Tali® apoptosis kit treatment was applied. The mixture was placed in special reading blades and was read using image-based cytometry equipment. Results indicated cell viability through green/red fluorescence, discriminating among live, apoptotic, and dead cells. The outcome was studied using a one-way variance analysis (ANOVA), as well as the statistical Tukey-Kramer method. Statistical significance was set at <0.05.
2.6.3 Single Cell Gel Electrophoresis Assay
.
Figure 1. “Comets” images to classify damage according to “tail” size: A = class zero/ undamaged; B = class 1; C = class 2; D = class 3; E = class 4; F = apoptosis/cell death [21].
2.6.4 Cytogenetic Analysis using Fresh Whole Blood Cell Culture
500 mL of heparin-treated whole blood were used in the cytogenetic analysis. It was set in an RPMI culture medium supplemented with a 10 % fetal bovine serum and 2 % phytohaemagglutinin (PHA) cultured for 72 h. Two hours before the test was completed, 100 uL of colchicine were added as culture. After the incubation period the material was passed to hypotony with KCl 0.075 M and fixed in a methanol solution: acetic acid (3:1, v:v). The slides were dyed with Giemsa and analyzed using optical microscopy.
The mitotic index (MI) was evaluated and the metaphases were counted to analyze the presence of any disorder (Eq. 3).
………..………….……….. (3)
Results were viewed through the one-way variance analysis (ANOVA), as well as the statistical Tukey-Kramer method. Statistical significance was set at p<0.05.
2.6.5 Atomic force microscopy (AFM) analysis of coated materials
[image:7.596.149.451.71.250.2]
3. RESULTS
3.1 Determination of Optimal Parameter to Apply Nano-silver Containing Hydroxyapatite Coatings by APS.
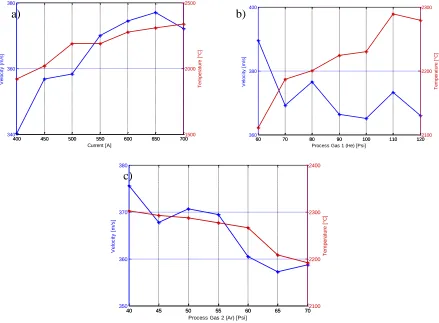
The dependencies of particle velocity and particle temperature at 50 mm distance from the nozzle are shown in figure 2. The results show that the particle temperature and particle velocity are raised by increasing the operating current, this is due to the increase of the particle’s total energy, and it results in higher velocity and surface temperature. Helium gas pressure does not show a significant influence in the particle properties. The stable temperature value is especially interesting because a lower plasma pressure leads to less charge carrier (figure 2-a). The reduction of the Argon pressure leads to a significant decrease in the particle temperature since Argon can transport more energy than Helium due to its higher mass. The maximum particle velocity was achieved at 50 - 55 psi. This can be a superposition of the higher collision rate at higher pressure and the simultaneously observed reduction of the operating voltage. In concordance with the analysis by Process diagnostic tool GTV NIR-Sensor, the optimal parameters to apply the nAg- HA coating are shown in table 1.
400 450 500 550 600 650 700
340 360 380 V e lo c it y [ m /s ]
400 450 500 550 600 650 7001500
2000 2500 Te m p e ra tu re [ °C ] Current [A]
60 70 80 90 100 110 120
360 380 400 V e lo c it y [ m /s ]
60 70 80 90 100 110 1202100
2200 2300 Te m p e ra tu re [ °C ]
Process Gas 1 (He) [Psi]
40 45 50 55 60 65 70
350 360 370 380 V e lo c it y [ m /s ]
40 45 50 55 60 65 702100
2200 2300 2400 Te m p e ra tu re [ °C ]
Process Gas 2 (Ar) [Psi]
Figure 2. Dependency of particle properties (50 mm distance) with: a) operating current, b) He pressure, and c) Ar pressure.
b) a)
[image:8.596.84.523.367.690.2]
Table 1. Plasma-spraying optimal parameters
Parameter Value
Main gas Ar 55 psi
Auxiliary gas He 110 psi
Arc current 600 A
Arc voltage 25 V
Spraying distance 50 mm Powder feeding rate 2 Lb/h Spraying thickness 200 µm
3.2 Surface chemistry and structure characterization
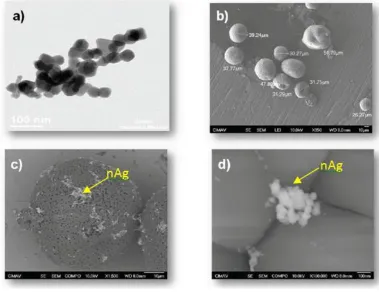
Surface morphologies before and after the powders of nano-silver and Hydroxyapatite were mixed by shaking, including dark field (TEM) and backscatter electron images (HRSEM); these are shown in Figure 3. From the dark field image given in Figure 3 (a), it can be seen that nano-silver powders were agglomerated and presented a semi spherical form. From the backscattering image given in Figures 3 (b), (c), and (d), it can be seen that the distribution of silver was preferentially located at the border of the
[image:9.596.108.487.418.710.2]
After spraying the nAg-HA powders to form the coating, there was a heterogeneous distribution of Ag on the surface (figure 4), with plasma spraying of nAg – containing HA, silver is difficult to distribute homogeneously in the coating [3]. The nano-structure of Ag is partially lost because the nanoparticles agglomerated to form bigger particles (1 – 10 µm).
Figure 4. HRSEM photomicrographs of a) 1%, b) 3% and c) 5% of nAg-containing HA coatings (superficial view).
[image:10.596.314.535.171.348.2]
Figure 5. STEM photomicrographs of nAg –containing HA coating (cross section).
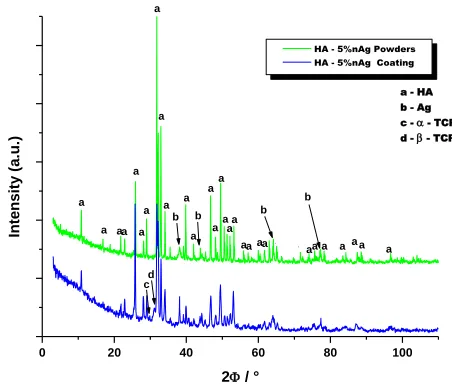
Figure 6 shows the X-ray diffraction (XRD) spectrum patterns of nAg-HA mixture-powders and nAg-HA coating. The major phase in all the sample was identified as HA (JCPDS No. 01-071-5048). A secondary phase identified as Ag (JCPDS No. 01-071-5048) was also found in the coatings to a small extent.
0 20 40 60 80 100
d c
a - HA b - Ag c - - TCP d - - TCP
a a b b b b
aa a a a a
a
a aa a aa a a aa a a a a a a a aa a a a In te ns ity (a .u .)
2 / °
HA - 5%nAg Powders HA - 5%nAg Coating
Figure 6. XRD pattern of nAg-HA powders and coating.
3.3 Mechanical Properties
[image:11.596.105.498.71.254.2] [image:11.596.316.499.75.250.2] [image:11.596.183.409.379.571.2]
1, 3 and 5% nAg respectively. After adhesive testing, the typical fractographs of the specimens are shown in Figure 8. A mixed cohesive and adhesive failure mode was observed in the 5% nAg-HA coating, while in the HA coating, the failure mode was completely cohesive. Cohesive failure occurred in the coatings lamellae, and adhesive failure occurred at the coating and substrate interface. Generally, the smaller the area with cohesive failure, the higher the bonding strength of HA coatings [23]. Cohesive strength is dominated by coating structure, such as crystallinity, porosity, cracks and lamellae texture.
Figure 7. Tensile adhesion results of the coating systems according to ASTM C633.
Figure 8. Fracture surface of a) HA and b) 5% nAg- containing HA coatings after ASTM C633 tensile test.
On the other hand, with purpose of measuring the nano-mechanical properties of the HA and HA-5%nAg the Oliver and Pharr method with controlled cycles was used [28]. The basic analysis of nano-indentation load-displacement curve (P-h) was established based on the elastic contact theory given by Sneddon [29] and Doerner [30]. The following equation was used to determinate the elastic modulus.
[image:12.596.149.420.206.416.2] [image:12.596.107.489.471.613.2]
………..(4)
where β is a constant that depends on the geometry of the indenter (β = 1.034 for a Berkovich indenter), Er is the reduced elastic modulus, which accounts for the fact that elastic deformation occurs
in both the sample and the indenter, and A is the function of the contact area of penetration depth or displacement (h).
Figure 9 shows the characteristic curve load-displacement in nano-indentation for the HA and HA-5%nAg, and in this case, the maximum load was a 5 mN, yielding a maximum displacement of hmax=185 and 199 nm respectively.
Figure 9. Penetration depth-load curves of the samples HA and HA-5%nAg.
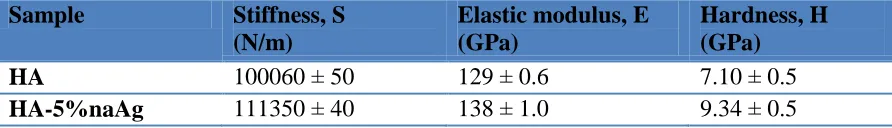
The mechanical properties such as stiffness, elastic modulus and hardness of the HA and HA-5%nAg samples obtained by nano-indentation are show in Table 2.
[image:13.596.182.415.262.458.2]It clearly shows that the best sample with mechanical properties was the HA-5%nAg, with values: Stiffness, S=111350 ± 40 GPa, elastic modulus, E=138 ± 1.0 GPa, and hardness, H=9.34 ± 0.5GPa.
Table 2. Results of the stiffness, elastic modulus and hardness of the HA and HA-5%nAg samples.
Sample Stiffness, S (N/m)
Elastic modulus, E (GPa)
Hardness, H (GPa)
HA 100060 ± 50 129 ± 0.6 7.10 ± 0.5
[image:13.596.75.521.666.730.2]
3.4 Antibacterial Test
The antibacterial ratios of the nAg- containing HA coatings are shown in Table 3. Results show that the antibacterial ratios exhibit more than 99% (minimum antimicrobial ratio limit) for all of the three bacterial species when those are in contact with 1, 3 and 5 % nAg – containing HA coatings. Graph 1 shows the values of antimicrobial activity based on the JIS Z 2801:2000 standard. It was observed that only 1, 3 and 5% nAg –HA coatings are higher than 2.0, the limit value for the antimicrobial efficacy of antimicrobial products. It indicates that the plasma-sprayed nAg –HA coatings developed in this study exhibit excellent antibacterial ability.
Table 3. Antibacterial ratios of nAg – containing HA coatings over Escherichia coli ATCC 25922, Staphylococcus aureus ATCC 29213, and Pseudomonas aeruginosa ATCC 27853.
Escherichia coli
Staphylococcus aureus
Pseudomonas aeruginosa
Hydroxyapatite 2.24% 28.31% 0.00%
Ti6Al4V Substrate 50.27% 0.00% 0.00%
0.5% nAg – HA Coating
0.00% 43.73% 0.00%
1% nAg – HA Coating
99.99% 99.71% 99.99%
3% nAg – HA Coating
100.00% 99.99% 100.00%
5% nAg – HA Coating
100.00% 100.00% 100.00%
[image:14.596.91.511.284.713.2]
3.5 Electrochemical Process Effect of Silver Nano-particle
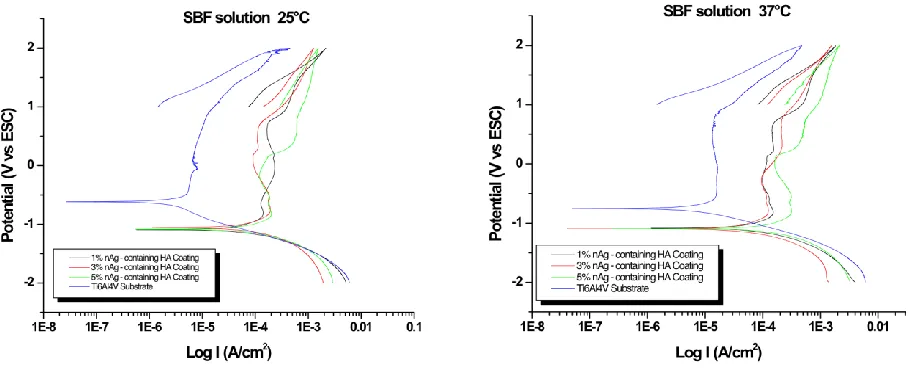
[image:15.596.72.526.349.535.2]From the potentiodynamic polarization curves (figure 10), it can be seen that HA-nAg coatings showed a higher current density than the Ti6Al4V substrate, thus indicating the great effect of silver particles in the electrochemical reaction. Likewise, all curves indicated that the corrosion mechanism was of the general type, since the polarization curves did not show a hysteresis current. Tables 4 and 5 show the current density (Icorr) in SBF solution at 25 and 37 °C. The current density of the nAg-HA coatings in SBF solution was found to be higher in the HA-nAg coatings than in the Ti6Al4V substrate at both temperatures. This is due to the presence of nAg in the coating, since silver shows a high oxidation kinetic. This is likely to be related to the difference in the activation path between the micro-galvanic couples in the nAg embedded Ti6Al4V samples. Activation of micro-micro-galvanic couples is rapid on the surface when the sample is immersed in a solution, but activation of the micro-galvanic couples beneath the surface is slower and controlled by the lattice defect density in the near surface. The lattice defects caused by ion implantation provide fast diffusion paths for chloride ions (Cl-) from the solution, and facilitate activation of the micro-galvanic couples underneath [11].
Figure 10. Potentiodynamic polarization curves of Ti6Al4V and 1%, 3%, and 5% nAg-containing HA coatings in SBF solution at 25 and 37°C.
Table 4. Parameters obtained by the Tafel polarization method in SBF solution at 25°C.
Ti6Al4V Substrate
1% nAg-HA Coating
3% nAg-HA Coating
5% nAg-HA Coating Icorr (A/cm2) 1.75E-6 20.34E-6 25.61E-6 29.55E-6 Ecorr (mV) vs
ESC
[image:15.596.72.522.642.715.2]
Table 5. Parameters obtained by the Tafel polarization method in SBF solution at 37°C.
Ti6Al4V Substrate
1% nAg-HA Coating
3% nAg-HA Coating
5% nAg-HA Coating Icorr (A/cm2) 3.63E-6 20.70E-6 24.90E-6 59.67E-6 Ecorr (mV) vs
ESC
-669 -1078 -1071 -1093
Later on, the coatings were electrochemically evaluated by microscopy. Figure 11 shows the surface morphology of the HA, HA-1% nAg, HA-3% nAg and HA-5% nAg. In all cases, SEM photographs show a new apatite on the surface, revealing that coatings can induce bone-like apatite formation on the surface, suggesting desirable bioactivity [3]. Formation of bonelike apatite is an important indicator for implants to make direct bond to living bone. This study indicates that silver does not affect the bioactivity of HA.
Figure 11. HRSEM photomicrographs after electrochemical test of a) HA, b) 1% nAg-HA, c) 3% nAg-HA and, d) 5% nAg-HA coatings.
3.6 Silver and Calcium Ion Release
[image:16.596.94.512.325.635.2]
peak concentration of silver released from the 5% nAg –HA in SBF at the end of 168 hrs was 3.9 ppb. This value is considered negligible. For 1% and 3% nAg- containing HA coatings, the silver released was not detected at any time. These results are very important; as the coatings developed in the present research did not release silver, the antimicrobial activity mechanism with the Escherichia coli, Staphylococcus aureus and Pseudomonas aeruginosa strains is not associated with silver ions release.
Figure 12. Concentration of silver ions in PBS at 37°C after immersion of 1%, 3%, and 5% nAg-containing HA coatings for different times.
[image:17.596.116.478.172.352.2]The concentration of calcium ions in PBS after immersion of 1%, 3%, and 5% nAg- HA coatings was monitored, and the results are shown in Figure 13. The concentration of calcium ions in PBS after 3% nAg- HA coating was higher than 5% and 1% nAg- HA coatings. These results indicate that the calcium released by the coatings is an effective via to increase the calcium level in the solution in contact with these coatings, and it enhances the possibility of apatite deposition on the surface of the prosthesis to improve bone – prosthesis adherence.
[image:17.596.109.489.548.719.2]
3.7 Cytotoxicity
[image:18.596.137.461.164.347.2]In relation to a cytotoxicity cell viability, the measurements taken after 1 and 6 h contact did not show significant differences compared to the negative control; however, after 24 h, an increase of cell viability mainly to HA-1% nAg is observed (Figure 14).
Figure 14. Relative cell viability index after 1, 6 and 24 h exposure for each treatment.
[image:18.596.167.433.472.660.2]Nevertheless, this decrease in cell viability seems normal in all treatments compared to Ti6AI4V (Figure 15), mainly observed in coatings HA–1%nAg and HA–3%nAg which showed a relative cell increase after a 24 hr period.
Figure 15. Relative growth index for each treatment after 1, 6, 24 and 48 h. Each relative index was obtained in relation to Ti6AI4V.
cellular growth behavior after a period of 72 h. Metaphase analyses of damage results show no chromosome alteration.
Figure 16. Cytogenetic analysis in relation to each treatment’s mitotic index (Neg control, Ti6AI4V and HA).
In relation to a genotoxicity in Comet Assay results of the Single Cell Gel Electrophoresis Assay (SCG), more damage on the non-coated samples (Ti6AI4V), HA and HA – 3% nAg was indicated. The least toxic coating was HA-1% nAg (Figure 17). However, these analyses show the potential capacity of HA-1% nAg coating to cause genotoxicity; nevertheless, it is possible to repair the damage during cell division process.
Figure 17. Comet Assay results obtained from each treatment (Substratum, HA, HA-1% nAg and, HA-3% nAg). *Means significant differences between the treatment and control (p<0.05).
3.7.1 Atomic Force Microscopy analysis
[image:19.596.103.497.121.288.2] [image:19.596.123.476.456.632.2]
removed from the cell culture medium and dried with an air flow, and subsequently analyzed by AFM. Figure 18 shows the micrographs obtained from the different coatings (Substrate, HA, HA-1% nAg and HA-3% nAg).
Figure 18 shows that the surface substrate characteristics (Figure 18-A) are quite different from those observed in hydroxyapatite coated surfaces (with or without silver nano-particles, figures 18 B-F). The morphology observed by the hydroxyapatite coated surfaces is very similar to that described in the literature [27].
Figure 18. AFM micrographs of the samples before (left) and after (right) cito and genotoxicity studies. A) Substrate, B) HA, C) HA-1% nAg and D) HA-3% nAg. All samples were scanned in a 20 μm x 20 μm area.
The images of hydroxyapatite coatings containing silver nanoparticles before treatment are often more irregular than those observed on the surface coated only with HA. These irregularities (spheres) may be due to aggregates of silver nanoparticles on the surface of the materials.
The images obtained after the toxicity analysis showed that no changes in the morphology of the materials were observed (substrate and coated surfaces), indicating that the exposure of these materials in the cell culture medium did not affect their surface.
4. DISCUSSION
[image:20.596.90.507.214.431.2]
melting ratio usually results in a great amount of decomposed phases and amorphous phases. Research has shown this with increasing amounts of decomposed HA and the less stable HA amorphousness [8]. The plasma set-up in this study used a sub-sonic nozzle. The HA particles were discharged at high speed, 378 m/s, in the lower region of the plasma arc, where the temperature is relatively low (2450°C) and, therefore, phase decomposition and amorphous phase formation are restricted due to reduced exposure to the plasma flame. The XRD data, shown in Figure 6, evidence that the HA phase is similar before and after being sprayed by APS, with the only difference being a major crystalline grid pack order in the nAg-HA coating. Since in the present coatings did find only an α-TCP and β-TCP; hence, it is possible to avoid void formation in the long run. The adhesive strength of the coatings (Figure 7) showed an increased value of the strength adhesion, resulting from the increment of the of nAg percentage that increases the cohesive strength of the HA matrix. The maximum strength adhesion was 38 MPa at 5% nAg/HA coating, higher than the maximum strength reported in the literature [8]. The mixture developed in the present study suffered a cohesive – adhesive failure. The failure mode observed in the 1, 3, and 5% nAg-HA coatings demonstrated that the addition of nAg at HA coating modified the common failure mode observed in HA coatings. The cohesive failure is the common failure mode in HA coatings [8] (as shown in Figure 8-a). On other hand, the increase of nano-indentation properties justifies the increase of coating strength adhesion in function of nAg quantity, and as established by Nath et al, the Ag can be incorporated in HA lattice. Typically, the complex crystal structure of HA is described by the Ca triangle around the OH column. In the presence of Ag, one of the Ca2+ sites can be substituted by Ag+, allowing the increase of mechanical properties [31].
The antibacterial ratio of 99 % or a value of antibacterial activity of 2.0 was achieved (minimum value for an antimicrobial product) [18] over Escherichia coli, Staphylococcus aureus and Pseudomonas aeruginosa for a 1% nAg – containing HA coating. This silver content of 1% is lower than the percentage reported in the literature in the same bacteria [19]. An important factor in utilizing Ag as an antimicrobial agent in coatings is the ability for long-term sustained action, while minimizing the potential cytotoxic effect of the cation. It is unclear how silver actually kills bacteria. In a number of studies on this topic [9, 11, 32, 33], several possibilities and theories have been proposed. The bactericidal activity of silver is dependent on the application method. Smaller sized silver nanoparticles (<10 nm) were demonstrated to have higher antibiotic activity than the larger particles [24]. A silver coating containing silver nanoparticles will slowly release ions into the coating layer and subsequently the solution. One of the antibacterial mechanical theories is that silver ions will bind to the bacterial membrane and proteins, causing cell lysis [25]. It is very important to mention that the coatings developed in the present study did not release Ag ions in PBS solution. This indicates that the last theory regarding the bactericidal effect of Ag does not apply.
‘‘bacterial charging’’ process occurs, that is, electrons generated by bacteria are readily transferred from the bacterial membranes to the ceramic surface (i.e. Titanium Oxide Coating) and finally stored on the nAg due to the Schottky barrier effect at the nAg/ceramic interface which blocks electron–hole recombination, as well as the Helmholtz capacitance effect at the nAg/solution interface which limits, to some extent, the release of accumulated electrons to the adjacent solution. Consequently, valence-band holes (hVB+) accumulate at the ceramic side adjacent the boundaries at nAg/ceramic, leading to
notable oxidation reactions and biocide action. And these valence-band holes (h+) may directly react with the membrane lipids based on the electrostatic effects or stimulate catalytic oxidation, inducing pore formation on the outer membrane and eventually cell lysis [9]. Both antibacterial mechanisms may be applied with the nAg containing the Hydroxyapatite coating developed in the present study, as the nAg interact with the HA matrix as well as with the substrate (Ti6Al4V).
The electrochemical test shows that the nAg – HA coatings applied by APS developed under the current methodology generated a high corrosion current (Icorr) from 20.00E-6 A/cm2 to 60.00E-6 A/cm2 (1%nAg-HA to 5%nAg-HA respectively). The behavior of Icorr values is similar to antimicrobial activity values. This indicates that the antibacterial mechanism is dominated by the electrochemical reactions generated between both substrate-coating interface and coating matrix, led by the nAg content. In order to justify the afore mentioned behavior, the killer mechanisms proposed by Cao, et al. are the most appropriate. Due to the fact that the coatings developed in the present study generated higher Icorr values than those reported by Cao, et al., a 1 % of nAg is justified as enough to obtain an antibacterial ratio of 99 %.
Another result obtained in the present study is related to the good cytotoxic properties of the nAg containing HA coating. It is associated to a lower level of silver ion release (in the ppb order). The findings suggest that nAg is toxic because the out-leaching of silver ions and nAg alone are not a direct source of toxicity [26].
5. CONCLUSION
1, 3, and 5% nAg- HA coatings were developed by APS, optimizing the parameter by online
diagnostic of thermal HVOF- and plasma spraying processes. The nAg - HA coating applied by APS
ACKNOWLEDGMENTS
The authors would like to thank to Conacyt for the financial support under grant C0006-2009-01/ 127139 and the European Union Seventh Framework Programme FP7/2007-2013 under grant agreement No. NMP4-CP-2011-263942 and Brazilian funding agencies: FAPESP, CNPq, CAPES, and FUNDUNESP. The technical assistance of Adán Borunda, Arturo Hernández, Karla Campos, Wilber Antunez, Jair Lugo, Carlos Ornelas, Carlos Santillán, Gregorio Vazquez, Silvia Miranda, Leandro Oliveira Feitosa, Tatiane Pasquoto, Jhones Luiz de Oliveira and Estefânia Vangelie Ramos Campos is gratefully acknowledged.
References
1. B. Ratner, A. Hoffman, F. Schoen and J. Lemons, Biomaterials Science, 2nd ed., Elsevier Academic Press (2013)
2. K. Li, Y. Xie, H. Ao, L. Huang, H. Ji and X. Zheng, Ceramics International, 39 (2013) 7895– 7902.
3. Y. Chen, X. Zheng and Y. Xie, Surface and coatings technology, 205 (2010), 1892-1896 4. R. Capanna, H. Morris, D. Campanacci, M. Del Ben and M. Campanacci, Journal of Bone and
Joint Surgery, 76B (1994) 178
5. G. Gosheger, J. Hardes, H. Ahrens, A. Streitburger, and H. Buerger, Biomaterials, 25 (2004) 5547-56
6. I. Rojas, J. Slunt and D. Grainger, Journal of Control Release, 63 (2000) 175-89.
7. Y. Chen, X. Zheng, Y. Xie, C. Ding, H. Ruan and C. Fan, Journal Material Science: Materials and Medicine, 19 (2008) 3603–360
8. G. Fielding, M. Roy, A. Bandyopadhyay and S. Bose, Acta Biomaterialia, 8 (2012) 3144–3152 9. H. Cao, Y. Qiao, X. Liu, T. Lu, T. Cui, F. Meng and P. Chu, Acta Biomaterialia, 9 (2013) 5100–
5110
10. B. Li, X. Liu, C. Cao, Y. Dong and C. Ding, Journal of Biomedical Materials Research Part B: Applied Biomaterials, 91B (2009) 489-979
11. H. Cao, X. Liu, F. Meng and P. Chu, Biomaterials, 32 (2011) 693-705
12. T. Shimazaki, H. Miyamoto, Y. Ando, I. Noda, Y. Yonekura, S. Kawano, M. Miyazaki, M. Mawatari and T. Hotokebuchi, Journal of Biomedical Materials Research Part B: Applied Biomaterials, 92B (2010) 386-389.
13. I. Noda, F. Miyaji, Y. Ando, H. Miyamoto, T.i Shimazaki, Y. Yonekura, M. Miyazaki, M. Mawatari and T. Hotokebuchi, Journal of Biomedical Materials Research Part B: Applied Biomaterials, 89B (2008) 456-165
14. M. Jelínek, M. Weiserová, T. Kocourek, M. Zezulová and J. Strnad. Laser Physics, 21 (2011) 1265–1269.
15. K. Li, Y. Xie, H. Ao, L. Huang, H. Ji and X. Zheng, Ceramics International, 39 (2031) 7895– 7902
16. S. Yang, H. Man, W. Xing and X. Zheng, Surface & Coatings Technology, 203 (2009) 3116– 3122
17. ASTM Standard C 633, Standard Test Method for Adhesion or Cohesion Strength of Thermal Spray Coatings, ASTM International, USA (2001).
18. Japanese Industrial Standard JIS Z 2801:2002. Antimicrobial products-Test for antimicrobial activity and efficacy. Japanese Standards Association, Japan, (2000)
19. X. Zheng, Y.Chen, Y. Xie, H. Ji, L. Huang and C. Ding, Journal of Thermal Spray Technology, 18 (2009) 463
21. J. da Silva, T. de Freitas, V. Heuser, J. Marinho, F. Bittencourt, C. Cerski, L. Kliemann and B. Erdtmann, Mutation Research/Genetic Toxicology and Environmental Mutagenesis, 470 (2000) 39-51
22. C. Lima and J. Guilemany, Surface & Coatings Technology, 201(2007) 4694–4701
23. Walenkamp GHIM. Gentamicin PMMA beads. A clinical pharmacokinetic and toxicological study. PhD Thesis, University of Nijmegen, Netherlands, (1983)
24. I. Sondi and B. Salopek-Sondi, Journal of Colloid and Interface Science, 275 (2004) 177-182 25. M. Knetsch and L. Koole, Polymers, 3 (2011) 340-366.
26. E. Navarro , F. Piccapietra , B. Wagner , F. Marconi , R. Kaegi , N. Odzak , L. Sigg and R. Behra, Environ Science Technology, 42 (2008) 8959-64.
27. P. Campbell, H. Gledhill, S. Brown, and I. Turner, Journal of Vacuum Science & Technology B, 14 (1996) 1167-1172
28. G. Pharr, W. Oliver and F. Brotzen, Journal of Materials Research, 7 (1992) 613-617 29. I. Sneddon, International Journal of Engineering Science, 3 (1965) 47-57
30. M, Doerner, D. Gardne and W. Nix. Journal of Materials Research, 1 (1986) 845-851
31. S. Nath, S. Kalmodia and B. Basu, Journal of Materials Science: Materials and Medicine, 21 (2010) 1273–1287
32. A. Huh and Y. Kwon, Journal of Controlled Release, 156 (2011) 128–145
33. M. Moritz, M. Geszke-Moritz, Chemical Engineering Journal, 228 (2013) 596–613.
![Figure 1. “Comets” images to classify damage according to “tail” size: A = class zero/ undamaged; B = class 1; C = class 2; D = class 3; E = class 4; F = apoptosis/cell death [21]](https://thumb-us.123doks.com/thumbv2/123dok_us/1902542.148408/7.596.149.451.71.250/figure-comets-images-classify-damage-according-undamaged-apoptosis.webp)