Int. J. Electrochem. Sci., 11 (2016) 9007 – 9018, doi: 10.20964/2016.11.01
International Journal of
ELECTROCHEMICAL
SCIENCE
www.electrochemsci.org
High Specific Surface Area Activated Carbon with
Well-Balanced Micro/Mesoporosity for Ultrahigh Supercapacitive
Performance
Bo Hou, Tong Zhang, Rongwei Yan, De Li, Yan Mo, Lihong Yin, Yong Chen*
State Key Laboratory of South China Sea Marine Resource Utilisation, Hainan Provincial Key Laboratory of Research on Utilization of Si-Zr-Ti Resources, Hainan University, 570228 Haikou, China
*
E-mail: [email protected]
Received: 15 July 2016 / Accepted: 10 September 2016 / Published: 10 October 2016
High specific surface area activated carbon derived from coconut shell was prepared using low-temperature carbonization followed by KOH activation method. The resulting activated carbon exhibited excellent supercapacitance performance with an obtained specific capacitance of 325 F g-1 at 0.1 A g-1. Moreover, the supercapacitor electrodes retained 71% of the initial capacitance at elevated current densities of 100 A g-1 and 89% after 10000 cycles when tested in 6 M KOH aqueous solution. Also, the equivalent series resistance of the system was recorded to be only 0.36 Ω. Meanwhile, testing of the supercapacitor electrodes in ionic liquid based-electrolyte delivered substantial specific capacitance of 198 F g-1 and an ultrahigh power density of 74.2 kW kg-1.
Keywords: Coconut shell; Supercapacitors; Pore size distribution; Power density
1. INTRODUCTION
The energy storage of the electrical double layer capacitors (EDLC) relies on electrostatic adsorption at the electrode/electrolyte interface. Hence, both the specific surface area (SSA) and the pore size distribution (PSD) are essential in the performance of electrode materials [5, 6]. It has been demonstrated that pore size less than 1 nm may obviously enhance the specific capacitance, whereas micropore size smaller than 0.5 nm is insufficient to form a double layer [7, 8]. The suitable pore size should be slightly larger than the ion size of the electrolyte [7-9]. Also, it was found that mesopores could promote electrolyte diffusion, leading to improvement in the power density [10-12]. Hence, it might be speculated that hierarchically porous carbon could lead to better supercapacitive performances [11].
Traditionally, coconut shells were used as raw materials for preparation of activated carbon (AC) for supercapacitors, due to their unique natural structure, high carbon content and low ash content [13-17]. It has been demonstrated that the capacitance performance is dependent on the PSD and SSA of the AC, as well as the preparation method. A good performance was achieved with activated carbon synthesized using one-step thermal treatment method but suffered from poor cycle stability [16]. A high rate performance was obtained with sheet-like graphitic carbon through complicated synthetic route in the presence of additional catalyst [15]. With respect to coconut shell based activated carbon, though several reports have been published, the optimal preparation technology is still not fully development and is being further explored.
This account is devoted to the synthesis of activated carbon with improved capacitive properties from coconut shells through low-temperature carbonization and KOH activation process. The AC sample with a high SSA (3512.83 m2 g-1), well-balanced micro/mesoporosity (39.3%) and large pore volume (2.11 cm3 g-1) was obtained by using optimal preparation parameter. The AC delivers the high specific capacity up to 325 F g-1 at 0.1 A g-1 and 71% capacitance retention at 100 A g-1 in 6 M KOH aqueous solution, respectively. Moreover, the ultrahigh power density of 74.2 kW kg-1 was achieved at an energy density of 46.6 Wh kg-1 in ionic liquid electrolyte.
2. EXPERIMENTAL
2.1 Preparation of ACs
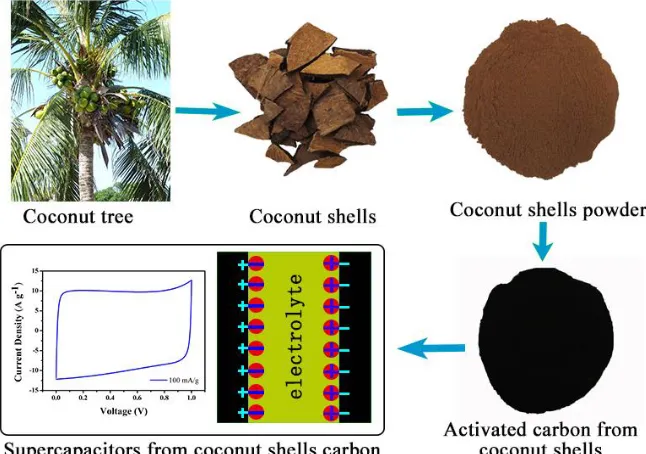
Figure 1. Schematic diagram of the AC preparation process.
2.2 Characterization
X-ray diffraction (XRD) patterns were obtained with a bruker D8 advance diffractometer with Cu Kα radiation. The Raman spectra were recorded on a Renishaw Invia Raman Microscope at laser source wavelength of 514 nm. X-ray photoelectron spectrometer (XPS, Thermo Fisher Escalab 250Xi) was used for the surface analysis of the ACs. The dynamic water contact angle measurements were acquired by an SPCA contact angle measurement system. The nitrogen adsorption-desorption isotherms were recorded at -196 oC at a relative pressure of P/P0 =0.989 on a JW-BK132F system. The SSA was determined by Brunauer-Emmett-Teller (BET) method. The pore volumes were analyzed by the Barrett-Joyner-Halenda for mesopores and Horvath-Kawazoe methods for micropores. The PSD was computed using a non-local density functional theory method.
2.3 Electrochemical Measurements
The AC was first mixed with Ketjen black and polytetrafluoroethylene at a weight ratio of 80:15:5, respectively. The mixture was then pasted and pressed onto nickel foam at 10 MPa. After drying at 110 oC for 12 h under vacuum, two electrodes with diameters of 10 mm were assembled in a CR2025 coin cell separated by glass microfiber (Whatman) filled with either aqueous solution or ionic liquid electrolyte.
1.0 V for 6 M KOH and 0-3.5 V for 1-ethyl-3-methylimidazolium tetrafluoroborate (EMIMBF4, Sigma-Aldrich)electrolytes, respectively.
The specific capacitance (C, F g-1) was estimated from CV curves using Eq. (1):
. i dV C
mV
(1)where i, v, m and V are the instant current (A), scan rate (V s-1), the AC mass load (g) and the voltage window (V), respectively.
The specific capacitance (Cs, F g-1) was calculated from GCD curve using Eq. (2) [18]:
2 cons t
s I C m V
(2)
where Icons (A) is the current, Δt (s) is the discharge time, m (g) represents the active mass of the
material on one electrode, and ΔV (V) is the voltage window during a discharge cycle (excluding the IR drop).
The energy density (E, Wh kg-1) of the cell was obtained by Eq. (3):
2 max
2 4 3.6
s
C V
E
(3)
where Vmax is the estimated cell voltage after the IR drop.
The power density (P, W kg-1) of the cell was calculated by Eq. (4):
3600 E P t
(4)
[image:4.596.90.504.475.635.2]3. RESULTS AND DISCUSSION
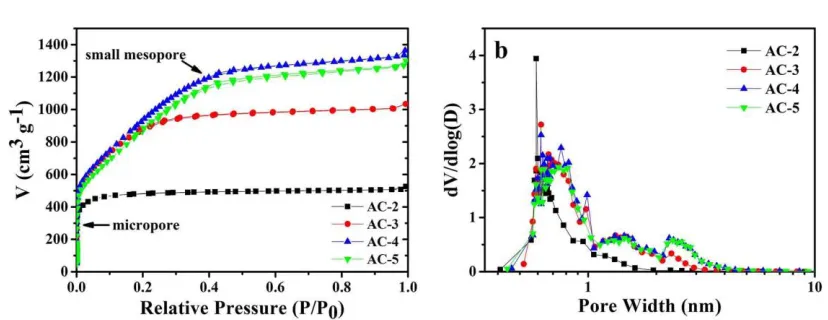
Figure 2. (a) The nitrogen adsorption-desorption isotherms of ACs. (b) The PSD curves of ACs.
[image:5.596.122.479.329.676.2]
pore volume increased gradually as X rose from 2 to 4, then declined when X reached 5, indicating the production of more mesopores as KOH increased [6]. The recorded maximum values of SSA and pore volume were 3512.83 m2 g-1 and 2.11 cm3 g-1 for X=4, respectively. The PSD curves of Fig. 2b depicted that all samples have a substantial number of mesopores with sizes ranging from 2-3 nm, except for sample AC-2.
Table 1. SSA and pore volume values of all prepared AC samples
Sample SBET (m2 g−1) Vtotal(cm3 g-1) Vmicro(cm3 g-1) Vmes/Vtotal (%)
AC-2 1878.89 0.81 0.73 9.9
AC-3 3106.44 1.60 1.22 23.8
AC-4 3512.83 2.11 1.28 39.3
AC-5 3313.27 2.01 1.15 42.8
SBET: BET specific surface area; Vtotal: Total pore volume; Vmicro: Micropore volume; Vmes:Mesopore volume.
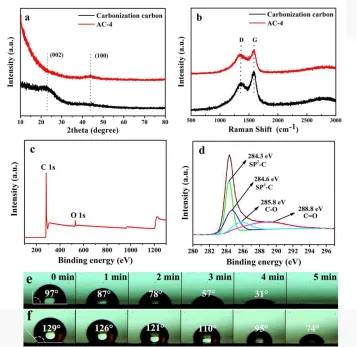
The XRD patterns of AC-4 in comparison with carbon carbonized at 350 oC are shown in Fig. 3a. Two broad peaks located at 2θ of 22.7° and 44° assigned to the (002) and (100) planes of carbon were recorded. While the (002) peak of AC-4 sample looked indistinct, the intensity of the (100) peak significantly increased, suggesting that the carbon structure suffered destruction during the KOH-activation process. The Raman spectra of Fig. 3b showed two clear peaks at 1358 cm-1 (D-band) and 1584 cm-1 (G-band), corresponding to the defected carbon and the crystallites graphite, respectively [21]. The intensity ratio (ID/IG) is proportional to the crystalline degree of carbon [22]. The estimated ID/IG values of carbonization carbon and AC-4 were 0.78 and 0.85, respectively. The elevated value of AC-4 was attributed to the severe damage of graphite crystallite caused by KOH etching process that resulted in increased disorder of carbon [23]. In addition, the XPS results of Fig. 3c revealed that the AC-4 sample contained only carbon (95.76%) and oxygen (4.24%). The high-resolution C1s spectra shown in Fig. 3d might be deconvoluted into four peaks, consisting of sp2-bonded carbon (284.3 eV), sp3-bonded carbon (284.6 eV), C-O (285.8 eV), and C=O (288.8 eV). These oxygen-containing groups could improve the wettability of the electrolytes, resulting in enhanced accessibility of ions to more surface area to yield increased specific capacitances [24, 25]. The dynamic water contact angle measurement of Fig. 3e revealed an initial contact angle of 97° for the AC-4 electrode but vanished after 5 min. By contrast, the commercial AC was very hydrophobic to yield an initial contact angle of 129° that remained at 74° after 5 min (Fig. 3f).
[image:6.596.101.495.412.707.2][image:7.596.156.430.394.609.2]
The CV curves of the ACs samples at 100 mV s-1 scan rate are presented in Fig. 4a. All the curves roughly displayed similar rectangular shapes, indicating an ideal EDLC behavior. The specific capacitances calculated from the CV curves were 122, 183, 235 and 211 F g-1 for AC-2, AC-3, AC-4 and AC-5, respectively. The symmetrical straight-lined GCD curves of Fig. 4b also indicated typical EDLC characteristics. An elevated specific capacitance reaching up to 244 F g-1 at a current density of 10 A g-1 was obtained with the AC-4. Meanwhile, a lower internal resistance (IR) drop of 14 mV was recorded with AC-4 if compared to AC-2. This indicated a higher power density, which was consistent with the rate performance (Fig. 4c). As the current density increased, the capacitance change for AC-3, AC-4 and AC-5 followed similar trends, while a sharp decrease was noticed with AC-2 at high current densities (only 76 F g-1 at 100 A g-1 was recorded). This suggested that mesopores structure are favorable for fast ions transfer at elevated current densities [11, 26]. Thus, it might be concluded that AC-3, AC-4, and AC-5 had better electrochemical performances than AC-2. The sample AC-4 delivered a high specific capacitance of respectively 325 and 232 F g-1 at 0.1 and 100 A g-1, with 71% capacitance retention. On the other hand, though Vmes/Vtotal for AC-5 was high (42.8%), the mesopore increased while the SSA declined, resulting in slightly reduced capacitance (286 F g-1). The AC-4 exhibited an excellent reversibility with ~89% capacity retention after the 10000 cycles at 1 A g-1 (Fig. 4d).
Figure 5. Ragone plots of ACs based supercapacitors.
The Ragone plots of Fig. 5 exhibited an outstanding performance for AC-4 in the two-electrode supercapacitor system in aqueous electrolyte. The AC-4 provided a power densities ranging from 25 W kg-1 to 21.75 kW kg-1,corresponding to energy densities varying from 11.28 Wh kg-1 to 6.11 Wh kg-1.
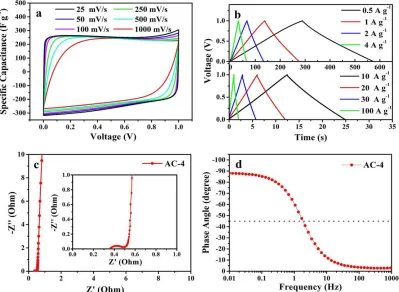
Figure 6. Electrochemical performance of AC-4 measured in 6 M KOH aqueous electrolyte. CV curves of AC-4 at various scan rates (a), GCD curves at different current densities (b), Nyquist plot (c), and the Bode plot (d).
Fig. 6a depicts the CV curves of AC-4 in 6 M KOH electrolyte at scan rates varying from 25 to 1000 mV s-1. A perfect rectangular shape was obtained at a scan rate of 50 mV s-1 and even at the high scan rates of 1000 mV s-1, the electrode maintained the quasi-rectangular shape. Meanwhile, all the GCD curves looked highly symmetrical at various current densities between 0.5 to 100 A g-1 (Fig. 6b). Hence, both the CV and charge-discharge results indicated the ideal and excellent EDLC behavior. The recorded specific capacitances of AC-4 were respectively 285 and 232 F g-1 at current densities of 0.5and 100 A g-1, with an acceptable IR drop.
[image:8.596.100.499.83.375.2][image:9.596.98.503.134.428.2]
demonstrated that the presence of mesopores largely increased the ion diffusion rate, leading to an excellent rate performance and power density [30, 31].
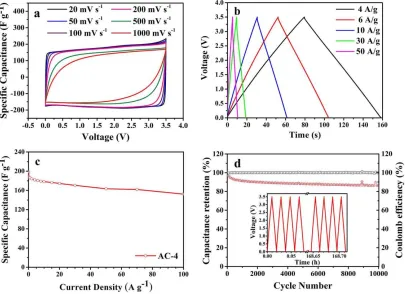
Figure 7. Electrochemical performance of the AC-4 in the EMIMBF4 electrolyte. CV at different scan rates (a), GCD curves at various current densities (b), rate performance (c), and capacitance retention and coulomb efficiency at a current density of 10 A g-1 in the EMIMBF4 electrolyte (d).
Figure 8. Ragone plots of AC-4 compared with biomass-derived carbon.
Compared with others biomass-derived carbon, including rice bran, silk, human hair, glucose and enteromorpha, the symmetric supercapacitors based on AC-4 exhibited a high energy density of 84.3 Wh kg-1 at 87.5 W kg-1 (Fig. 8). More importantly, the electrode retained 46.6 Wh kg-1 at the ultrahigh power density of 74.2 kW kg-1, which was better than results of rice bran [32], silk [33], human hair [34], glucose [35] and enteromorpha [36]. The AC-4 also showed superior values than those of commercial devices (pseudocapacitor <30 Wh kg-1) [37] and hybrid supercapacitor ~60 Wh kg-1 [38]). The supercapacitors can fully be recharged within 2.3 s, achieving an elevated energy density of 46.6 Wh kg-1 under the high power density of 74.2 kW kg-1. These findings showed that AC-4 is a promising electrode material for supercapacitors, especially for high power application.
4. CONCLUSIONS
ACKNOWLEDGEMENTS
This study was financially supported by the National Natural Science Foundation of China (No: 51162006, 51362009), international S&T cooperation program of Hainan province (KJHZ2015-02) and key programs of Hainan province (ZDXM2015118).
References
1. P. Simon, Y. Gogotsi, Nat. Mater., 7 (2008) 845-854.
2. G. Wang, L. Zhang, J. Zhang, Chem, Soc. Rev., 41 (2012) 797-828. 3. L.L. Zhang, X.S. Zhao, Chem, Soc. Rev., 38 (2009) 2520-2531.
4. J. Liu, J.G. Zhang, Z. Yang, J.P. Lemmon, C. Imhoff, G.L. Graff, L. Li, J. Hu, C. Wang, J. Xiao, Adv. Funct. Mater., 23 (2013) 929-946.
5. Y. Dai, H. Jiang, Y. Hu, Y. Fu, C. Li, Ind. Eng. Chem. Res., 53 (2014) 3125-3130.
6. Y. Gao, W. Zhang, Q. Yue, B. Gao, Y. Sun, J. Kong, P. Zhao, J. Power Sources, 270 (2014) 403-410.
7. J. Chmiola, G. Yushin, Y. Gogotsi, C. Portet, P. Simon, P.L. Taberna, Science, 313 (2006) 1760-1763.
8. A. Pandolfo, A. Hollenkamp, J. Power Sources, 157 (2006) 11-27.
9. J. Huang, B.G. Sumpter, V. Meunier, Angew. Chem. Int. Edit., 47 (2008) 520-524.
10. T.E. Rufford, D. Hulicova-Jurcakova, Z. Zhu, G. Lu, J. Phys. Chem. C, 113 (2009) 19335-19343. 11. H. Jiang, P.S. Lee, C. Li, Energy Environ. Sci., 6 (2013) 41-53.
12. T. Panja, D. Bhattacharjya, J. Yu, J. Mater. Chem. A, 3 (2015) 18001-18009. 13. W. Su, L. Zhou, Y. Zhou, Carbon, 41 (2003) 861-863.
14. M. Galinski, K. Babeł, K. Jurewicz, J. Power Sources, 228 (2013) 83-88.
15. L. Sun, C. Tian, M. Li, X. Meng, L. Wang, R. Wang, J. Yin, H. Fu, J. Mater. Chem. A, 1 (2013) 6462.
16. J. Mi, X.R. Wang, R.J. Fan, W.H. Qu, W.C. Li, Energy Fuel, 26 (2012) 5321-5329. 17. W. Heschel, E. Klose, Fuel, 74 (1995) 1786-1791.
18. J. Zhao, H. Lai, Z. Lyu, Y. Jiang, K. Xie, X. Wang, Q. Wu, L. Yang, Z. Jin, Y. Ma, J. Liu, Z. Hu, Adv. Mater., 27 (2015) 3541-3545.
19. J. Yin, D. Zhang, J. Zhao, X. Wang, H. Zhu, C. Wang, Electrochim. Acta, 136 (2014) 504-512. 20. D. Kang, Q. Liu, J. Gu, Y. Su, W. Zhang, D. Zhang, ACS Nano, 9 (2015) 11225-11233.
21. V. Zólyomi, J. Koltai, J. Kürti, Phys. Status Solidi B, 248 (2011) 2435-2444.
22. Z. Li, Z. Xu, X. Tan, H. Wang, C.M. Holt, T. Stephenson, B.C. Olsen, D. Mitlin, Energy Environ. Sci., 6 (2013) 871-878.
23. K. Wang, N. Zhao, S. Lei, R. Yan, X. Tian, J. Wang, Y. Song, D. Xu, Q. Guo, L. Liu, Electrochim. Acta, 166 (2015) 1-11.
24. V. Ruiz, C. Blanco, E. Raymundo Piñero, V. Khomenko, F. Béguin, R. Santamaría, Electrochim. Acta, 52 (2007) 4969-4973.
25. M.J. Bleda Martínez, J.A. Maciá Agulló, D. Lozano Castelló, E. Morallón, D. Cazorla Amorós, A. Linares-Solano, Carbon, 43 (2005) 2677-2684.
26. D.W. Wang, F. Li, M. Liu, G. Lu, H.M. Cheng, Angew. Chem. Int. Edit., 120 (2008) 379-382. 27. H. Liu, P. He, Z. Li, Y. Liu, J. Li, Electrochim. Acta, 51 (2006) 1925-1931.
28. E. Frackowiak, F. Beguin, Carbon, 39 (2001) 937-950.
29. X. Yang, C. Cheng, Y. Wang, L. Qiu, D. Li, Science, 341 (2013) 534-537. 30. M.F. El-Kady, V. Strong, S. Dubin, R.B. Kaner, Science, 335 (2012) 1326-1330.
31. Y. Xu, Z. Lin, X. Zhong, X. Huang, N.O. Weiss, Y. Huang, X. Duan, Nat. Commun., 5 (2014). 32. J. Hou, C. Cao, X. Ma, F. Idrees, B. Xu, X. Hao, W. Lin, Sci. Rep., 4 (2014) 7260.
34. W. Qian, F. Sun, Y. Xu, L. Qiu, C. Liu, S. Wang, F. Yan, Energy Environ. Sci., 7 (2014) 379-386. 35. T. Tooming, T. Thomberg, H. Kurig, A. Jänes, E. Lust, J. Power Sources, 280 (2015) 667-677. 36. W. Yu, H. Wang, S. Liu, N. Mao, X. Liu, J. Shi, W. Liu, S. Chen, X. Wang, J. Mater. Chem. A,
(2016).
37. M. Sevilla, R. Mokaya, Energy Environ. Sci., 7 (2014) 1250.
38. Y. Ma, H. Chang, M. Zhang, Y. Chen, Adv. Mater., 27 (2015) 5296-5308.