Turkey
.
White Rose Research Online URL for this paper:
http://eprints.whiterose.ac.uk/130821/
Version: Published Version
Article:
Alkay, E., Watkins, C. orcid.org/0000-0002-1249-9473 and Keskin, B. (2018) Explaining
spatial variation in housing construction activity in Turkey. International Journal of Strategic
Property Management, 22 (2). pp. 119-130. ISSN 1648-715X
https://doi.org/10.3846/ijspm.2018.443
© 2018 The Author(s). Published by VGTU Press This is an Open Access article
distributed under the terms of the Creative Commons Attribution License
(http://creativecommons.org/licenses/by/4.0/), which permits unrestricted use, distribution,
and reproduction in any medium, provided the original author and source are credited.
[email protected] https://eprints.whiterose.ac.uk/ Reuse
This article is distributed under the terms of the Creative Commons Attribution (CC BY) licence. This licence allows you to distribute, remix, tweak, and build upon the work, even commercially, as long as you credit the authors for the original work. More information and the full terms of the licence here:
https://creativecommons.org/licenses/
Takedown
If you consider content in White Rose Research Online to be in breach of UK law, please notify us by
Copyright © 2018 he Author(s). Published by VGTU Press
his is an Open Access article distributed under the terms of the Creative Commons Attribution License (http://creativecommons.org/licenses/by/4.0/), which permits unre-stricted use, distribution, and reproduction in any medium, provided the original author and source are credited.
*Corresponding author. E-mail: [email protected]
ISSN: 1648-715X / eISSN: 1648-9179 2018 Volume 22 Issue 2: 119–130 https://doi.org/10.3846/ijspm.2018.443
EXPLAINING SPATIAL VARIATION IN HOUSING CONSTRUCTION
ACTIVITY IN TURKEY
Elif ALKAY1, Craig WATKINS2,*, Berna KESKIN2
1 Department of Urban and Regional Planning, Istanbul Technical University, Istanbul 34437, Turkey 2 Department of Urban Studies and Planning, University of Sheield, Western Bank, Sheield S10 2TN, UK
Received 22 March 2016; accepted 8 March 2017
Abstract. In Turkey, there has been a strong policy narrative that has emphasized the importance of construction activ-ity as a driver of economic growth. his has given shape to a central state-led policy regime that has sought to ensure that planners and other urban policy makers develop plans and strategies that support construction activity. Against this backdrop, and a recent history of uneven spatial development, this paper seeks to understand what this policy imperative might mean for housing construction activity in diferent provinces. It seeks to relect on both the relationship between the state and the market, and the interaction between state policies, economic drivers and levels of construction activity. he evidence presented in the paper suggests that uneven spatial development might be explained in diferent ways in diferent provinces. Although, in many cases, patterns of construction activity are consistent with economic fundamentals, there are important exceptions in some regions where arguably activity levels are at odds with prior expectations.
Keywords: housing construction, spatial analysis, Turkey, economic growth, planning policy.
Introduction and motivation for the study
Although there is a long-standing interest in understand-ing the cyclical forces that drive economic growth and urban development, much of the empirical analysis has tended to focus on the United Kingdom and North Amer-ica (see Buckley, 1952 for an example; and Barras, 2009 for a review). he analysis also tends to focus on either national trends (Tsolacos, McGough, & Keogh, 1998) or city case studies (Barras, 1984; Fainstein, 2001). his pa-per is intended to both build on and extend the insights from this literature. It does so, irst, by exploring the re-lationship between economic growth and construction in an emerging (as opposed to mature) real estate market context, and second, by examining intra-regional difer-ences within the study area which, in this case, is Turkey. As in many emerging markets, there has been an in-tense focus on the workings of the real estate sector and on the levels of construction sector activity in Turkey. his is a result of the primacy given to development activity as a driver of economic growth by central government. he real estate market is viewed as a means of attracting glob-ally circulating capital, of stimulating the inlux of foreign investment and of inducing construction activities, all of
which have been viewed as efective strategies for acceler-ating economic growth since 2000 (Eraydin & Tasan-Kok, 2014). Since the inancial crisis in 2001, the decrease in interest rates, low inlation rates and the strong growth rates in the economy have stimulated investment in the property market. In addition to the signiicant economic recovery process, the reforms on construction sector have driven the increased demand and supply in the user, in-vestor and developer submarkets of the real estate sector (Coskun, 2011).
hus, instead of relying solely on market dynamics, the state took an active role in market stimulus by changing the legislation to facilitate reconstruction in brownield areas (Eraydin & Tasan-Kok, 2014; Celik, 2013) and by directly proving land for these large scale projects. In the last decade, the economic growth in Turkey has been un-derpinned to a large degree by these government led re-forms with urban property markets used as a key vehicle for growth (Eraydin & Tasan-Kok, 2014).
Against this backdrop, this paper posits that there is a need to understand the diferent factors that shape the relationship between economic growth and housing construction levels. We contend that such a discussion: can help understand and better inform the role of central and local policies intended to foster housing construction growth, and to provide lexible business environment for housing investments; can help determine the potentials (or limitations) of diferent areas that have attracted (or failed to attract) construction investment; can enhance our understanding of the role of planning at local and national level and its contribution in particular in en-couraging housing investments; can help us relect on the strengths and weaknesses of current spatial variations in attempts to develop sustainable development strategies. At the heart of this analysis is the concern that uneven development of housing construction might be driven by speculative housing bubbles in individual cities, where real estate values and market activity have become divorced from economic fundamentals. Our analysis is tended to inform policy development in emerging markets. In this context the overall aim of this paper is to explore the re-lationship between policy interventions and initiatives, housing construction activity, and economic growth in Turkey between 2002/3 and 2013.
he paper has four further sections. Section 1 pro-vides a review of the literature that explores the relation-ship between public policy, markets and development ac-tivity. his review ofers a clear indication of the myriad inluences that shape development activity in diferent contexts. Section 2 sets out the design of our empirical research. Section 3 provides an overview of the study area and outlines the trends in key economic and construc-tion sector indicator. It also sets out the initial indings based on our spatial statistical analysis. Section “Conclu-sions” ofers some preliminary conclusions and sets out an agenda for further research.
1. Literature review
here has been long-standing interest in the relationship between construction activity in the wider economy. One strand of the literature has focused on the economic im-pacts of construction (see Turin, 1969; Strassmann, 1970), while the other has looked at the way in which the econ-omy has shaped the pattern and volume of construction activity (Barras, 2009).
In the former context, Bon (1992) takes a very long-term view of construction activity in diferent countries
and argues that construction’s contribution to economic growth varies at diferent points in the business cycle. He explains that, in general, construction’s contribution to economic output takes a bell shaped pattern, rising initial-ly but falling again over time. He also notes that construc-tion activity has a global dimension with activity spilling over from advanced economies with high levels of physi-cal capital to emergent and developing market contexts. More recently, Ruddock and Lopes (2006) revisited the idea of the Bon curve and, although using data spanning diferent time periods, provide empirical challenge to the notion that the decline in contribution to the economy is inevitable. Sun, Mitra, and Simone (2013) build on this analysis, and using error correction modelling show that the pro-cyclical outcomes are also inluenced by demo-graphics and geography.
Even within the increasingly voluminous international literature that explores the real estate construction cycles, the literature is divided into two signiicant strands: one that deals with non-residential development activity and another that deals with housing sector activity. Both of these strands of the literature provide a useful basis from which to identify the key interactions between public policy and the market and the key drivers of constriction activity.
Studies of the non-residential development cycle tend to be dominated by time-series econometric analyses (Nanthakumaran, Watkins, & Orr, 2000; Tsolacos et al., 1998). Increasingly, these studies have explored the mar-ket supply side (that is development activity) as part of analytical framework that recognises that the commercial real estate sector can usefully to be conceptualised as com-prising a set of inter-linked submarkets where both user rights to space (referred to inter alia as the user, occupier or space market) or where investor rights (referred to as the asset, capital or investor market) are traded (see Di-Pasquale & Wheaton, 1996; Keogh, 1994; Fisher, 1992). hese models demonstrate that development or construc-tion activity is inluenced by three key drivers: the busi-ness cycle (Key, Zarkesh, MacGregor, & Nanthakumaran, 1994), investment motives (including the ‘magical’ prop-erties of real estate, see Keogh, 1994), and development motives that, at times, include autonomous speculative components and herd behaviour (Grenadier, 1995; Bar-ras, 2009). One of the main limitations of these models is that they tend to pay little attention to the role of public policy in shaping real estate actor behaviour in ways that can restrict or enhance the development response (Jack-son & Watkins, 2005, 2007).
he housing supply literature is slightly diferent in ori-entation. While this literature is also dominated by econo-metric analyses, housing studies tend to pay less attention to investment considerations (other than implicitly) and in-stead is more likely to pay attention to the role of the state and the impact of policy interventions on market outcomes (see Dawkins & Nelson, 2002; White & Allmendinger, 2003; Bramley, 2003, 2013 for reviews of the international litera-ture). hus, typically, the supply of housing is driven by land values, previous and expected future real estate prices, the cost of borrowing, construction costs, and the planning policy regime. he literature shows that the impact of the policy regime varies considerably between countries, within countries and over time. he methods used to measure pol-icy interventions vary from simple measures based on the proportion of planning applications granted to composite variables based on the survey responses of policy makers (Bramley & Watkins, 1995; Bramley, 1998).
he weakness in all of these studies is that the measure-ment of the planning regime and/or policy stance tends to be imperfect. Adams and Watkins (2014) argue that these models tend to under-elaborate the multi-dimensional and complex nature of policy interventions and of state inluence on markets. here are three important problems: (i) they under-state the importance of policy in creating a setting for investment and thus fail to allow for the impact on the de-mand-side of the market (Begg, 2002; Jackson, 2006; Jackson & Watkins, 2011); (ii) they tend to overlook the complex and oten conlicting inter-play between diferent policy initia-tives (Wong & Watkins, 2009); and (iii) they fail to take ac-count of the importance of institutional design in mediating and mitigating the intended impacts of policy interventions (Adams & Tiesdell, 2010). Adams and Watkins (2014) go on to argue that a more pluralist research approach is required if we are to fully understand the relationship between the state (policy instruments and strategies) and market out-comes, including the level of development activity.
he next section of this paper begins to apply some of the ideas from this body of literature. We start by using regression analysis to understand the causal relationship between economic fundamentals and construction activ-ity. In the absence, however, of quantitate measures of policy stance or regime, we use the residuals to begin to identify where activity deviates from normal patterns that might be expected under given economic circumstances. We argue that the typology constructed here provides a basis from which to develop a more qualitative investiga-tion of the role and inluence of policy interveninvestiga-tions on construction activity in diferent regional economies.
2. Research design, data and methods
2.1. Data
he data used in this paper is derived from two main sources. he irst dataset is drawn from the Turkish Sta-tistical Institute (TUIK) and is collated at NUTS-3 prov-ince level; it includes construction permit rates during the
2002–2013 period. Construction permit rates are classiied according to building types such as housing, hotels, oice buildings, buildings served retail and wholesale, industrial buildings and depots. Since it does not include the other segments of the construction sector such as dams, high-ways, railhigh-ways, airports etc., the data set relect the volume of constructed buildings rather than activity in the whole sector, including infrastructure projects. hus, when we discuss construction activity, the focus as in the literature review is on housing and non-residential building activity. he second data source is a set of socio-economic in-dices generated by a research initiative known as “he so-cio-economic development levels of provinces” developed by the Ministry of Development. his initiative research was developed initially by the State Planning Organization in 2003 with data collection was repeated in 2013 by the Ministry of Development. Although this second wave de-veloped more indicators than the irst one, they both used the same methods and statistical methods to construct the indicators used here. he 2003 project developed 58 in-dicators that were classiied under 2 subheadings: social indicators (demography, employment, education, health, infrastructure and other welfare indicators) and economic indicators (manufacturing sector, construction, agricul-ture and iscal indicators). In 2013 this was extended to 61 indicators that were classiied under 8 subheadings: demography, employment, education, health, iscal indica-tors, quality of life indicaindica-tors, competitive and innovative capacity indicators, and, accessibility. he index construc-tion methods in both periods used a principal compo-nent analysis where the principal compocompo-nent that had the highest variance explanation rate was assigned the main causative factor. he index values calculated based on the main causative factor allowed provinces to be ranked by index values.
2.2. Analytical methods
he exploratory spatial and statistical analyses reported here have been developed in two steps. First, the relation-ship between construction growth and socio-economic development level was explored using OLS regression at the aggregate level. he second step focuses on the spa-tially uneven levels of construction growth evident in the aggregate data. his is analysed using Moran-I statistics to test for spatial autocorrelation in the regression residuals. Local Moran-I analysis was undertaken to detect whether the provinces are clustered relative to their socio-econom-ic development and construction growth levels.
respectively. he second 2 equations were used 2013 data. he equations took the standard form:
1 2 1 2; 1 2
t t
C R t
Y X −
− − = α + β + ε (1)
where: Y is the construction permit rate in 2003 (t1) and
2013 (t2) and for the all types of constructed buildings
(Ct1 2− ) and permits to residential units (Rt1 2− ) in those years;
X is the socio-economic development level index values in 2003 (t1) and 2013 (t2); β is the estimated parameter that
shows the relationship between construction growth and socio-economic development level. he positive value β shows the economic development level has positively af-fect the construction growth. Conversely, a negative value
β shows the economic development level has reduced the rate of construction growth.
While these equations model the relationship, the resid-ual part (ε) of the equations illustrates that much of the ac-tivity cannot be explained by social and economic change. Spatial analysis of the residuals can, however, provide some insight into what might be missing from the models and can point to where unmeasured factors, such as state in-tervention, might be having an impact on construction activity levels. Positive values in the residuals suggest that the other factors are likely to ofer a better explanation for the growth in construction volumes than the socio-eco-nomic development factors included in the model. As we note above, theory tells us that those major factors might include central or local government’s policies and public investments, and will encompass the role of spatial plan-ning, the efect of land use regulations, zoning regulations and restrictions, the capacity of land supply for alternative uses, building construction permit ratios and other policy initiatives. Since the both data sets are in NUTS3 level, it is possible to begin to unpack the role of planning and state intervention on the growth of the construction sector on activity in individual cities. his provide an opportunity for comparison and further discussion.
he motivation for our spatial analysis is thus based on the proposition that construction sector investments, and housing construction in particular, should, based on prior economic theory, relect growth patterns at the ag-gregate level. Indicators of spatial association are statis-tics that evaluates the existence of clusters in the spatial arrangement of given variables. Local clusters are groups that have higher or lower rates than might be expected and display statistically signiicant variations that cannot be explained by chance alone. hat is to say, the values occurring are above or below those that would be associ-ated with a random distribution in space. In practice, this means that a straightforward Local Moran-I statistic can be applied to measure the overall clustering of the data. It assumes homogeneity and thus, the null hypothesis H0 is that there is no autocorrelation. If there is no autocorrela-tion, the fact that two points are close to or distant from each other has no bearing on the relationship between the values at those locations. Conversely, if there is a positive spatial autocorrelation, proximity in space should indicate
that there are similarities in attribute values. his allows us to look for patterns (or relationships) within the two key groups identiied in our OLS analysis: those where socio-economic factors explain much of the activity; and those where socio-economic factors explain relatively little of what has been happening in the sector.
he Local Moran-I analysis was applied using the spa-tial analysis program GeoDa. he Local Moran-I approach evaluates clusters in individual units by calculating local Moran-I values for each spatial unit. It allows us to detect local spatial clusters, where the local indicators are caus-ally large or small. While positive I values indicate that the feature is surrounded by features with similar values, negative I values indicate that the feature is surrounded by features with dissimilar values. Spatial clusters shown on the Local Moran-I map only refer to the core of the cluster. We identify an area as being part of a cluster when the value at a location (either high or low) is more simi-lar to its neighbors than would be the case under spatial randomness.
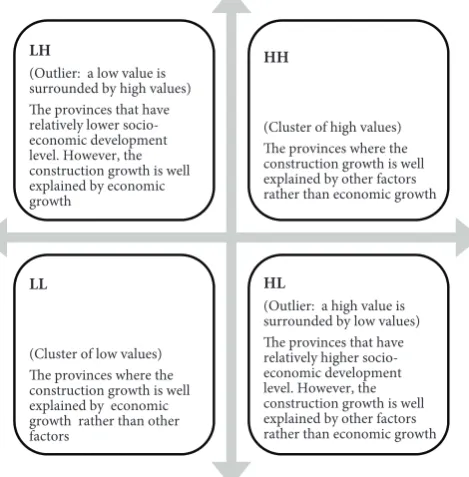
Local Moran-I’s graph is visualized as the slope in the scatter plot with the spatially lagged variable (a sum of spatial weights multiplied with values for observations at neighboring locations) on the vertical axis and the origi-nal variable on the horizontal axis. Figure 1 summarises the characteristics of each quadrant. In short, each quad-rant is deined based on the Local Moran-I analysis of the residuals and assigns provinces to groups based on the extent to which construction activity can be explained by social and economic indicators. he graph shows four dif-ferent quadrants that are each didif-ferent in their clustering characteristics. he HH (High, High) and LL (Low, Low) quadrants show the positive autocorrelations, while both the HL and LH quadrants show negative autocorrelations and outliers.
LH
(Outlier: a low value is surrounded by high values) The provinces that have relatively lower socio-economic development level. However, the construction growth is well explained by economic growth
HH
(Cluster of high values) The provinces where the construction growth is well explained by other factors rather than economic growth
LL
(Cluster of low values) The provinces where the construction growth is well explained by economic growth rather than other factors
HL
[image:5.581.293.528.491.730.2](Outlier: a high value is surrounded by low values) The provinces that have relatively higher socio-economic development level. However, the construction growth is well explained by other factors rather than economic growth
he quadrants allow us to explore the within group similarities and between group dissimilarities in the rate of construction activity and its associated drivers. he dif-ferences hint at the factors that might be causing a dis-juncture between construction activity and the aspects of construction growth underpinned by social and economic factors. For instance, we hypothesise that provinces in HH quadrant can be interpreted as localities that stimulate de-mand creating factors, while the provinces in LL quadrant might be interpreted as provinces that stimulate supply. In this context, demand creating factors include direct public investments, and government incentives as well as the role of planning stimulus (Adams & Watkins, 2014). Supply creating include the internal, inherent characteristics of the provinces such as the physical suitability of land for development; the extent and nature of existing develop-ment; the level of planning controls and planning con-straints; and lexibilities in local land supply and planning permissions. Other relevant issues, of course, include the inluence of redevelopment costs, land values in existing uses and land costs.
he HL and LH quadrants are outliers in terms of the relationship between economic fundamentals and con-struction activity. he provinces in the HL quadrant have a mismatch between socio-economic performance and eco-nomic development levels. In these cases, it might be that public investments or lexibility in planning regulations or land supply corresponding mixed-used developments are more signiicant in determining the level of activity. he LH provinces exhibit the polar opposite outcomes from those in the LH quadrant. he question in those localities is what factors have move forward construction beyond the socio-economic development level.
In summary, the questions raised about the relationship between construction activity and economic performance in each quadrant help set the research agenda. It is clear that we need to know more about the nature of the market and inluence of local policy intervention and stances.
3. Empirical analysis of the relationship between the state, the market and development activity
3.1. National economic trends and activity
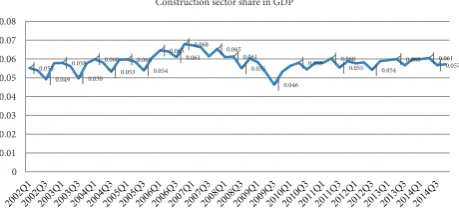
his section of the paper provides an overview of the driv-ers of the construction sector and real estate market in Turkey. Although partly pre-dating our study period and not shown on the chart below, the share of GDP from con-struction sector activity has been 6% on average between 1998 and 2014 (see Figure 2). he lowest share between 1998 and 2014 was 4% in the second quarter of the 2001, while the highest share was 6.7% in the last quarter of 2006 (Turkish Statistical Institute, 2015a). Although the share of GDP seems to have luctuated signiicantly prior to 2010, it has clearly been more stable in recent years. he share decreased markedly irst in 2001 because of the Turkish economic crisis, and then again in the third quarter of the 2009 as a result of the 2008 world economic crisis.
While these increases in construction activity appear to have been driven, in large part, by luctuations in eco-nomic growth, it is important, given the two-way relation-ship between construction activity and economic activity, to identify the nature and direction of the causal relation-ship between the two.
[image:6.581.308.538.64.170.2]Economic growth
Figure 3 shows the growth rates of Turkey’s economy in the 2003–2014 periods. he red line shows the rate of change in GDP at constant prices. he blue line shows the growth rates occurred in the construction sector share in GDP. In 2003 as Turkey’s economy grew by 5.2% in real terms from the previous year, the share of the construction sector in the GDP grew by just 2.5%. When the economy contracted by 4.8% in real terms in 2009; the fall in the share of GDP from the construction sector was dramatic at 11%. he correlation coeicient between these two se-ries is 0.84 over the period. hus, as might be expected, the real growth and the change in the rate of the construc-tion sector in GDP have a direct and strong relaconstruc-tionship but it is clearly not a perfect relationship (Turkish Statisti-cal Institute, 2015a).
2.53 4.22
0.78 10.68
1.08
–8.70
2003 2004 2005 2006 2007 2008 2009 2010 2011 2012 2013 2014
–11.43 7.68
2.60
–1.52 –0.63 5.27
9.36 8.40
6.89 4.67
0.66
9.16 8.77
2.13 2.87
–15 –10 –5 0 5 10 15
%
Growth rates (%)
Growth Rate of Construction Sector Share in GDP Real GDP Growth
Growth Rate of Manufacturing Sector Share in GDP
Figure 3. Economic growth rates
Employment trends
National employment igures between 2005 and 2015 il-lustrate the importance of the construction sector (see Figure 4). Total employment in the construction sec-tor reached 7.3% in 2014 compared with 5.6% in 2005. he highest share of the construction employment in to-tal employment was 7.3% in the last quarter of the 2013 (Turkish Statistical Institute, 2015b). his share was still at
0.055 0.049
0.058 0.050
0.060 0.053
0.060 0.054
0.065 0.061
0.068 0.065
0.061 0.055
0.046 0.058 0.060
0.055 0.054 0.060 0.061
0.057
0 0.01 0.02 0.03 0.04 0.05 0.06 0.07 0.08
Construction sector share in GDP
[image:6.581.304.544.506.614.2]6.7% in the irst quarter of the 2015. Given that the share of GDP from the construction sector is around 6%, it might be argued that the construction sector’s role in job creation is greater than its weight in terms of output growth.
House price appreciation and investment motives
Residential development activity has also, as is the case globally, been driven by investment motives as well as eco-nomic cycles (Coskun, 2011). In each of the last ive years (2010–2014), house prices in Turkey have increased by 63% on average. Within Istanbul, the rate of appreciation has been 115% with increase in some parts of the Istanbul market at 175% (Turkish Central Bank, 2015a).
It is instructive to look at these trends relative to those of other inancial assets including gold prices, exchange rates (which govern the value of currency market invest-ments) and the Istanbul Stock Exchange index in last ive years. Central Bank data shows that the price per gram of gold bullion has increased 68% in the last ive years; while the price of the US dollar against TL has valued 84%; and he Istanbul Stock Exchange 100 index gained 56% in val-ue (Turkish Central Bank, 2015b). When compared with housing prices, an investor who bought a house in Istan-bul in last ive years will have has achieved 57% greater gross return than from the other investments.
his, however, is not the case for other City housing markets in Turkey. Investing capital in US Dollars in-stead of buying a house in city other than Istanbul would achieve an average of 33% greater gross return. he aver-age return of investing gold and Istanbul Stock exchange would similar to the return from buying a house.
he general price level (inlation) in the period between 2010 and 2015 in Turkey has been 46% (assuming the year 2010 as 100 basis points, the year 2015 is 146 basis points) (Turkish Central Bank, 2015c). hus, in the last 5 years pe-riod, investors who bought a house in Istanbul has achieved a 64% return on average in real terms. he average real in-crease in housing prices outside Istanbul is around 17%.
Credit availability
he availability of credit and mortgage inance also ap-pears to play an important part in what has happened in the housing part of the construction sector. he total amount of annual mortgage credits, the number of peo-ple accessing credit and mortgage credit interest rates for 2002 to 2014 are discussed below (he Banks Association
of Turkey, 2015). heoretically, we might expect to see an inverse relation expected between mortgage interest rates and the amount of mortgage credits; and, conversely, we would anticipate a positive relationship between between economic growth and mortgage credit levels.
Total mortgage credits were 258 million TL in 2002, rising to 36524 million TL by 2014. Importantly there was a change in mortgage legislation enacted in 2007 which introduced loans at more favourable lending rates and over longer terms than had previously been the case. he mortgage credit volume was stable between 2006 and 2008. For the three years before this period, however the year on year increase in total mortgage credits in was between 200%, and 400%. More recently we have seen a much more modest 77% increase between 2012 and 2013, and a decrease of 28% in 2014 (he Banks Association of Turkey, 2015, see Figure 5).
0 10000 20000 30000 40000 50000 60000
[image:7.581.36.277.63.152.2]2002 2003 2004 2005 2006 2007 2008 2009 2010 2011 2012 2013 2014 Mortgage credit (Million TL)
Figure 5. Mortgage credit availability
he total mortgage credit and the volume of credit us-ers are closely related. While the 10915 people used mort-gage credits in 2002, this amount reached to 384,000 in 2014 (Figure 6). he number of mortgage credit users in-creased 147% in 2003 relative to 2002. he annual increase was 272% in 2004 and 171% in 2005. he annual increase was 60% in 2013 before a year on year fall of 34% was observed in 2014 (he Banks Association of Turkey, 2015).
0 100 000 200 000 300 000 400 000 500 000 600 000 700 000
2002 2003 2004 2005 2006 2007 2008 2009 2010 2011 2012 2013 2014 Mortgage credit (number of credit users)
Figure 6. Mortgage credit users
[image:7.581.289.523.277.357.2]Importantly, the scale of mortgage credit per capita has altered over the study period. he average credit amount used in 2002 is about 24,000 TL rising to about 95,000 TL in 2014. he real per capita amount of credits increased 76% in 2005 according to previous year. Mortgage credit per capita decreased twice on a year on year basis in 2004 and 2009 by 9% and 2% respectively (he Banks Associa-tion of Turkey, 2015, see Figure 7). A continuous increase was observed in other years. he increase in house prices as well as lower down payment required to by borrowers
Figure 4. Sector shares in employment
0 0.05 0.1 0.15 0.2 0.25
2004 2005 2006 2007 2008 2009 2010 2011 2012 2013 2014
Sector shares in employment (%)
[image:7.581.290.528.513.602.2]will have inluenced the igures above. hese trends are, of course, driven by lending in the three largest cities.
he demand for mortgage credits will also have been shaped by interest rate levels (see Figure 8, Turkish Cen-tral Bank, 2015b). Mortgage interest rates decreased from 54% to 10% between 2002 to 2014. Within this 13 years period, there have been some luctuations with the lowest annual rates reduction of 8% occurring in June 2013.
he correlation between mortgage interest rates and credit expansion is strongly negative (–0.87) between 2002–2014 periods. Within the same period, the correla-tion between the number of people using mortgage credit and mortgage credit interest rates is –0.9; and the correla-tion between the amount of mortgage credit and mort-gage credit interest rates is –0.82. Real GDP and mortmort-gage credit expected to be associated.
he change in real GDP between 2002 and 2014 is shown in the graph below (Turkish Statistical Institute, 2015a, see Figure 9). he change in mortgage credit amount per person is relected in Figure 7. hese two graphs show the parallels between the expansion in
mort-gage credits per person, driving housing demand, and real GDP. he correlation coeicient between the two series is 0.97 with the only divergence occurring in 2003–2004.
here is a strong correlation between total mortgage credits, the number of mortgage credit users, the level of mortgage credits per person, mortgage interest rates and real GDP in Turkey between 2002 and 2014. Beyond the mortgage credit interest rates and real growth, the other factors that expected to afect the mortgage credits and housing sales are the change in house sales prices, the cred-it maturcred-ity period and household income. he importance of house prices and household income distribution, which vary spatially, are of course important sources or potential variation in market conditions within the country.
3.2. Statistical analysis of economic fundamentals and construction activity
3.2.1. Preliminary regression analysis
Four diferent regression equations were estimated in order to explore the relationship between construction growth and socio-economic indicators. Equation estima-tions were produced using the spatial analysis program, GeoDa. Single estimations show that there is a positive and linear relationship between construction growth and socio-economic change. However, the sizeable unex-plained part of the equation suggests that there are other important factors not included in the equation. he re-gression results are reported in Table 1.
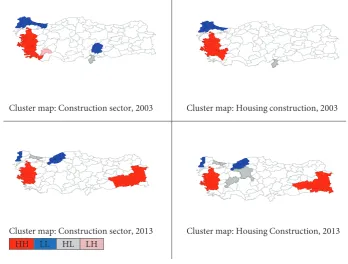
he Local Moran-I statistic was computed using the residuals from these regression estimations. he results of the four diferent Local Moran-I statistic are presented in Table 2. he Z scores and p values show that the computed index values are statistically signiicant. he Moran-I val-ues point to positive spatial autocorrelation and the null hypothesis of spatial randomness was rejected. hus, we can ascertain that there was statistically signiicant mod-erate clustering in Turkey which airms the notion that there is very uneven spatial growth in the construction sector. he provinces clustering distribution can be found in Table 3 and in Figure 10.
[image:8.581.49.296.66.171.2]he distribution of localities to clusters reveals some remarkable diferences between periods. From 2003 to 2013, new provinces have been added to the HH cluster. he geographical distribution of those clusters includes two distinct groups that appear in 2013. Interestingly, these clusters are quite dispersed geographically and the provinces difer in terms of their size and economic func-tions. he provinces included in the LL cluster are quite diferent in terms of geographic location by 2013. At this point, there are three interesting outliers in terms of hous-ing construction activity, each of which is surrounded by provinces where housing construction is relatively low. hese 3 outliers are important because they illustrate how polarized housing construction growth is across the coun-try (Figure 10).
Figure 7. Mortgage credit per person
0 20000 40000 60000 80000 100000 120000
[image:8.581.57.292.484.611.2]2002 2003 2004 2005 2006 2007 2008 2009 2010 2011 2012 2013 2014 Average mortgage credit per person (TL)
Figure 8. Mortgage interest rates
0 10 20 30 40 50 60 70
04-01-2002 31-05-2002 25-10-2002 21-03-2003 15-08-2003 09-01-2004 04-06-2004 29-10-2004 25-03-2005 19-08-2005 13-01-2006 09-06-2006 03-11-2006 30-03-200
7
24-08-2007 18-01-2008 13-06-2008 07-11-2008 03-04-2009 28-08-2009 22-01-2010 18-06-2010 12-11-2010 08-04-2011 02-09-2011 27-01-2012 22-06-2012 16-11-2012 12-04-2013 06-09-2013 31-01-2014 27-06-2014 21-11-2014 17-04-2015 Mortgage ınterest rate (%)
0 20 000 000 40 000 000 60 000 000 80 000 000 100 000 000 120 000 000 140 000 000
2002 2003 2004 2005 2006 2007 2008 2009 2010 2011 2012 2013 2014
[image:8.581.57.296.645.734.2]Real GDP (1998 base year, 1000 TL)
Table 1. Summary of output: ordinary least square estimations
Total construction permit (2003)
Housing construction permit (2003)
Total construction permit (2013)
Housing construction permit (2013)
Constant β Constant β Constant β Constant β
Coeicient 510.3877 600.028 439.9318 524.5776 1214.064 1497.561 1055.323 1345.642
Std. Error 56.8257 57.1816 51.6656 51.9891 118.4819 119.2178 108.0866 108.758
t-statistic 8.9816 10.4933 8.5149 10.0901 10.2468 12.5615 9.7636 12.3728
Prob(t-st.) 0.0000 0.0000 0.0000 0.0000 0.0000 0.0000 0.0000 0.0000
R-squared 0.58 0.56 0.66 0.65
Adj. R2 0.57 0.55 0.66 0.65
F-statistic 110.111 101.811 157.793 153.086
Prob(F-st) 0.0000 0.0000 0.0000 0.0000
Log likelihood –619.136 –611.425 –678.652 –671.214
Akaike Info Criterion 1242.27 1226.85 1361.3 1346.43
Schwarz Criterion 1247.06 1231.64 1366.09 1351.22
Table 2. Local Moran-I
z-value Std. d Mean I E[I] Pseudo-p
Total construction permit (2003) 5.0426 0.0694 –0.0098 0.3402 –0.0125 0.001
Housing construction permit (2003) 5.1166 0.0672 –0.0144 0.3296 –0.0125 0.001
Total construction permit (2013) 4.1146 0.0677 –0.0126 0.2662 –0.0125 0.001
Housing construction permit (2013) 4.1127 0.0657 –0.0129 0.2573 –0.0125 0.001
I: Moran statistic; E[I]: expected value of Moran I; Mean: the average of Moran-I for the simulated distribution.
Table 3. he provinces according to their clustering distribution
HH LL HL LH
Construction 2003 Balikesir
Manisa Izmir Aydin Mugla
Edirne Kirklareli Tekirdag Istanbul Kocaeli
Construction 2013 Balikesir
Manisa Izmir Aydin Agri Van Bitlis Siirt Sirnak Batman Mardin Diyarbakir
Edirne Bartin Karabuk Zonguldak Bolu Duzce
Istanbul
Housing construction 2003
Balikesir Manisa Izmir Aydin Denizli
Edirne Kirklareli Tekirdag Istanbul
Housing construction 2013
Balikesir Manisa Izmir Aydin Agri Van Bitlis Siirt Sirnak Batman Diyarbakir Hakkari
Edirne Bartin Karabuk Zonguldak Bolu Duzce
[image:9.581.43.526.399.763.2]3.3. Relections on the statistical results and other related evidence
When we compare both the relative performance (be-tween regions) and the change in performance over time on a number of key indicators, it is possible to draw some tentative conclusions about the utility of the typology. his section of the paper looks at NUTS and other second-ary data sources in an attempt to consider the extent to which the emergent patterns of development activity and the model results might resonate with the established styl-ized facts about what is happening in diferent provinces.
3.3.1. Relationships to GVA
he gross value added (GVA) data in NUTS2 level be-tween 2004 and 2011 provides useful headline informa-tion on the economic wellbeing of diferent parts of the country. he data, which unfortunately are not available ater 2011, shows that Istanbul is the most signiicant NUTS2 region in the country’s economy, and its contri-bution is 27% of GVA. Ankara (8%) and Izmir (6%) are the next most important. Eastern and Southern Marmara provinces (Kocaeli, Sakarya, Bursa, Eskisehir) stand out at the forefront of regional added value rankings (Turkish Statistical Institute, 2015c). he lowest regional value-add-ed provinces are Agri, Kars, Igdır and Ardahan. hese are followed at the bottom end of the distribution by Kasto-monu, Cankiri and Sinop regions and Erzurum, Erzincan and Bayburt regions (see Table 4).
Arguably the changes in the GVA shares of diferent region is a more important inluence on construction ac-tivity than the headline igures above. Table below ranks
Cluster map: Construction sector, 2003 Cluster map: Housing construction, 2003
Cluster map: Construction sector, 2013 HH LL HL LH
[image:10.581.124.473.67.331.2]Cluster map: Housing Construction, 2013
Table 4. Regions ranked by NUTS2 economic performance
1 Mardin, Batman, Şırnak, Siirt
2 Tekirdağ, Edirne, Kırklareli
3 Kocaeli, Sakarya, Düzce, Bolu, Yalova
4 Gaziantep, Adıyaman, Kilis
5 Manisa, Afyonkarahisar, Kütahya, Uşak
6 Hatay, Kahramanmaraş, Osmaniye
7 Trabzon, Ordu, Giresun, Rize, Artvin, Gümüşhane
8 Balıkesir, Çanakkale
9 Bursa, Eskişehir, Bilecik
10 Van, Muş, Bitlis, Hakkari
11 Ankara
12 Antalya, Isparta, Burdur
13 Malatya, Elazığ, Bingöl, Tunceli
14 Adana, Mersin
15 Şanlıurfa, Diyarbakır
16 Kırıkkale, Aksaray, Niğde, Nevşehir, Kırşehir
17 Istanbul
18 Kayseri, Sivas, Yozgat
19 Konya, Karaman
20 Samsun, Tokat, Çorum, Amasya
21 Izmir
22 Ağrı, Kars, Iğdır, Ardahan
23 Erzurum, Erzincan, Bayburt
24 Aydın, Denizli, Muğla
25 Zonguldak, Karabük, Bartın
[image:10.581.307.538.397.747.2]26 Kastamonu, Çankırı, Sinop
the provinces that have the highest increase in their added value between 2004 and 2011. Between those years, the added value increased the most in the Mardin, Siirt, Bat-man and Sırnak region, which make a remarkable move from 22nd to 1st in the rank order. he Moran-I statis-tics put Siirt, Batman and Sirnak in the HH quadrant in 2013. he second most striking change is in the Tekirdag, Edirne, Kirklareli region. In this case, Moran-I statistics put the region in the LL quadrant in both 2003 and 2013. his chimes with expectations about the socio-economic basis for development in these areas. he other region of note is Kastamonu, Cankiri and Sinop. In that region, both the level of added value in the region (25th in the rank order) and the increase in added value between 2004 and 2011 (26th) is lowest.
If we use Value added per capita rather than GVA, the rank order position also change for Istanbul, Eastern Mar-mara, Ankara, Southern Marmara and Western Marmara regions by 2011. he Van, Mus, Bitlis and Hakkari region (Turkish Statistical Institute, 2015c) has the lowest rank on that measure. Again, this resonates with what the re-gression and Morans analysis might lead us to expect. he only unanticipated result is the inclusion of Siirt, Batman and Sirnak regions in the HH quadrant in 2013, when lower levels of development might reasonably have been expected.
3.3.2. he relationship with mortgage inance
[image:11.581.42.274.569.745.2]As we note in section 3.1, the availability of inance can be important driver or signiicant constraint on sales and development activity.Turkish Statistical Institute data in 2011 shows the similarity between two ranks: the 10 prov-inces where the housing sales with mortgage credit are the highest and the NUTS2 regions where the highest value added is produced (Turkish Statistical Institute, 2015c; he Banks Association of Turkey, 2015). he Moran-I statistics show Istanbul and Ankara in the HL quadrant in 2013. heir appearance is likely to resonate with most analysts expectations, given that it implies a break between con-struction activity and underlying economic fundamentals.
Table 5. NUTS2 value added and mortgages sales
he highest value added NUTS2 regions – 2011
he highest mortgage sales – 2011
Istanbul Istanbul
Ankara Ankara
Izmir Izmir
Bursa, Eskisehir, Bilecik Antalya
Kocaeli, Sakaraya, Duzce, Bolu, Yalova
Bursa
Antalya, Isparta, Burdur Kocaeli
Adana, Mersin Mersin
Adana Kayseri Eskisehir
We encounter similar patterns when we examine to-tal housing sales and toto-tal mortgage credits and deposits across the provinces. In 2014, the provinces with the six highest mortgage sales levels are Istanbul, Ankara, Izmir, Antalya, Bursa and Kocaeli, respectively. In 2011, the provinces with highest mortgage credit use were Istanbul, Ankara, Izmir, Antalya, Bursa, Kocaeli (see Table 5). Total housing sales, total credits and mortgage credits are cor-related and all those values are the highest in provinces where the total value added is highest. he NUTS2 level value added or value added per person ranking is very con-sistent with total housing sales and total credits ranking.
hus, when taken together, the statistical analysis and our exploration of secondary data show that there is un-even relationship between economic fundamentals, policy intervention and development activity. here are, however, interesting anomalies in certain places (for instance, Afyon in HL quadrant) at some points in time that merit further investigation to help us understand the extent to which pol-icy might be distorting activity levels and leading to a break between construction activity and economic fundamentals.
Conclusions
In Turkey, as in many countries, there has been a strong narrative within government that has emphasized the im-portance of construction activity as a driver in economic growth. his has given shape to a central government policy narrative that has sought to ensure that planners and other urban policy makers develop plans and strate-gies that support real estate development activity. Against this backdrop, and a recent history of uneven spatial de-velopment, this paper seeks to begin to understand what this might mean for the drivers of construction activity broadly and housing construction in particular within diferent provinces. It seeks to develop an understanding of both the relationship between public policy, economic drivers and levels of development activity.
he evidence suggests that uneven spatial development might be explained in diferent ways in diferent parts of the country. In many parts of the country, there has been a reasonable degree of consistency between economic fun-damentals and constructions activity. But there are excep-tions in some regions at some points in time. here are some provinces where it seems likely that policy is creat-ing conditions where development levels are outstrippcreat-ing market requirement which, of course, might seek to desta-bilise the real estate market and wider economy (Renaud, 1997). In others, it may be the case that development levels are below what might be required to meet market requirements and to support the growth agenda. We argue that these initial indings require further investigation. We propose that the clusters derived in this paper should be used to frame that analysis.
sub-clusters located at the west side and east side of the country were both expected to relect the diferent charac-teristics of either their social and economic environments or their natural and cultural environments. Moreover, these 2 sub-clusters also difer in terms of their strategic importance in the country’s political landscape. Given the diferences in functional and political signiicance, these sub-clusters ofer useful case study contexts within which to explore the role of large-scale public investments, gov-ernment incentives, private sector investments backed by central planning and their impact on construction growth. Second, given that LL quadrant changed its geographi-cal composition, it ofers a chance to explore diferent is-sues. he fact that numerous localities now exhibit dif-ferent relationships between construction activity and economic fundamentals means that these study area ofer insight into the change relationship between construction growth and market and policy inluences. he new prov-inces included in the cluster are economically reliant coal mining and the iron-steel industry. herefore, the clus-ter provides an opportunity to relect how important the power of economic development and positive expectations of its sustainability on construction growth.
hird, the HL quadrant captures a number of polar-ized provinces in housing construction growth. he ma-jor factors stimulating the dense construction growth in these areas are not clearly related to economic drivers and, thus, the role and signiicance of central and local plan-ning policies and practices should be investigated. hese cases ofer novel sights into the role of planning in creat-ing economic capacity.
Finally, the most important consequence of uneven distribution is its potential of creating local bubbles. he provinces in the HL quadrant all exhibit local housing bubbles or, on the basis of the data, appear to be candi-dates for local bubbles in the near future. he risk of a bubble appears to increase where house prices have risen above the long term and national average levels. he inlu-ence of land values on construction costs is important at the point. Land supply is, of course, inluence signiicantly by planning policy. In the circumstances, planning policy is unlikely to be operating independently of market forces which further suggests that the role of market actors in shaping planning policies and planning decisions needs to be examined in particular provinces.
Overall, this paper develops an approach to examining the relationship between state intervention, economic fun-damentals and housing construction activity. he spatial and statistical analysis poses a set of further question that might usefully be explored using complementary qualita-tive analysis.
Acknowledgement
his paper based on the research project entitled ‘Con-struction, Economic Development, and Planning Policies: Investigating the Causal Links’ that funded by British Academy Newton Fund.
References
Adams, D., & Tiesdell, S. (2010). Planners as market actors:
re-thinking state–market relations in land and property.
Plan-ning heory & Practice,11(2), 187-207.
https://doi.org/10.1080/14649351003759631
Adams, D., & Watkins, C. (2014). he value of planning. London:
Royal Town Planning Institute.
Barras, R. (1984). he oice development cycle in London. Land
Development Studies,1, 35-50.
https://doi.org/10.1080/02640828408723866
Barras, R. (2009). Building cycles: growth and instability. Oxford:
Wiley-Blackwell. https://doi.org/10.1002/9781444310009
Begg, I. (Ed.). (2002). Urban competitiveness: policies for dynamic
cities. Bristol: he Policy Press.
Bon, R. (1992). he future of international construction. Habitat
International,16, 119-128.
https://doi.org/10.1016/0197-3975(92)90068-A
Bramley, G. (1998). Measuring planning: indicators of planning restraint and its impact on housebuilding and house price.
Environment and Planning A,25(7), 1021-1051.
https://doi.org/10.1068/a251021
Bramley, G. (2003). Planning regulation and housing supply in a
market system. Housing Economics and Public Policy. United Kingdom: Blackwell.
Bramley, G. (2013). Housing market models and planning. Town
Planning Review,84(1), 9-35.
https://doi.org/10.3828/tpr.2013.2
Bramley, G., & Watkins, C. (1995). Circular projections:
house-hold growth, housing development and the househouse-hold projec-tions. Council for the Protection of Rural England, London. Buckley, K. A. H. (1952). Urban building and real estate
luctua-tions in Canada. Canadian Journal of Economics and Political
Science,18(1), 41-62. https://doi.org/10.2307/138533
Celik, O. (2013). Changing forms and strategies of state
interven-tion in the housing of the poor in Istanbul. Unpublished PhD hesis, University of Sheield.
Coskun, Y. (2011). he global inancial crisis and the Turkish
housing market. Housing Finance International,25(3), 6-14.
Dawkins, C. J., & Nelson, A. C. (2002). Urban containment poli-cies and housing prices: an international comparison with
implications for future research. Land Use Policy,19, 1-12.
https://doi.org/10.1016/S0264-8377(01)00038-2
DiPasquale, D., & Wheaton, W. C. (1996). Urban economics and
real estate markets. Englewood Clifs, NJ: Prentice Hall. Eraydin, A., & Tasan-Kok, T. (2014). State response to
contem-porary urban movements in Turkey: a critical overview of state entrepreneurialism and authoritarian interventions.
Antipode,46(1), 110-129. https://doi.org/10.1111/anti.12042
Fainstein, S. S. (2001). he city builders: property development in
New York and London, 1980–2000. University Press of Kansas. Fisher, J. D. (1992). Integrating research on markets for space
and capital. Real Estate Economics,20, 161-180.
https://doi.org/10.1111/1540-6229.00578
Grenadier, S. R. (1995). he persistence of real estate cycles.
Jour-nal of Real Estate Finance and Economics,10, 95-119.
https://doi.org/10.1007/BF01096984
Henneberry, J., McGough, T., & Mouzakis, F. (2005a). Estimat-ing the impact of plannEstimat-ing on commercial property markets.
In D. Adams, C. Watkins, M. White (Eds.), Planning, Public
Policy and Property Markets (pp.105-126). Oxford: Blackwell.
Henneberry, J., McGough, T., & Mouzakis, F. (2005b). he
im-pact of planning on local business rents. Urban Studies,42,
471-502. https://doi.org/10.1080/00420980500035261
Henneberry, J., McGough, T., Rowley, S., & Smith, R. (2003). he
economic consequences of planning for business: planning and business rents. Final Report to ODPM, Department of Town and Regional Planning, University of Sheield, Sheield. Jackson, C. (2006). Retail planning policy change and
institu-tional investment. Regional Studies, 40, 555-561.
https://doi.org/10.1080/00343400600757734
Jackson, C., & Watkins, C. (2005). Planning policy and retail property markets: measuring the dimensions of planning
in-tervention. Urban Studies,42, 1453-1469.
https://doi.org/10.1080/00420980500150896
Jackson, C., & Watkins, C. (2011). Planning policy and retail
property investment. Urban Studies, 48(11), 2321-2338.
https://doi.org/10.1177/0042098010385157
Jackson, C., & Watkins, C. (2007). Supply-side policies and retail
property market performance. Environment and Planning A,
39(5), 1134-1146. https://doi.org/10.1068/a38250
Keogh, G. (1994). Use and investment markets in British real
estate. Journal of Property Valuation and Investment,12(4),
58-72. https://doi.org/10.1108/14635789410069980
Key, T., Zarkesh, F., MacGregor, B. D., & Nanthakumaran, N.
(1994). Understanding the property cycle: economic cycles and
property cycles. London: Royal Institution of Chartered Sur-veyors.
Nanthakumaran, N., Watkins, C., & Orr, A. (2000). Understand-ing property market dynamics: insights from modellUnderstand-ing the
supply-side adjustment mechanism. Environment and
Plan-ning A,32(4), 655-672. https://doi.org/10.1068/a31176
Renaud, B. (1997). he 1985 to 1994 global real estate cycle: an overview. Journal of Real Estate Literature,5(1), 13-44.
https://doi.org/10.1023/A:1008623304689
Ruddock, L., & Lopes, J. (2006). he construction sector and
economic development: the Bon curve. Construction
Manage-ment and Economics,24(7), 717-723.
https://doi.org/10.1080/01446190500435218
Strassmann, P. (1970). he construction sector in economic
de-velopment. Scottish Journal of Political Economy,17(3),
390-410. https://doi.org/10.1111/j.1467-9485.1970.tb00715.x
Sun, Y., Mitra, P., & Simone, A. (2013). he driving forces behind boom and boost in Europe. IMF Working Paper (WP/13/181), International Monetary Fund.
he Banks Association of Turkey. (2015). Consumer loans and
housing loans quarterly. Retrieved from https://www.tbb.org.
tr/en/banks-and-banking-sector-information/data-query-system/21
Tsolacos, S., McGough, T., & Keogh, G. (1998). Modelling use,
investment and development in the British oice market.
En-vironment and Planning A,30(8), 1409-1427.
https://doi.org/10.1068/a301409
Turin, D. A. (1969). he construction industry: its economic
sig-niicance and its role in development. London: University Col-lege, Environmental Research Group.
Turk, S. S., & Korthals Altes, W. K. (2010). Institutional capaci-ties in the land development for housing on greenield sites
in Istanbul. Habitat International,34(2), 183-195.
https://doi.org/10.1016/j.habitatint.2009.09.002
Turkish Central Bank. (2015a). Hedonic housing price indexes,
July 2015. Retrieved from https://evds2.tcmb.gov.tr/index. php?/evds/dashboard/310
Turkish Central Bank. (2015b). Electronic data center, July 2015.
Retrieved from https://evds2.tcmb.gov.tr/
Turkish Central Bank. (2015c). Monetary policy and inlation
de-velopments, July 2015. Retrieved from http://www.tcmb.gov. tr/wps/wcm/connect/TCMB+EN/TCMB+EN/Main+Menu/ STATISTICS/Chart+Gallery/
Turkish Statistical Institute. (2015a). Gross Domestic Product at
current prices by kind of economic activity, July 2015. Retrieved from http://www.turkstat.gov.tr/PreTablo.do?alt_id=1108
Turkish Statistical Institute. (2015b). Construction labor input
indices, July 2015. Retrieved from http://www.turkstat.gov.tr/ PreTablo.do?alt_id=1023
Turkish Statistical Institute. (2015c). Regional Gross Values Added
at current prices, July 2015. Retrieved from https://biruni.tuik. gov.tr/medas/?kn=116&locale=en
Turkun, A. (2011). Urban regeneration and hegemonic power
relationships. International Planning Studies,16(1), 61-72.
https://doi.org/10.1080/13563475.2011.552473
White, M., & Allmendinger, P. (2003). Land-use planning and housing market: a comparative review of the UK and the
USA. Urban Studies,40, 953-972.
https://doi.org/10.1080/0042098032000074263
Wong, C., & Watkins, C. (2009). Conceptualising spatial plan-ning outcomes: towards and integrative measurement
frame-work. Town Planning Review,80(4–5), 481-516.