This is a repository copy of The effect of unit, depth, and probe load on the reliability of
muscle shear wave elastography: Variables affecting reliability of SWE.
White Rose Research Online URL for this paper:
http://eprints.whiterose.ac.uk/120222/
Version: Accepted Version
Article:
Alfuraih, AM, O'Connor, P, Hensor, E et al. (3 more authors) (2018) The effect of unit,
depth, and probe load on the reliability of muscle shear wave elastography: Variables
affecting reliability of SWE. Journal of Clinical Ultrasound, 46 (2). pp. 108-115. ISSN
1097-0096
https://doi.org/10.1002/jcu.22534
© 2017 Wiley Periodicals, Inc.. This is the peer reviewed version of the following article:
Alfuraih AM, O'Connor P, Hensor E, et al.. The effect of unit, depth, and probe load on the
reliability of muscle shear wave elastography: Variables affecting reliability of SWE. J Clin
Ultrasound. 2018;46:108–115. , which has been published in final form at
https://doi.org/10.1002/jcu.22534. This article may be used for non-commercial purposes
in accordance with Wiley Terms and Conditions for Self-Archiving. Uploaded in
accordance with the publisher's self-archiving policy.
Reuse
Items deposited in White Rose Research Online are protected by copyright, with all rights reserved unless indicated otherwise. They may be downloaded and/or printed for private study, or other acts as permitted by national copyright laws. The publisher or other rights holders may allow further reproduction and re-use of the full text version. This is indicated by the licence information on the White Rose Research Online record for the item.
Takedown
If you consider content in White Rose Research Online to be in breach of UK law, please notify us by
The Effect of Unit, Depth and Probe
Load on the Reliability of Muscle Shear
Wave Elastography
Variables affecting reliability of SWE
Authors:
Abdulrahman M. Alfuraih
1,2,3BSc, MSc.
Phil O’Connor
3MBBS, MRCP, FRCR, FFSEM(UK).
Elizabeth Hensor
2,3BSc, PhD.
Ai Lyn Tan
2,3MB, BCh, MD, MRCP.
Paul Emery
2,3MA, MD, FRCP, FMedSci.
Richard J. Wakefield
2,3BM, MD, FRCP.
Affiliations:
1
Radiology and Medical Imaging Department, College of Applied Medical Sciences, Prince
Sattam bin Abdulaziz University, Kharj, Saudi Arabia.
2
Leeds Institute of Rheumatic and Musculoskeletal Medicine, Chapel Allerton Hospital,
University of Leeds, United Kingdom.
3
NIHR Leeds Biomedical Research Centre, Leeds Teaching Hospitals NHS Trust, Leeds,
United Kingdom.
Corresponding author.
Dr. R. J. Wakefield.
Leeds Institute of Rheumatic and Musculoskeletal Medicine,
2nd Floor, Chapel Allerton Hospital,
Chapeltown Road.
Leeds. LS7 4SA. UK.
+44 113 392 4849
Acknowledgments
The research is supported by the National Institute for Health Research (NIHR) Leeds
Biomedical Research Centre, UK. The views expressed are those of the author(s) and not
Abstract
Purpose: There is currently no standardized method for muscle shear wave elastography (SWE). The
objective of this study was to investigate the effect of unit of measurement, depth and probe load on
the reliability of muscle SWE.
Methods: The vastus lateralis, biceps femoris, biceps brachii and abductor digiti minimi muscles
were scanned on twenty healthy participants. The SWE readings were measured in shear wave
velocity (m/s) and Young’s modulus (kPa). Three acquisitions of varying depths were acquired from
vastus lateralis. Minimal probe load was compared with the use of a standoff gel layer. Three repeated
measurements were acquired to assess reliability using intraclass correlations (ICC).
Results: The mean elasticity varied across muscle groups and ranged from 1.54 m/s for biceps
femoris to 2.55 m/s for abductor digiti minimi [difference= 1.01 m/s (95% CI= 0.92, 1.10)]. Reporting
readings in m/s resulted in higher ICC of .83 (.65, 93) in comparison to .77 (.52, .90) for kPa for the
vastus lateralis muscle only. Variance increased proportionally with depth reaching 0.17 (equivalent
to ±0.82 m/s) at 6 cm. Using a standoff gel decreased ICC to .63 (.20, .84) despite similar mean
elasticity readings to minimal probe load.
Conclusions: Different acquisition and technical factors may significantly affect the reliability of
SWE in skeletal muscles. Readings acquired in the unit of shear wave velocity (m/s) from depths less
than 4 cm using a minimal probe load without a standoff gel yielded the best reliability.
Introduction
Shear wave elastography (SWE) of skeletal muscle has recently started to gain interest in the field of
musculoskeletal medicine. It provides a non-invasive quantitative measure of local tissue elasticity
with less operator dependency when compared to strain (compression) elastography 1. The feasibility
and value of SWE has previously been tested in breast 2, liver 3, thyroid 4 and prostate 4 imaging;
however, its role in the evaluation of muscle is less established and generally considered to be in the
technical validation phase.
Muscle disorders may alter the biomechanical properties of muscle and therefore SWE has the
potential to be a useful non-invasive and relatively inexpensive imaging biomarker for diagnosis and
disease monitoring. Skeletal muscle imaging however has to overcome various anatomical challenges
such as anisotropy, contraction and position related changes due to structure and tissue heterogeneity
due to myotendinous and aponeurotic structures. All of these features have been shown to influence
SWE readings in recent papers 5,6. In order to work towards the development of a standardized
procedure, we report on the effects of further factors such as the unit of measurement, depth and
probe load on the reliability of skeletal muscle.
SWE machines track the propagation of shear waves to estimate shear wave velocity (SWV) by
calculating the difference in the shear wave arrival time between two or more locations of known
distances. Several commercially available SWE systems offer the option to report readings in SWV
(m/s) and Young’s modulus (kPa). In our practice, we have observed that we frequently encounter
repeated consecutive acquisitions that have the same SWV but slightly different Young’s modulus.
Such occurrences suggest that the original SWV reading could potentially be more reliable than
Young’s modulus. The SWE systems also allow placing acquisition sample boxes at different depths
extending to approximately 75% of the corresponding maximum depth of B-mode. Several articles
standardized protocol or recommendation regarding measurement depth in muscle. SWE is less
operator-dependent than strain elastography; however, it is still dependent on the pressure applied by
the operator. Different degrees of probe load (precompression force) have been shown to result in
significantly different SWE readings on breast and thyroid tissues 11,12. Previous studies investigating
probe load and depth applied statistical inferences to test for difference without testing for reliability.
No previous studies have reported on the elasticity of the dominant versus non-dominant thigh
muscles. As muscular development and loading could cause a difference in muscle elasticity,
assessing this could help understand differences which need to be taken into account when conducting
research studies.
An understanding of factors which determine the reliability of SWE is imperative before examining
pathological cases in clinical practice. Our hypothesis for this study is that SWE reliability is
dependent on unit, depth and probe load. The objective of this study is to test the effect of using
different reporting units, acquisition depth and probe load on the reliability of SWE in healthy skeletal
muscle. A secondary objective is to determine if leg dominance has an impact on muscle elasticity.
Materials and methods
Participants
Twenty healthy participants (13 males: 7 females) from various ethnicities, volunteered for this
cross-sectional study. The mean SD age and BMI were 36 11.8 and 23 3.1 respectively. All
participants were drug-free and had no history of joint or muscle problems. None of the participants
was considered athletic or engaged in competitive exercise programs. Participants were instructed to
avoid any strenuous activities 24 hours before the test to minimize confounding factors. Written
informed consent was obtained from all participants. The study had been approved by a UK research
ethics committee and was conducted according to good clinical practice guidelines.
Shear wave elastography
SWE acquisitions were performed by a board-certified sonographer (AMA) with more than four years
LOGIQ-E9 system (GE Healthcare, Buckinghamshire, UK) employing a linear 9-5 MHz probe was
utilized for this study. Briefly, this system quantifies the velocity of shear wave propagation using the
comp-push excitation method and applying time-interleaved shear wave tracking to detect the SWV
13. This technology allows a free selection of large ROI with frame rates close to 1 frame/sec. A
circular ROI with an area of 75mm2, equivalent to 1cm in diameter, was chosen for all SWE
acquisitions with the exception of the small abductor digiti minimi muscle, for which a smaller ROI
was used to cover a 1cm 1.2cm shear wave elastography box. Due to the anisotropic nature of
skeletal muscles, all acquisitions were performed with the probe oriented longitudinally to muscle
fibers. This is determined when multiple fibers were continuously visible on the B-mode image. The
probe was placed approximately at the midportion between the proximal and distal myotendinous
junctions of each muscle. Measurements were obtained from the muscle belly away from any
myoaponeurotic or myotendinous structures. Three consecutive measurements were recorded for each
muscle and acquisition method 14.
Muscles and positioning
Four muscles were investigated in a resting state: vastus lateralis, biceps femoris, biceps brachii and
abductor digiti mini. The selection was based on choosing muscles from various depths, architectures
and sizes. All participants were asked to relax their muscles before the examination for five minutes.
For vastus lateralis, participants laid supine with knees fully extended and feet slightly everted. For
biceps brachii, participants remained in the same previous position and were then asked to bend their
elbow (90), relax their shoulder and rest the supinated forearm on their torso. Next, for abductor
digiti minimi, the dominant hand was pronated and rested on a cushion with the fifth finger being
maintained in a slight abduction by the operator’s hand. Lastly, for biceps femoris (long head),
participants laid prone, bent knees (90) and rested legs against a wall. These positions allowed the
investigation of the muscles in a resting state, ensuring no passive stretching or active contraction
Units
After each acquisition, mean reading of the ROI was displayed and recorded in shear wave velocity
(m/s) and Young’s modulus (kPa). The latter is measured from the SWV using the following equation
(1)
where E is Young’s modulus of elasticity, 3 is a constant related to Poisson’s ratio for strain, is
tissue density (assumed to be 1 g/cm3) and V
Sis the velocity of shear waves. The system’s software
calculates the sum of the value of each pixel in m/s squared and multiplies it by 3. Two decimal
places were reported by the machine and used in the analyses for each unit. Depth, probe load and leg
dominance analyses were performed using SWV.
Depth
For vastus lateralis only, three SWE acquisitions were recorded, each containing three ROIs
(superficial/moderate/deep) positioned serially along the axial beam axis (Figure 1). Depth from the
skin to the center of each ROI sample was recorded. The superficial and deep ROIs were placed away
from the muscle edges (epimysium) to avoid the potential effect on elasticity. All ROIs had the same
area of 75mm2. Readings were repeated three times to test for reliability.
Probe load
For vastus lateralis only, readings were acquired using two probe load techniques. Firstly, with the
probe in light direct contact with the skin using only a minimum layer of gel without causing
flattening or deformation of the superficial epimysium layer. Secondly, without contacting the skin
using copious amount of ‘standoff gel’ clearly visible on top of the images. Approximately 5 mm of
gel was utilized as a standoff layer, which was checked on the B-mode image prior to the acquisitions.
This selected thickness was considered feasible without a significant depth trade-off. These two
acquisition techniques were chosen as they are the easiest to reproduce in clinical situations in our
opinion. They are also the most reasonable to be tested in terms of applying the lightest pressure on
Leg dominance
Participants were asked about their leg dominance at the beginning of each exam. When unsure, they
were asked, “which leg would you kick a ball with?”15. The same acquisition methods and location
were applied when scanning the non-dominant side. This investigation was performed on the vastus
lateralis only.
Statistical analysis
Repeated measures ANOVA with post-hoc Bonferroni-corrected pairwise comparisons was used to
compare mean SWV between muscles; terms were included for muscle (4 levels) and repeated
measurement (3 levels). The same test was used to compare the vastus lateralis elasticity between
dominant and non-dominant leg as well as between using normal probe load and standoff gel. A
two-sided p-value of less than 0.05 was considered significant. Reliability was quantified using one-way
random (average measure) intra-class correlation coefficients (ICC) of the three repeated measures for
each muscle and acquisition method. The reliability coefficients are interpreted as follows: .00-.20
‘poor agreement’, .21-.40 ‘fair agreement’, .41-.60 ‘moderate agreement’, .61-.80 ‘substantial
agreement’ and >.80 ‘almost perfect agreement’ 16. Bland-Altman mean bias and 95% limits of
agreement were used to evaluate probe load with and without a standoff gel 17. Within participants
coefficient of variance (WSCV) was calculated as a measure of variability by calculating
within-subject standard deviation 18 then dividing it by the mean. To investigate whether depth of assessment
affected reliability, a multilevel linear regression model was constructed that included random terms
for participants (level 3), relative depth of assessment (superficial/moderate/deep; level 2) and
repeated measurement (level 1). Measured depth of assessment (cm) was included as an explanatory
variable. Log-likelihood values from models with and without an additional term that modeled the
variability of level 1 SWE measurements as a function of measured depth of assessment were
compared. SPSS version 24 (IBM Corp., Armonk, N.Y., USA) and MLWin 3.00 (Centre for
Results
Pairwise comparisons revealed that SWV differed between all muscles (p < .001) with the exception
of vastus lateralis and biceps brachii, where the mean SWVs were both 1.76 m/s (p = 1). The largest
difference was between the abductor digiti minimi and biceps femoris [mean difference (95% CI)
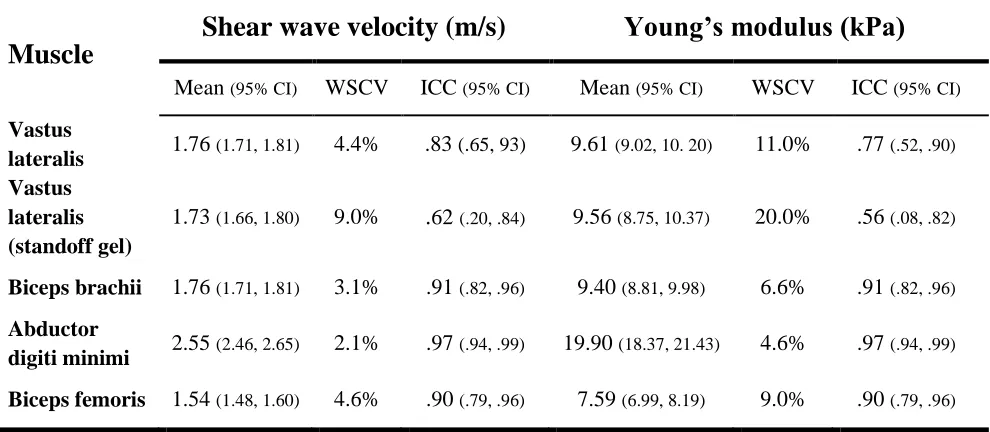
1.01 (0.92, 1.10)]. Table 1 lists the means for each muscle in addition to variability and reliability
results using the two reporting units. Using SWV (m/s), reliability coefficients were almost perfect
(ICC >.80) across all muscles. Although within-subject variability, demonstrated as WSCV, was
lowest for the abductor digiti minimi, Figure 2 shows relatively large between-subject variability
(wide 95% CI) amongst the readings. The difference in reliability between the units was only
noticeable for the vastus lateralis muscle with and without standoff gel. Otherwise, ICC coefficients
between the units were identical. Association between them for the four muscles is plotted in Figure
3.
As for depth, Figure 4 illustrates that mean SWV was not affected by depth [SWV per cm (standard
error)=0.013 (0.029); likelihood ratio test X2(1)=0.65, p=.421]. However, there was strong evidence
that at greater depths of assessment the repeated SWV measurements were more variable (likelihood
ratio test X2(1)=41.4, p<.001) (Figure 5). The equation for this association was estimated to be:
(2)
Approximately 95% of measurements are expected to lie between -2 and +2 SD around the mean;
estimated variance (SD2) of 0.07 at 4cm depth equated to an interval of ±0.53 m/s, whilst at 6cm
(variance=0.17) this increased to ±0.82 m/s.
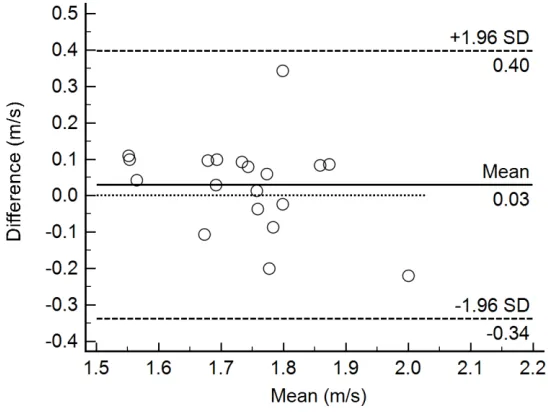
Mean SWV (m/s) was not significantly different when using a standoff gel in comparison to normal
probe load [mean difference (95% CI) 0.03 (-0.03, 0.09), p = .317]. Reliability decreased from almost
perfect agreement (ICC=.83) to the lower margin of substantial agreement (ICC=.62) for normal
probe load and standoff gel respectively. WSCV doubled when using a standoff gel, increasing from
average bias (Figure 6); the 95% limits of agreement were ±0.37 (95% CI 0.29, 0.45). No significant
mean SWV difference was found between the dominant and non-dominant vastus lateralis [-0.04
(-0.09, 0.01), p = .082]. ICC (95% CI) for the non-dominant vastus lateralis was .80 (.59, .91), which is
similar to ICC for the dominant side reported in Table 1.
Discussion
This study set out to evaluate factors which may be important in the standardization of muscle
assessment using SWE. To our knowledge, no previous studies have tested the same variables using
the same technical and statistical methodology. There is also limited knowledge on the performance
of newly introduced shear wave systems, such as the one we utilized (LOGIQ-E9). This is particularly
important since each system applies its own technology and variations regarding performance to other
systems might be expected. The majority of previous SWE studies were designed to test diagnostic
performance for various pathologies without specifically focusing on possible variations induced by
acquisition methods. Our study has confirmed that the type of unit of measurement, depth of
measurement and overlying pressure from the probe may all influence the final SWE reading.
The first part of the study evaluated whether SWE readings were influenced by the types of muscle.
Our results confirmed that there were differences. For example, there was a significant difference in
mean SWV between the quadriceps (vastus lateralis) and hamstring (biceps femoris) muscle. Dubios
et al. 6 reported stiffness readings of 4.5 kPa and 5.6 kPa for vastus lateralis and biceps femoris
respectively. Our mean elasticity readings for vastus lateralis and biceps femoris were almost twice as
high (9.61 kPa and 7.59 kPa respectively) and were in agreement with Lacourpaille et al. 20. The latter
study also found a significantly higher stiffness in the abductor digiti minimi (13.5 kPa) although
lower than our reported mean elasticity (19.9 kPa). As these studies by Dubois et. al 6 and
Lacourpaille et al. 20 utilized the same SWE system (SuperSonic Imagine, Aix-en-Provence, France),
m/s). It should therefore be appreciated that variations in agreement occur depending on machines and
technical and acquisition methods across studies.
The reliability of SWE, as presented by the ICC coefficients in Table 1, indicate that our
measurements with the LOGIQ E9 can acquire repeated measurements with similar reliability to what
others have reported on similar healthy skeletal muscles using the same muscles but different systems
5,20-22. To our knowledge, this is the first reported data with the LOGIQ E9 in muscles. We reported
the ICC for the average of several measures instead of single measures considering that the average of
at least three acquisitions is necessary to provide reliable readings in clinical practice 23. Reliability
appeared to be higher for the superficial muscles in comparison to the deeper muscles. Although the
abductor digiti minimi muscle resulted in the highest ICC and lowest WSCV, the 95% CI, as seen on
Figure 2, were wide indicating large mean SWV variability between the subjects. The reason for this
feature is unclear and could be related to anatomical factors like muscle size or technical acquisition
factors like muscle relaxation upon positioning.
Several elastography systems offer the option to report SWE readings in SWV (m/s) and Young’s
modulus (kPa). The original measurement recorded by the machine is SWV; it then mathematically
converts it to Young’s modulus for each pixel then reports the average of all pixels in kPa. This
conversion method produces two problems. Firstly, in consecutive acquisitions, the readings may
have the same mean SWV but different standard deviations due to heterogeneity in the ROI pixels. In
such instances, the acquisition with the higher standard deviation will have an artificially larger
Young’s modulus. This will induce a variability in kPa but not in m/s rendering it less reliable. This is
evidenced when looking at the ICC in Table 1 for vastus lateralis. The remarkably greater WSCV in
kPa is expected due to the larger range of the results. Moreover, kPa will overestimate elasticity in
heterogonous (high standard deviation) acquisitions due to the effect of squaring in equation 1. The
difference in reliability between the two units was only noticeable in the vastus lateralis muscle due to
the several occurrences of repeated measurements of similar SWV from heterogeneous acquisition
samples having different standard deviations. This discrepancy problem and variation in reliability
heterogeneous. Figure 3 illustrates that the two units are not synonymous as they did not fit the line in
all observations. The second problem is when kPa value is manually calculated from mean m/s; the
square root of the sum will be calculated instead of the sum of the square root of each pixel,
generating an error. There would be no error if the acquired shear wave map is completely
homogenous with all pixels presenting the same value in m/s. The error will become greater if the
shear wave map is heterogeneous. This conversion error is very common in the SWE literature when
researchers compare their results to others.
There are additional important inaccuracies associated with converting the velocity readings to
Young’s modulus. The variation in soft tissues densities is neglected, as Young’s modulus assumes
density is constant and equals 1 g/cm3. This is inaccurate, as the density differs and is higher for
muscles (1.06 g/cm3) than fat (0.90 g/cm3) for example 24,25. Young’s modulus assumes that tissues
are isotropic and homogeneous; both assumptions are not the case when investigating muscles. Only
one previous study by Youk et al. has compared SWE units 26. They tested the diagnostic performance
of the two units on 130 breast masses. Although the diagnostic performance indices were not
identical, there was no significant difference between mean m/s and kPa. Nevertheless, they reported
a significant difference in specificity and area under the curve when using the standard deviation of
the entire lesion as a diagnostic method. Our result is the first to compare the reliability between the
two units. We recommend using SWV as a surrogate for tissue elasticity instead of Young’s modulus.
This will help both with study result reliability and allow more accurate comparison between studies.
Investigating depth is of particular importance, as reliability may diminish at greater depths due to the
attenuation of the acoustic push pulses and tracking waves. In this study, mean SWV did not appear to
be influenced by depth, in disagreement with previous studies which reported conflicting results
between each other. Ewerson et al. found SWV decreasing marginally with depth (R2=.019) without
p-value significance, regardless this is unlikely to be significant considering the weak R28. In
different depths. Carpenter et al. 7 attempted to study the effect of depth by testing for a difference
between two random depths, named ‘superficial’ and ‘deep’. They reported a significant difference
with the consideration that the depth readings did not exceed 2.5 cm. Their approach provides limited
evidence on the effect of depth on the acquisitions integrity.
No previous studies have analyzed the effect of depth as a continuous variable on muscle SWE as we
did. We have shown that variability of the readings increases quadratically as illustrated in Figure 5
and equation 2. We would therefore not recommend acquiring readings deeper than 4 cm as the
variability increases substantially reaching variance=0.17 at 6 cm, equating to 95% of readings lying
within ±0.82 m/s. This is a wide interval given the mean reading was 1.76 m/s. To our knowledge,
there is no known cutoff point for acceptable variability in SWE. However, considering depth
feasibility, we consider the variance of 0.07 at 4 cm depth, equating to ±0.53 m/s, to be the limit of
acceptable variability. Likewise, recent guidelines on thyroid SWE recommend that acquisitions
should not exceed depths of 4-5 cm 27. The strength of the acoustic radiation force impulse (push
pulse) diminishes at higher depths (5.5cm) rendering the generated shear waves too weak to be
tracked accurately 28. Other probes with lower frequencies may result in different findings. The SWE
mode on the machine we utilized is only available on the linear 9-5 MHz probe. Further research on
higher BMI subject groups is necessary to validate our findings. Depth investigation results from
phantoms may not be generalized to muscles because of anisotropy that may influence waves
propagation in muscles 20.
Although SWE removes much of the operator dependency in comparison to strain elastography, probe
load is one of the remaining operator-dependent factors. Carpenter et al. 7 investigated the effect of
probe load on muscle tissues over five healthy participants testing normal probe contact versus slight
axial stress. The same investigation was performed previously by Kot et al. 29 and both found a
significant difference between the techniques but did not conduct any reliability analysis. The lone
testing of difference is less informative and does not provide a useful evidence on the most suitable
method to recommend. Others investigated the effect of hard probe compression, which we consider
high degree of stress influencing elasticity 11,30. We sought to investigate the reliability of probe load
for two reasonable, practical and easy to replicate techniques. Our results support placing the probe in
direct contact with the skin without any compressional force or standoff gel. The microbubbles in the
gel layer may have potentially decreased the quality of the push pulse resulting in larger variance and
lower reliability. Our finding for standoff gel may not be generalized to other organs such as breast
where lesions are superficial, as it could be useful and reliability may be higher. Despite no significant
differences between the mean SWV for the two methods, the 95% CI of the limits of agreement
indicates that reading variability ranges between 16.5% – 25.5%. It suggests that results may not be
accurately compared between studies utilizing different probe load acquisition techniques.
Leg dominance may relate to muscular development and potential variation. Reviewing the muscle
SWE literature, we found that most research studies perform SWE on a single side because of the
time limitations. To our knowledge, this study is the first to investigate the potential difference
between sides. Our results show that the similarity assumption between dominant and non-dominant
side is valid for the vastus lateralis muscle on our subjects. This finding may not be directly
generalizable to pathological cases because unilateral disease development is possible. Although
many skeletal muscle pathologies may affect the thigh muscles symmetrically, such as idiopathic
inflammatory myopathies 31. Nevertheless, this finding is helpful to researchers in verifying that
halving scanning time through scanning one side may be acceptable for healthy subjects.
We believe our study is original from several perspectives and discusses important considerations in
SWE research and clinical applications. However, it has several limitations. No inter-operator
reproducibility was performed due to the feasibility to reduce scanning time for participants.
Moreover, probe load, depth and dominance were only tested on vastus lateralis because of time
limitations also. Future research studies should examine our outcomes on pathological cases to
confirm the findings. Nevertheless, the information we provided will be helpful to future SWE studies
In conclusion, the units of m/s and kPa are not synonymous. Readings in kPa are affected by tissue
heterogeneity and are less reliable in comparison to m/s. SWV proportionally increase in variability as
depth increases despite no significant change in the mean value. Placing the probe in direct contact
with the skin using minimal pressure yields more reliable reading in comparison to utilizing a standoff
gel between the probe and skin surface. Attention to these factors should assist in acquiring reliable
References
1. Bamber J, Cosgrove D, Dietrich CF, et al. EFSUMB guidelines and
recommendations on the clinical use of ultrasound elastography. Part 1: Basic principles and technology. Ultraschall in der Medizin 2013;34:169.
2. Barr RG, Nakashima K, Amy D, et al. WFUMB guidelines and recommendations for clinical use of ultrasound elastography: Part 2: breast. Ultrasound Med Biol
2015;41:1148.
3. Ferraioli G, Filice C, Castera L, et al. WFUMB guidelines and recommendations for clinical use of ultrasound elastography: Part 3: liver. Ultrasound Med Biol
2015;41:1161.
4. Cosgrove D, Barr R, Bojunga J, et al. WFUMB Guidelines and Recommendations on the Clinical Use of Ultrasound Elastography: Part 4. Thyroid. Ultrasound Med Biol 2017;43:4.
5. Cortez CD, Hermitte L, Ramain A, et al. Ultrasound shear wave velocity in skeletal muscle: A reproducibility study. Diagn Interv Imag 2016;97:71.
6. Dubois G, Kheireddine W, Vergari C, et al. Reliable Protocol for Shear Wave Elastography of Lower Limb Muscles at Rest and During Passive Stretching. Ultrasound Med Biol 2015;41:2284.
7. Carpenter EL, Lau HA, Kolodny EH, et al. Skeletal Muscle in Healthy Subjects versus Those with GNE-Related Myopathy: Evaluation with Shear-Wave US--A Pilot Study. Radiology 2015;277:546.
8. Ewertsen C, Carlsen JF, Christiansen IR, et al. Evaluation of healthy muscle tissue by strain and shear wave elastography-Dependency on depth and ROI position in relation to underlying bone. Ultrasonics 2016.
9. Carlsen JF, Pedersen MR, Ewertsen C, et al. A comparative study of strain and shear-wave elastography in an elasticity phantom. AJR Am J Roentgenol 2015;204:W236.
10. Shin HJ, Kim MJ, Kim HY, et al. Comparison of shear wave velocities on ultrasound elastography between different machines, transducers, and acquisition depths: a phantom study. Eur Radiol 2016;26:3361.
11. Barr RG, Zhang Z. Effects of precompression on elasticity imaging of the breast: development of a clinically useful semiquantitative method of precompression assessment. Journal of ultrasound in medicine : J Ultrasound Med 2012;31:895. 12. Lam AC, Pang SW, Ahuja AT, et al. The influence of precompression on elasticity of
thyroid nodules estimated by ultrasound shear wave elastography. Eur Radiol 2016;26:2845.
13. Song P, Macdonald MC, Behler RH, et al. Shear wave elastography on the GE LOGIQ E9 with Comb-push Ultrasound Shear Elastography (CUSE) and time aligned sequential tracking (TAST). 2014. IEEE. p 1101.
14. Sporea I, Gradinaru-Tascau O, Bota S, et al. How many measurements are needed for liver stiffness assessment by 2D-Shear Wave Elastography (2D-SWE) and which value should be used: the mean or median? Med Ultrason 2013;15:268.
15. Velotta J, Weyer J, Ramirez A, et al. Relationship between leg dominance tests and type of task. ISBS-Conference Proceedings Archive 2011.
19. Charlton C, Rasbash, J., Browne, W.J., Healy, M. and Cameron, B. MLwiN Version 3.00. Centre for Multilevel Modelling, University of Bristol 2017.
20. Lacourpaille L, Hug F, Bouillard K, et al. Supersonic shear imaging provides a reliable measurement of resting muscle shear elastic modulus. Physiol Meas 2012;33:N19.
21. Miyamoto N, Hirata K, Kanehisa H, et al. Validity of measurement of shear modulus by ultrasound shear wave elastography in human pennate muscle. PLOS ONE 2015;10:e0124311.
22. Lapole T, Tindel J, Galy R, et al. Contracting biceps brachii elastic properties can be reliably characterized using supersonic shear imaging. Eur J Appl Physiol
2015;115:497.
23. Sporea I, Gradinaru-Tascau O, Bota S, et al. How many measurements are needed for liver stiffness assessment by 2D-Shear Wave Elastography (2D-SWE) and which value should be used: the mean or median? Med Ultrason 2013;15:268.
24. Méndez J, Keys A. Density and composition of mammalian muscle. Metabolism 1960;9:184.
25. Martin AD, Daniel MZ, Drinkwater DT, et al. Adipose tissue density, estimated adipose lipid fraction and whole body adiposity in male cadavers. International journal of obesity and related metabolic disorders 1994;18:79.
26. Youk JH, Son EJ, Park AY, et al. Shear-wave elastography for breast masses: local shear wave speed (m/sec) versus Young modulus (kPa). Ultrasonography
2013;33:34.
27. Cosgrove D, Barr R, Bojunga J, et al. WFUMB Guidelines and Recommendations on the Clinical Use of Ultrasound Elastography: Part 4. Thyroid. Ultrasound Med Biol 2017;43:4.
28. Goertz RS, Amann K, Heide R, et al. An abdominal and thyroid status with Acoustic Radiation Force Impulse Elastometry – A feasibility study: Acoustic Radiation Force Impulse Elastometry of human organs. European Journal of Radiology
2011;80:e226.
29. Kot BCW, Zhang ZJ, Lee AWC, et al. Elastic modulus of muscle and tendon with shear wave ultrasound elastography: variations with different technical settings. PLOS ONE 2012;7:e44348.
30. Greening J, Dilley A. Posture induced changes in peripheral nerve stiffness measured by ultrasound shear wave elastography. Muscle nerve 2016.
Table 1
Table 1 Mean, variability and reliability of the different muscles for the two SWE units.
WSCV= Within Subjects Coefficient of Variation. ICC=Intraclass Correlation Coefficient
Muscle
Shear wave velocity (m/s)
Young’s modulus (kPa)
Mean (95% CI) WSCV ICC (95% CI) Mean (95% CI) WSCV ICC (95% CI)
Vastus
lateralis 1.76 (1.71, 1.81) 4.4% .83 (.65, 93) 9.61 (9.02, 10. 20) 11.0% .77 (.52, .90) Vastus
lateralis (standoff gel)
1.73 (1.66, 1.80) 9.0%
.
62(.20, .84) 9.56 (8.75, 10.37) 20.0% .56 (.08, .82)Biceps brachii 1.76 (1.71, 1.81) 3.1% .91 (.82, .96) 9.40 (8.81, 9.98) 6.6% .91 (.82, .96)
Abductor
digiti minimi 2.55 (2.46, 2.65) 2.1% .97 (.94, .99) 19.90 (18.37, 21.43) 4.6% .97 (.94, .99)
Figures legends
Figure 2 Bar chart demonstrating the distribution of the acquired mean SWV for the different
muscles. The standoff gel acquisition method is also included showing larger between-participants
variability (wider 95% CI) in comparison to the normal acquisition despite the relatively similar mean
[image:22.595.75.523.211.579.2]SWV.
Figure 3 Association between means kPa and m/s units for the vastus lateralis (a), biceps brachii (b),
abductor digiti minimi (c) and biceps femoris (d). In each case, the plotted line represents the direct
transformation kPa=3(SWV)2. The degree of association decreased for vastus lateralis and biceps
Figure 4 Scatterplot showing no substantial influence of depth on mean SWV.
[image:23.595.87.293.464.620.2]Figure 6 Bland-Altman plot demonstrating the difference against the mean between the measurements
of the vastus lateralis with and without standoff gel. The central solid line is the mean SWV
difference between the two methods displaying small, negligible bias (0.03 m/s). The two lines
represent the upper and lower 95% limits of agreement at -0.34 m/s and 0.40 m/s. The width of the