Int. J. Electrochem. Sci., 10 (2015) 6002 - 6013
International Journal of
ELECTROCHEMICAL
SCIENCE
www.electrochemsci.org
Study on the Effect of the Coating Thickness on Corrosion
Behavior of AZ91D Magnesium Alloy in m-SBF
Jie Zhang1,2, Changsong Dai1,*, Zhaohui Wen3,*, Jie Wei1 1
School of Chemistry Engineering and Technology, Harbin Institute of Technology, Harbin 150001, China
2
Pharmacy College, Jiamusi University, Jiamusi 154007, China 3
Department of neuro intern, First Affiliated Hospital of Harbin Medical University, Harbin 150001, China
*
E-mail: [email protected], [email protected]
Received: 14 April 2015 / Accepted: 7 May 2015 / Published: 27 May 2015
The CaP/chitosan coating on AZ91D magnesium alloy substrate was prepared by electrophoretic deposition technique (EPD) and formation mechanism of the coating was also put forward. CaP /chitosan coating and micro-arc oxidation (MAO) film effectively protected the AZ91D magnesium alloy from corroding in m-SBF. The composite coating had a good protection effect on AZ91D magnesium alloy when the thickness of CaP/chitosan coating was 0.40~ 0.61 mm and the effect of coating thickness on degradation rate of AZ91D magnesium alloy based CaP/chitosan material in m-SBF was elaborated. By analyzing the mathematical description of Faraday impedance, the CDC code of Nyquist equivalent circuit of two capacitive reactance loops and one inductance loop was Ru (Cd (Rct (CSRS (RLL)))) that was more in tune with the physical meaning of the degradation behavior of the AZ91D magnesium alloy based CaP/chitosan material in m-SBF.
Keywords: magnesium alloy; CaP; chitosan; coating thickness; AC impedance; corrosion
1. INTRODUCTION
CaHPO4·2H2O) and hydroxyapatite (HA, Ca10(PO4)6(OH)2) film [5,6]. Thirdly, magnesium based biological ceramic composites were formed [7,8]. Starting from the structure of natural bone, hydroxyapatite and chitosan coating were deposited on the surface of AZ91D magnesium alloy in this study, which can not only solve its fast degradation rate problem, but also offer good bioactivity and biocompatibility. In addition, the effect of the coating thickness on corrosion behavior of magnesium alloy in the simulated body fluid (m-SBF) has seldom been studied. And sutdies on potentiodynamic polarization and electrochemical impedance spectroscopy (EIS) are usually used to evaluate the corrosion rate of metal and the protective effect of the film or corrosion products. EIS is also an ideal way to investigate the long-term corrosion behaviour. In this perspective, the analysis of the electrochemical impedance spctra for AZ91D magnesium alloy with different thickness’s coating at the different immerision time in m-SBF were obatined in this work.
2. MATERIALS AND METHODS
2.1 Preparation of CaP/chitosan coating on AZ91D magnesium alloy 2.1.1 Pretreatment of AZ91D magnesium alloy substrate
First, AZ91D magnesium alloy (Dongqi Magnesium Alloy Products Co., Ltd., China) as matrix material was cut into samples with the size of 1cm×1cm×0.5cm. The obtained specimens were polished with the water proof sandpaper (80 to 1000 grit) and were ultrasonically cleaned. Then, a post-treated AZ91D sample was treated with micro-arc oxidation (MAO) technology in the alkaline solution [9-12].
2.1.2 Electrophoretic Deposition (EPD)
Just as the previous work [9-12], nano-hydroxyapatite (nHA) used for EPD was obtained by chemical precipitation technology. Chitosan (abbreviation CS, Mw =200,000) was purchased from Sigma-Aldrich Trading Co, Ltd., China. 0.25 g CS and 1.0 g nHA particles were added into 200 ml of an aqueous solutions containing the acetic acid under agitation, respectively. Moreover, 1.5 g nHA particles was slowly added into 300 ml absolute ethanol. These two solutions was mixed, sonicated for 1-2 h and aged for 24-30 h. The EPD cell was composed of the titanium alloy coated iridium tantalum as the anode and the MAO-AZ91D as the cathode. The space between two electrodes was about 10-15 mm. The EPD process was performed at a voltage of 40 V for 10, 20, 30, 40, 50 min at room temperature. At last, the MAO-AZ91D with the CaP/chitosan coating from EPD was soaked in phosphate buffer solution (PBS) at 37 °C for 5 d.
2.1.3 Immersion into the m-SBF
concentration equal to that of human blood plasm [13,14]. The ratio of the sample surface area (cm2) to the m-SBF volume (ml) was about 1:250. The samples were soaked in the m-SBF for different time intervals, respectively. At each time point, the m-SBF with the immersed sample was used to different test.
2.2 Specimens characterization
Electrochemical impedance spectroscopy (EIS) tests was performed in m-SBF by employing a Model CHI750D potentiostat (Chenhua Co., Ltd, Shanghai, China). Before the test, the specimens were immersed in the m-SBF at 37° C for 15 min to obtain a stable free corrosion potential. Spectra of electrochemical impedance were recorded under open circuit potential with the scan frequency ranging from 100 kHz to 10 mHz and a perturbation amplitude of 5 mV. The obtained Nyquist plots of the MAO-AZ91D alloy with the different thickness coating were fitted by the software Zsip Win 3.0. The scan rate of Tafel curve test was 5 mV/s, polarization time was 2 s. The element concentrations in m-SBF at different time intervals were measured with an inductively coupled plasma optical emission spectrometer (ICP-OES, 5300DV, Perkin Elmer, America), respectively. The coating thickness was tested by 8801 coating thickness meter (Jielai science and technology co., LTD, Hong Kong, China)
3. RESULTS AND DISCUSSION
3.1 The formation mechanism of CaP/chitosan coating
The thickness of CaP/chitosan coating prepared under different electrophoresis times on MAO-AZ91D substrate are shown in Table 1.
Table 1. The thicknesses of CaP/chitosan coatings prepared under different electrophoresis times
EPD time / min 10 20 30 40 50
The averagethickness / mm 0.31 0.40 0.61 0.87 1.05
The weight or thickness of the deposits obtained by EPD can be expressed by the following formula [15,16]:
d Ut C
W / (1)
Among them, C and µ indicate the particle concentration and mobility rate, respectively. U = Uap - Udep, Uap is an applied voltage, Udep is a voltage drop in the deposition process, t is deposition time, d is a distance between two electrodes. The mobility rate of voltage can be described by the Smoluchowski equation:
/4 (2)
and voltage, that is the thickness of the depositing coating on AZ91D magnesium alloy also will increase.
In order to obtain the higher , during the preparation process of electrophoresis solution, nHA particles was first positively charged in anhydrous ethanol, and chitosan (CHIT-NH2 ) was protonated and positively charged in the acetic acid aqueous solution. In addition, in order to obtain the stable suspension, after nHA-ethanol aqueous solution mixed with nHA-chitosan acetic acid aqueous solution, the charging process of nHA particles needed a certain aging time[17]. If the suspension was not aged, nHA particles charged little or almost zero. Thus, no matter how long the EPD time was, it was difficult to get HA ceramic coating. The specific reaction formula are as follows:
H HA-H
HA n
n (3) O H NH -CHIT O H NH
-CHIT 2 3 3 2 (4)
EPD included two processes: the charged particles under the electric field force moved to the cathode and were reduced at the cathode surface. After H+ was reduced to H2 on the surface of cathode, the OH- concentration at the cathode area increased. Under the electric field force, as the positively charged HA-H+ and CHIT-NH3+ moved to the cathode, they neutralized with OH-, accompanying with the cathodic reduction, and then deposited on the surface of cathode. The specific reaction formula are as follows:
2 H 2e
2H (5)
-2O 2H 2OH
2H (6) HA
e H
-HA - n
n (7) O H HA OH H -HA 2 - n
n (8)
2
-3 e CHIT-NH
NH
-CHIT (9) O H NH -CHIT OH NH
-CHIT 2 2
-3
(10)
At the same time, nHA particles in the acetic acid aqueous solution would dissolve, so Ca2+ and PO43- existed in the system, likewise, Ca2+ under the electric field force moved to the cathode and combined to Ca(OH)2 with OH-. PO43- and HPO42- that was a part of PO43- hydrolyzate generated into HA and DCPD with Ca2+ near the cathode through the electrostatic effect. The specific reaction formula are as follows:
O 2H PO 6 Ca 10 H 2 (OH) ) (PO Ca 2 -3 4 2 2 6 4
10
(11) 2 -2 Ca(OH) OH 2
Ca (12) O H 2 CaHPO H 2 2OH HPO
Ca2 24- - 4 2 (13)
HA and is close to Ca(OH)2 at 37 °C, as a result, DCPD will dissolve in PBS. So, a part of DCPD and the dissolving Ca2+ from Ca(OH)2 would deposit in the form of nHA [18,19].
3.2 Effect of the coating thickness on the corrosion rate of magnesium alloy 3.2.1 Immersion experiment of magnesium alloy with different thickness coatings
10 12 14 16 18 20 22 24 26 28 30
80 100 120 140 160 180
M
g
e
le
m
e
n
t
c
o
n
c
e
n
tr
a
ti
o
n
/m
g
L
-1
Immersion time/days 0.31 mm
0.40 mm 0.61 mm 0.87 mm 1.05 mm
(a)
6 8 10 12 14 16 18 20 22 24 26 28 30
7.50 7.55 7.60 7.65 7.70 7.75 7.80 7.85 7.90
pH
Immersion time /days 0.31 mm
0.40 mm 0.61 mm 0.87 mm 1.05 mm
(b)
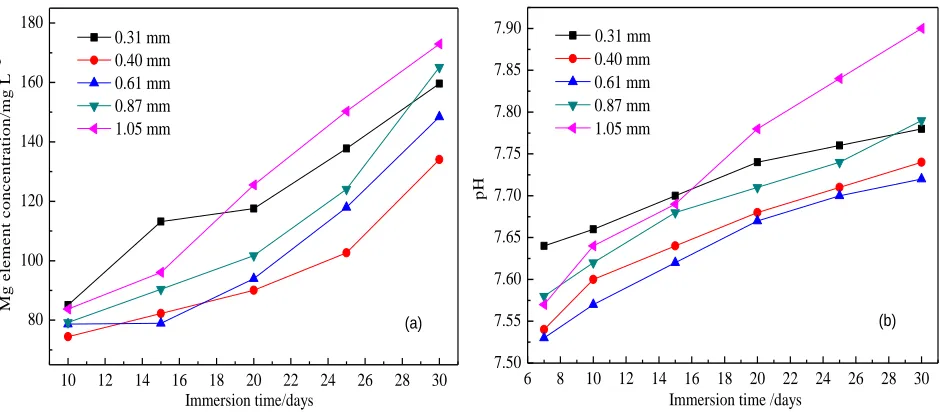
Figure 1. Mg concentrations (a) and pH values (b) of MAO-AZ91D with the different thickness coatings soaked in the m-SBF for different intervals
[image:5.596.65.535.205.411.2]
Figure 1(b) is the change trend of pH values for MAO-AZ91D with the different thickness coatings soaked in m-SBF for different times, which is in accordance with the strend in Figure 1(a). For the samples with different thickness coatings, the pH values increased during the immersion period, indicating that the coating can't fully prevent magnesium alloy from corroding in m-SBF. When the coating’s thickness was from 0.31 mm to 0.61 mm, pH values decreased because the increase of the film thickness decreased the corrosion rate of magnesium alloy in m-SBF. The pH values increased when the coating thickness increased from 0.61 mm to 1.05 mm, which was because the binding force between the coating and metal substrate became poor. Similarly, when the immersion time was greater than 20 d, pH value for the coating of 1.05 mm thickness significantly increased, this was because the coating on the substrate occurred to pull off. When the soaking time was 30 d, the pH value for the coating of 0.87 mm thickness increased, the film also occurred the falling phenomenon at this time.
In a word, CaP/chitosan coating on AZ91D magnesium alloy was obtained by EPD, the coating thickness increased with the increase of electrophoresis time, and the coating thickness affected the degradation speed of AZ91D based CaP/chitosan in m-SBF. When the film thickness was 0.40 ~ 0.61 mm (electrophoretic time of 20~30 min), it could effectively protect the corrosion of AZ91D magnesium alloy in m-SBF.
3.2.2 Tafel plot test of magnesium alloy with different thickness coatings
-2.1 -2.0 -1.9 -1.8 -1.7 -1.6 -1.5 -1.4
-9 -8 -7 -6 -5 -4
Potential /V(vs.SCE)
0.31 mm 0.40 mm 0.61 mm 0.87 mm 1.05 mm
L
o
g
(
i/
A
)
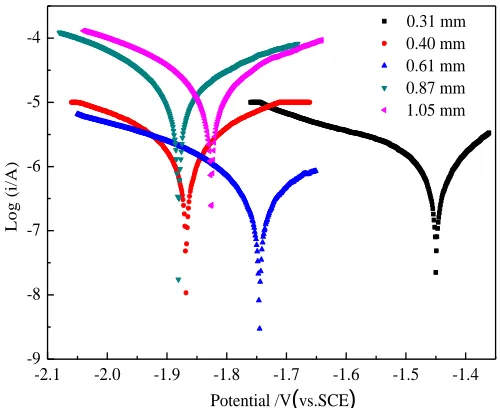
Figure 2. Tafel plots of MAO-AZ91D with the different thickness coatings immersed in the m-SBF for 15 days
According to Faraday formula, the density of the corrosion current (icorr) can be converted into
the corrosion rate[20]:
10 )
mm/yr
( corr
nF Mti
[image:6.596.172.422.415.619.2]
Where, CR indicates the rate of corrosion, M is the molar mass of specimen (Mg equals to 24.31 g/mol), t is 3600×24×365/s, n is the electron number in the corrosion reaction, F is Faraday constant (96485 As/mol), ρ is specimen density (AZ91D density is 1.82 g/cm3
).
[image:7.596.94.508.595.744.2]Tafel curves for MAO-AZ91D with the different thickness coatings soaked in m-SBF for 15 d are shown in Figure 2, the corresponding analysis results are shown in Table 2. It can be seen from Figure 2 and Table 2 that the corrosion current icorr value decreased and the corrosion rate CR also reduced accordingly when the film thickness increased from 0.31 mm to 0.61 mm. When the coating thickness increased from 0.61 mm to 1.05 mm, the corrosion current icorr value and the corrosion rate CR increased, respectively.
Table 2. Results of Tafel plots of MAO-AZ91D with the different thickness films immersed in the m-SBF for 15 days
Thickness / mm 0.31 0.40 0.61 0.87 1.05
Ecorr/V(vs·SCE) icorr /A cm-2 CR / mm yr-1
-1.450 1.64×10⁻⁵
0.358
-1.868 2.38×10⁻⁶
0.052
-1.745 5.49×10⁻⁷
0.012
-1.881 1.65×10⁻⁵
0.360
-1.826 1.99×10⁻⁵
0.434
This suggested that the protection effect of the coating on magnesium alloy substrate enhanced with the increase of the coating thickness from 0.31 mm to 0.61 mm, which caused the corrosion speed of AZ91D magnesium alloy in m-SBF to decrease. When the coating thickness increased to 0.87 mm, the contact area and the internal stress between the metal substrate and m-SBF increased, and the binding force between the coating and metal substrate became poor, which caused the protection of the coating on magnesium alloy to decrease. As a result, the corrosion current icorr and the corrosion rate CR showed a increase trend when the coating thickness increased from 0.61 mm to 1.05 mm.
3.2.3 EIS test and mathematical simulation of Faraday impedance
0 500 1000 1500 2000 2500 0
500 1000 1500 2000 2500 (a)
ZRe/ Ω cm2
ZIm
/
Ω
c
m
2
0 300 600 900 1200 1500 1800 0
300 600 900 1200 1500
(b)
ZIm
/
Ω
c
m
2
0 500 1000 1500 2000 2500 3000 0
500 1000 1500 2000 2500 3000
(c)
ZIm
/
Ω
c
m
2
ZRe/ Ω cm2
0 500 1000 1500 2000 2500 3000 0
500 1000 1500 2000 2500 3000
(d)
ZIm
/
Ω
c
m
2
ZRe/ Ω cm2
0 500 1000 1500 2000 2500 0
500 1000 1500 2000 2500
(e)
ZIm
/
Ω
c
m
2
[image:8.596.91.503.70.402.2]ZRe/ Ω cm2
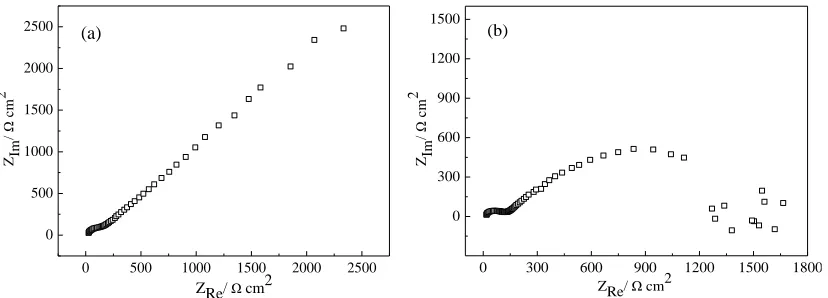
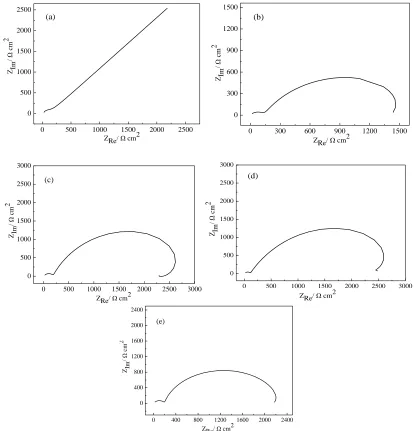
Figure 3. Nyquist plots of MAO-AZ91D with the different thickness films immersed in the m-SBF for 15 days (a) 0.31 mm; (b) 0.40 mm; (c) 0.61 mm; (d) 0.87 mm; (e) 1.05 mm
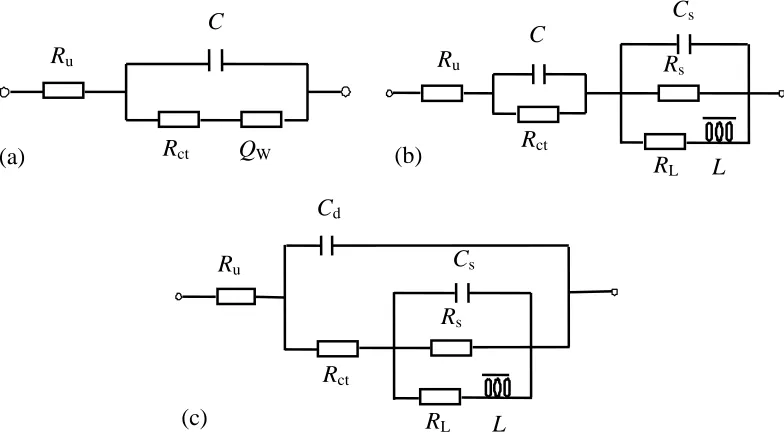
Figure 4. The equivalent circuits of Nyquist plots for MAO-AZ91D with the different thickness films immersed in the m-SBF for 15 days (a) 0.31 mm; (b) (c) 0.40~1.05 mm
Ru
Rct Cd
Cs
RL Rs
L (c)
C d
Rct Ru
QW (a)
Ru
Rct C d
Cs
RL Rs
[image:8.596.103.495.465.681.2]
Figure 3 is Nyquist plots of MAO-AZ91D with different thickness coatings soaked in the m-SBF for 15 d. After MAO-AZ91D based CaP/chitosan was soaked in the m-m-SBF for 15 d, it was seen from Figure 3 (a) that Nyquist for sample with the coating of 0.31 mm thickness was made up of a capacitive reactance loop and a straight line. A capacitive reactance loop at high frequency region indicated a charge transfer process, and a line at middle-low frequency represented that Warburg impedance of MAO-AZ91D based CaP/chitosan was caused by a semi-infinite diffusion process[21]. After sample contacted with the m-SBF for a period, the corrosion products, MAO film and the ceramic coating on the metal matrix were locally damaged in the condition of the coating thickness was thin, which would lead to the lack of protective layer on metal substrate. The corrosion behavior of sample was controlled by the mixing process of semi-infinite diffusion and electrochemistry. In this case, Nyquist equivalent circuit is shown in Figure 4 (a).
When the coating thickness was 0.40 ~ 1.05 mm (Figure 3(b)(c)(d)(e)), Nyquist plot was made up of two capacitive reactance loops and a inductive reactance loop. A capacitive reactance loop at high frequency region corresponded to the charge transfer resistance (Rct) and double-electric layer capacitance (C1) at interface. The capacitive reactance loop at middle frequency area indicated resistance and capacitance of electrolyte through the corrosion product, MAO film and ceramic coating on the surface of magnesium alloy. The inductive impedance loop at low frequency area attributed to the adsorption and falling of the corrosion products on the interface between the solution and MAO-AZ91D with the coating[22]. Nyquist plot for two capacitive reactance loops and a inductive impedance loop corresponded to the two kinds of equivalent circuits, as shown in Figure 4(b)(c). The physical meanings of two equivalent circuits were very different, which physical meaning of equivalent circuit was more in line with the degradation behavior of AZ91D magnesium alloy based calcium phosphate/chitosan material in m-SBF? Therefore, it is necessary to describe a Faraday impedance by mathematical method.
In general, for a simple electrochemical reaction, the equivalent circuit of Faraday impedance only includes the charge transfer resistance and diffusion impedance, namely Faraday impedance only depends on the electrode potential and the concentration of reactant or product particles. In the process of electrode reaction, if the disappearing and growing process of the corrosion products exist at the electrode surface, they will impact the Faraday impedance and must be considered accordingly.
So, for the AZ91D magnesium alloy based CaP/chitosan system, according to the references [23,24], Faraday current if that represents the electrode reaction speed is a function of electrode potential E, the concentration of reactive particles that influences the speed of electrode reaction on the electrode surface Cjs and the state variable on the electrode surface X when other conditions are unchanged, namely
S
f , , j 1, ,
i f E X C j m (15)
Among, X is a state variable of electrode surface that affects the velocity of electrode reaction and varies with the electrode potential, such as the thickness of the oxide film on the surface of electrode, or the coverage degree of adsorption particles on the electrode surface. CSj is the surface
Through the formula derivation[25,26], if two kinds of surface state influenced Faraday admittance, the expression of Faraday admittance will be
0 1 2
f
ct 1 2
1 B B
Y
R a j a j
(16)
Under B1<0 and a1Rct B1 0, the corresponding Nyquist plot of electrode reaction for B1<0 includes two capacitive reactance loops and one inductive reactance loop, as shown in Figure 3 (b)(c)(d)(e). According to the equation (16), Zf is related with resistance of charge transfer, a1, a2, B1 and B2, therefore, the equivalent circuit in Figure 4(c) should be choosed. The X1(a1,B1) is relevant with the coating thickness, X2(a2,B2) associates with the coating’s coverage degree.
Therefore, Figure 3(a) is fitted with the equivalent circuit of Figure 4(a) (CDC code is Ru(Cd(RctQW))), and Figure 3(b)(c)(d)(e) is fitted with the equivalent circuit of Figure 4(c) (CDC code is Ru(Cd(Rct(CSRS(RLL))))), the fitting results are shown in Figure 5 and Table 3, respectively.
0 500 1000 1500 2000 2500 0 500 1000 1500 2000 2500 ZIm / Ω c m 2
ZRe/ Ω cm2
(a)
0 300 600 900 1200 1500 0 300 600 900 1200 1500 (b) ZIm / Ω c m 2
ZRe/ Ω cm2
0 500 1000 1500 2000 2500 3000 0 500 1000 1500 2000 2500 3000 ZIm / Ω c m 2
ZRe/ Ω cm2
(c)
0 500 1000 1500 2000 2500 3000
0 500 1000 1500 2000 2500 3000 ZIm / Ω c m 2
ZRe/ Ω cm2
(d)
0 400 800 1200 1600 2000 2400
0 400 800 1200 1600 2000 2400 ZIm / Ω c m 2
ZRe/ Ω cm2
[image:10.596.89.503.295.726.2](e)
As can be seen from Figure 5 and Table 3, Rct gradually increased when the coating thickness increased from 0.31 mm to 0.61 mm, which indicated that the electrochemical corrosion reaction more difficultly occurred and the protection effect of the coating on metal substrate enhanced. Moreover, the coating was not damaged in m-SBF when the coating thickness was from 0.40 mm and 0.61 mm, the corrosion behavior of the specimen was controlled by electrochemical process and diffusion process of the finite layer. At this time, Rs increased with the increase of the coating thickness and the protection effect of the coating on metal substrate greatly enhanced. However, the excess-thickness coating made its binding force reduce instead, which could cause the protection of the coating on metal substrate to be weak and the speed of electrochemical corrosion reaction to accelerate. So, Rct and Rs decreased when the coating thickness was 0.87 mm. The coating appeared to falling phenomenon and losed the protection function when the coating thickness was 1.05 mm, Rs reduced and Rct increased, the corrosion products on the surface of the magnesium alloy had a certain protective effect on metal substrate at this time.
Table 3. Fitting results of Nyquists for MAO-AZ91D with the different thickness films immersed in m-SBF for 15 days
Thickness/mm 0.31 0.40 0.61 0.87 1.05
Rct /Ω cm2 Rs / Ω cm2
χ2
130 5.95×10⁻⁴
137.1 1803 8.91×10⁻³
173.9 4176 2.26×10⁻³
96.01 2301 6.40×10⁻³
190 2172 6.15×10⁻³
4. CONCLUSIONS
The formation mechanism of CaP/chitosan coating on AZ91D magnesium alloy substrate was: nHA and chitosan can be got by the electrophoretic deposition, Ca(OH)2 and DCPD were obtained by the chemical deposition. The degradation speed of AZ91D magnesium alloy in m-SBF were controlled by the coating thickness, the CaP/chitosan coating of 0.40~0.61 mm thickness had a good protection effect on magnesium alloy. The equivalent circuit of Nyquist of two capacitive reactance loops and one inductance loop was proved to Ru(Cd(Rct(CSRS(RLL)))) by analyzing the mathematical description of Faraday impedance.
ACKNOWLEDGEMENT
This work was supported by the science and technology research project of education department of Heilongjiang province (No. 12541796)
References
3. Z. J. Li, X. N. Gu, S. Q. Lou, Y. Zheng, Biomaterials, 29 (2008)1329-1344 4. S. X. Zhang, X. N. Zhang, C. L. Zhao, Acta Biomaterialia, 6(2010)626-640
5. J. E. Gray-Munro, M. Strong, Journal of Biomedical Materials Research Part A, 90A(2009)339-350
6. L. L. Tan, Q. Wang, F. Geng, X. S. Xi, J. H. Qiu, H. Yang, Transactions of Nonferrous Metals Society of China, 20(2010) s648- s654
7. J. Wei, J. Jia, F. Wu, S. Wei, H. Zhou, H. Zhang, J. W. Shin, C. Liu, Biomaterials, 31(2010)1260-1269
8. A. L. Feng, Y. Han, Materials and Design, 32(2011)2813-2820
9. C. J. Wu, Z. H. Wen, C. S. Dai, Y. X. Lu, F. X. Yang, Surface and Coatings Technology, 204 (2010) 3336-3347
10.J. Zhang, C. S. Dai, J. Wei, Z. H. Wen, S J Zhang, C Chen, Colloids and Surfaces B:Biointerfaces, 111(2013)179-187
11.J. Zhang, C. S. Dai, J. Wei, Z. H. Wen, Applied Surface Science, 261(2012)276-286 12.J. Zhang, C. S. Dai, J. Wei, Z. H. Wen, S. J. Zhang, L. M. Lin, Applied Surface Science,
280(2013)256-262
13.T. Kokubo, H. Takadama, Biomaterials, 27(2006)2907-2915
14.A. Oyane, H. M. Kim, T. Furuya, T. Kokubo, T. Miyazaki, T. Nakamura, Journal of Biomedical Materials Research Part A, 65A (2003)188-195
15.X. Pang, I. Zhitomirsky, Materials Characterization, 58(2007) 339-348
16.C. E. Cui, Q. Miao, J. D. Pan, Journal of electronic technology, 26(2005)294-297 17.J. M. Zhang, C. C. Yang, Q. Z. Shi, China Ceramics, 36(2000)36-40
18.L. M. Grovera, J. C. Knowlesb, G. J. P. Fleminga, J. E. Barralet, Biomaterials, 24(2003)4133- 4141
19.T. M. Gregory, E. C. Moreno, W. E. Brown, Journal of Research of the National Bureau Standards, 74A(1970)461-475
20.ASTM-G31-72: Standard Practice for Laboratory Immersion Corrosion Testing of Metals. Annual Book of ASTMS tandards.
21. J. W. Chang, X. W. Guo, S. M. He, P. H. Fu, L. M. Peng, W. J. Ding, Corrosion Science, 50(2008)166-177
22. M. Anik, G. Celikten, Corrosion Science, 49(2007) 1878-1894 23.J. Q. Zhang, Chemical industry press (2010)
24.M. Jamesh, S. Kumar, T. S. N. Sankara Narayanan, Corrosion Science, 53 (2011) 645-654 25.G. L. Song, A. L. Bowles, D. H. StJohn, Materials Science and Engineering A, 366(2004)74-86 26.G. L. Song, Z. Q. Xu, Corrosion Science, 63(2012)100-112