Int. J. Electrochem. Sci., 9 (2014) 3118 - 3129
International Journal of
ELECTROCHEMICAL
SCIENCE
www.electrochemsci.orgA comparison of Aluminum Leaching Processes in Tap and
Drinking Water
Fathia S. Mohammad1, Isam A. H. Al Zubaidy1 and Ghada Bassioni2,* 1
Chemical Engineering Department, American University of Sharjah, UAE; 2
Chemistry Department, Faculty of Engineering, Ain Shams University, P. O. Box 11517, Cairo, Egypt.
*
E-mail: ghada_bassioni@eng.asu.edu.eg.
Received: 14 January 2014 / Accepted: 27 February 2014 / Published: 23 March 2014
The intake of aluminum from cooking utensil is of growing concern to the health of the community. In the present work, leaching of aluminum from aluminum utensils using different types of water in food preparation was investigated. The effects of pH, salt concentration, temperature, and cooking time using tap and drinking water with Indian, Egyptian, Qatari, and Chinese utensils which are available in the local market were used in this work. The aluminum intake per person in (mg/person) was measured using drinking and tap water without adding any other ingredients. The aluminum intake was found to be in the following sequence. For drinking water: Qatari (0) < Chinese (20.16) < Egyptian (21.39) < Indian (100.75). For tap water: Chinese (285.12) < Indian 301.93 < Egyptian (403.8) < Qatari (407.2). Changing the chemical composition of the used waters, the following results are found: For 40% meat extracts with tomato juice, citric and salt in drinking water: Chinese (0-40.25) < Qatari (20.16-100.63) < Egyptian (100.63 -120.77) < Indian 181.17. For 40% meat extracts with tomato juice, citric and salt in tap water: Chinese (0-60.38) <Qatari (20.16- 40.25) <Indian (42.65-148.8) <Egyptian (42.63- 127.62). The results show a significant impact of the type of water used in the leaching process of aluminum cookware.
Keywords: aluminum cookware, water, leaching process, aluminum intake
1. INTRODUCTION
unfortunately, due to many reasons, most of us are exposed to and ingest more than what our bodies can handle [3]. Various reports suggest that high aluminum intake may be harmful to some patients with bone diseases or renal impairments. The aluminum health effects are far too vast to even being summarized [4]. Aluminum reduces the growth rate of human brain cells. Growth rate decrease becomes more pronounced at higher aluminum concentrations [5]. The cause of Alzheimer disease is still unknown, but aluminum might play a major role for the cause of the disease. It is possible to control aluminum intake from six main sources; food, packaging, medicine, pots, water and air [6].
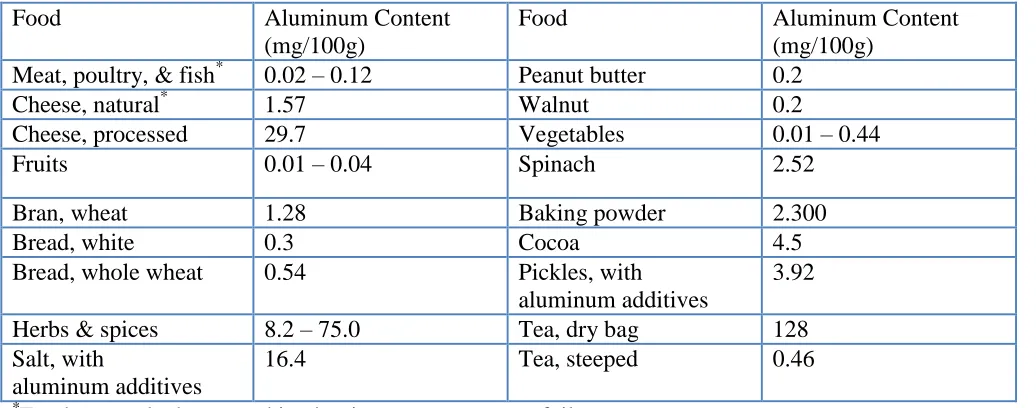
[image:2.596.44.562.499.703.2]Most foods contain some aluminum; for example, tea, some herbs and some spices contain particularly high aluminum levels. Aluminum often binds strongly with other substances in food such as fluoride and phosphate, which may make it less absorbable. Studies have found that beverages (tea, coffee and soft drinks) and cereals (cakes, puddings, biscuits, breakfast cereals, bread, flour, oatmeal and rice) are the main sources of aluminum from food. Aluminum can be naturally present in food, but some aluminum salts are mixed as food additives. Aluminum-based additives are widely used in bleaching, preserving and pickling processes and in powdered foods such as instant coffee, dried milk and table salt. Bread, cake, biscuits and baking powders may have high aluminum levels if they contain aluminum food additives. Food may come into contact with aluminum from packaging, foil trays, foil lined cartons and aluminum cans. In order to reduce the amount of unwanted aluminum intake from cookware, cooking acidic foods in uncoated aluminum pans must be avoided. Many anti-acids used for treating indigestion and ulcers contain large amounts of aluminum compounds, but little of the aluminum is normally absorbed. Anti-acids make the stomach more alkaline which prevent the absorption of most of the aluminum. Aluminum absorption is higher if anti-acids are taken with orange juice instead of water. Table (1) shows the estimated aluminum concentration of selected food [7].
Table 1. Estimated aluminum concentration in some selected food.
Food Aluminum Content
(mg/100g)
Food Aluminum Content
(mg/100g) Meat, poultry, & fish* 0.02 – 0.12 Peanut butter 0.2
Cheese, natural* 1.57 Walnut 0.2
Cheese, processed 29.7 Vegetables 0.01 – 0.44
Fruits 0.01 – 0.04 Spinach 2.52
Bran, wheat 1.28 Baking powder 2.300
Bread, white 0.3 Cocoa 4.5
Bread, whole wheat 0.54 Pickles, with
aluminum additives
3.92
Herbs & spices 8.2 – 75.0 Tea, dry bag 128
Salt, with
aluminum additives
16.4 Tea, steeped 0.46
*
Food not cooked or stored in aluminum pans, trays or foil.
often sulphate, in water treatment as coagulants of the organic matter, to reduce color, turbidity and microorganisms, increase the aluminum level which is known to be difficult to control in small facilities [8]. Drinking water regulations showed that the permitted concentration of aluminum is 0.2 mg / lb. A total of 171 samples were analyzed for aluminum content. The aluminum concentrations of the mineral and spring waters were far below the permissible limit for drinking water of 0.2 mg / lb. [9] and [10].
Extracts of six vegetables such as tomato, onion, potato, green been, carrots and zucchini were studied. It was found that Al leaching from Al cookware into vegetable extract solutions depends upon the type of Al used, kind of vegetable extracts, water quality, table salt (NaCl), temperature, and immersion time [11] and [12]. Boiling the cookware in water prior to cooking is suitable for the decrease of aluminum leaching into food by a factor up to sixty (with a corresponding decrease of the aluminum intake by consumers) [13] and [14].
Our study aims to correlate the type of water to aluminum leaching process from aluminum cookware of different origin during food preparation and compare the impact of the water source on human daily Al intake.
2. MATERIALS AND METHODS 2.1. Materials
Four kinds of aluminum cookware of different origin are chosen from the local market. The cookware origins are India, Egypt, Qatar, and China. The cookware are cut into small rectangular shapes with dimensions of 1x1.2 cm and each has a small hole of 1 mm diameter at one end in order to hang them in the water sample .
2.2. Methods
2.2.1. Weight loss method
In the present work, the weight loss method (WL) at room and different temperatures is used to study the aluminum leaching into different food solution samples. The aluminum specimens are cleaned by distilled water and acetone, dried, and weighed using a four-digit sensitive Citizen balance with sensitivity of 0.1 mg. After the test, aluminum samples are cleaned by distilled water followed by acetone and reweighed again. The pH values of the solutions are also measured before and after the experiment. The corrosion rate and aluminum intake per person have been calculated and demonstrated previously [7]. To assure consistency, all experiments are performed in duplicates.
2.2.2. Environmental scanning electron microscopy (ESEM)
ray (EDX). This measurement indicates the leaching of the metals compared to its initial condition.
3. RESULTS AND DISCUSSION
0 50 100 150 200 250 300 350
water
solution # 1
solution # 2
solution # 3
Alumi
num
int
a
ke
mg
/per
son
Drinking water
Tap water
Figure 1. Aluminum intake in mg/person for Indian cookware sample using tap and drinking water in different food solutions.
Three food solutions are used as described below in which the aluminum samples are immersed.
Solution # 1: 250 ml of 40% meat extract+ 250 ml tomato juice
Solution # 2: 250 ml of 40% meat extract+ 250 ml tomato juice+ 3 g citric acid
Solution # 3: 250 ml of 40% meat extract+ 250 ml tomato juice+ 3 g citric acid + 5 g salt Figure (1) shows the aluminum intake per person in drinking water and tap water for Indian cookware samples after two hours of immersing the aluminum sample at boiling temperature..
0 50 100 150 200 250 300 350 400 450
water
solution # 1
solution # 2
solution # 3
Alumi
num
int
a
ke
mg
/per
son
Drinking water
Tap water
[image:4.596.100.503.164.332.2] [image:4.596.106.497.538.716.2]
It can be seen that the aluminum intake using drinking water alone shows a value of 100.75 (mg/person) while using tap water alone is 301.93 (mg/person). The addition of meat extract increases the corrosion rate with solution # 1 using drinking water to 140.62 (mg/person) and shows a decrease using tap water to 42.65 (mg/person). The addition of table salt and citric acid causes a sharp increase in the aluminum intake. It is 181.17 (mg/ person) using drinking water and 148.8 (mg/person) using tap water.
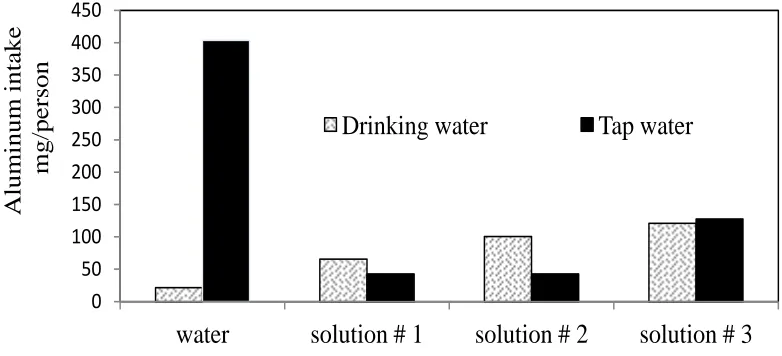
Figure (2) shows the aluminum intake per person in drinking water and tap water for Egyptian cookware samples after two hours of immersing the aluminum sample at boiling temperature
It can be clearly seen that the aluminum intake using drinking water alone shows a value of 21.39 (mg/person) while using tap water alone is 403.8 (mg/person). The addition of meat extract increases the aluminum intake with solution # 1 using drinking water to 65.5 mg/person and shows a decrease using tap water to 42.65 (mg/person). The addition of table salt and citric acid causes a sharp increase in the aluminum intake to 120.77 (mg/ person) using drinking water and 127.62 (mg/person) using tap water.
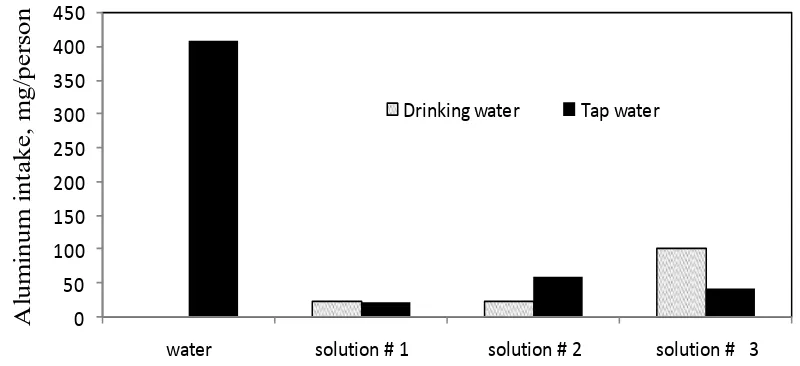
The aluminum intake per person in drinking water and tap water for Qatari and Chinese cookware samples are shown in Figure (3) and Figure (4) after two hours of immersing the aluminum sample at boiling temperature.
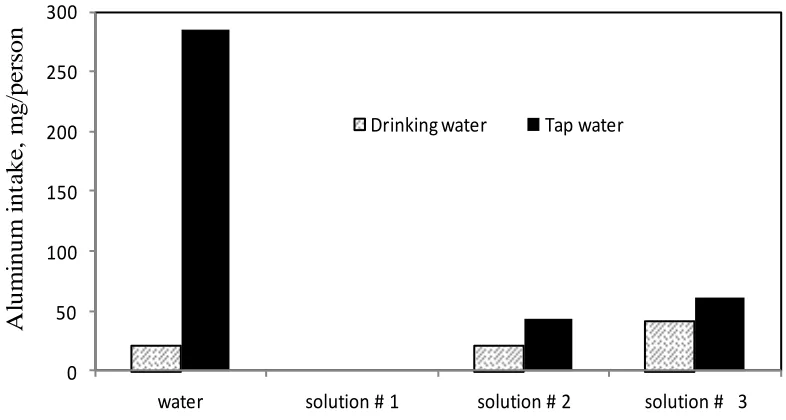
From Figure (3) it can be seen that the aluminum intake using drinking water alone shows no change in the mass of the sample. This means zero intake with drinking water while using tap water alone is 407.20 (mg/person). The addition of meat extract increases the aluminum intake with solution # 1 using drinking water to 20.16 mg/person and shows the same value with tap water. The addition of table salt and citric acid causes a sharp increase in the aluminum intake to 100.63 (mg/ person) using drinking water and 40.25 (mg/person) using tap water. From Figure (4) it can be seen that the aluminum intake using drinking water alone shows a value of 20.16 (mg/person) while using tap water alone is 285.12 (mg/person). The addition of meat extract increases the aluminum intake with solution # 1 using tap. Drinking water had no leaching observed.
0 50 100 150 200 250 300 350 400 450
water solution # 1 solution # 2 solution # 3
A
lum
inu
m
i
nt
a
ke, m
g/
per
son
Drinking water Tap water
[image:5.596.101.501.522.705.2]
0 50 100 150 200 250 300
water solution # 1 solution # 2 solution # 3
A
lum
inu
m
i
nt
a
ke, m
g/
per
son
Drinking water Tap water
Figure 4. Aluminum intake in mg/person for Chinese cookware sample using tap and drinking water in different food solutions.
The addition of table salt and citric acid causes a sharp increase in the aluminum intake to 40.25 (mg/ person) using drinking water and 60.38 (mg/person) using tap water.
The leaching of aluminum in drinking and tap water can be summarized as follow: For drinking water: Qatari (0) < Chinese (20.16) < Egyptian (21.39) < Indian (100.75) For tap water: Chinese (285.12) < Indian 301.93 < Egyptian (403.8) < Qatari (407.2)
The above results show that the leaching of aluminum using drinking water alone is less than the one in tap water.
The leaching is increased in the food solution prepared by drinking water while it is reduced in food solution prepared by tap water. The leaching can be summarized as follow:
For drinking water:
Chinese (0-40.25) < Qatari (20.16-100.63) < Egyptian (100.63 -120.77) < Indian 181.17 For tab water:
Chinese (0-60.38) <Qatari (20.16- 40.25) <Indian (42.65-148.8) <Egyptian (42.63- 127.62) Generally the decrease in tap water solution is either because of the formation of passive layer or the change in the mode of reaction from uniform to the localized one. The presence of significant amounts of fluoride, nitrate, chloride, phosphate, bromide, sodium and sulfate in tap water prior any filtration processes showed to have an impact on the leaching process of Al cookware. Tap water in the Gulf region was found to have elevated sodium and chloride levels generally compared to the
standards [15].
The drinking water solution shows an increase in the leaching value as the salt and citric acid concentrations increase (Solutions (1), (2), & (3)). The pH values of the solutions are 3.3, 3.0 and 2.8, respectively. This variation in the pH value seems to be the reason for such behavior with an increase of citric acid concentration.
[image:6.596.102.495.78.288.2]
(A) (B)
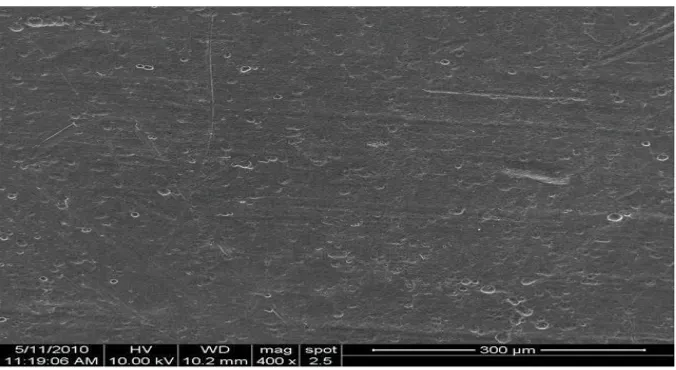
Figures 5. ESEM image of the Indian sample after two hours of exposure to boiling drinking water.
Figure 6. ESEM image of Indian sample after two hours of exposure in solution #1 using tap water.
[image:7.596.84.515.71.265.2] [image:7.596.130.468.306.491.2]
Figure 8. ESM image of Qatari sample after two hours exposure in solution #3 using tap water.
The severe localized attack is clear on the surface of the sample. In such situation, the aluminum intake is low but the cookware will be damaged soon.
Figure (6) showed the normal general leaching process which explains the lower aluminum intake value of drinking water compared to tap water.
The damage on the Egyptian sample that is exposed to solution (3) using drinking water at boiling point for two hours is shown in Figures (7). It clearly shows a normal general leaching process with little localized attack.
The damage on the Qatari sample that is exposed to solution (3) using tap water at boiling point for two hours is shown in Figures (8). It clearly shows small localized attacks.
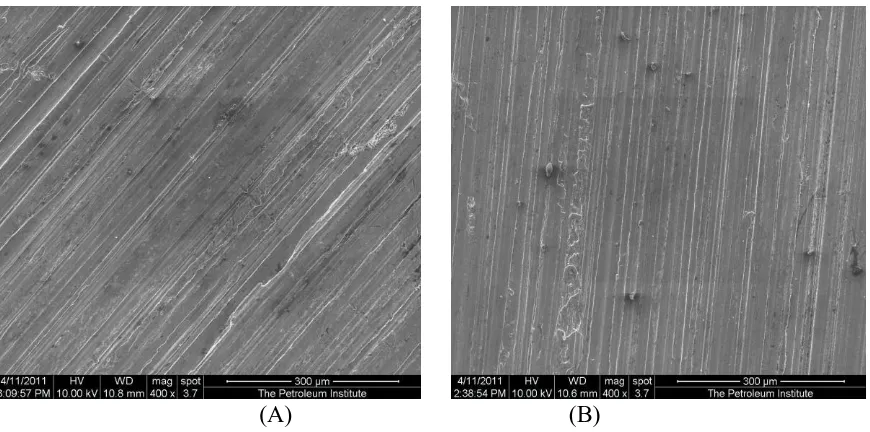
The damage on the Chinese sample that is exposed to solution (3) in drinking and tap water at boiling point for two hours is shown in Figures (9) ( A and B). Here the presence of drinking water reveal more localized attacks compared to tap water. This explains the small difference in the leaching shown as in Figure (4).
[image:8.596.157.440.70.211.2]
(A) (B)
[image:8.596.83.518.509.725.2]0 20 40 60 80 100 120
20 40 60 80 100
A lu m in u m In ta k e , (m g /p e rs o n )
Temperature (oC)
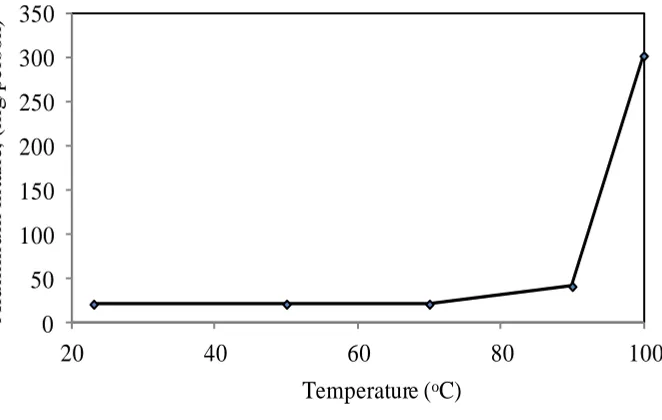
Figure 10. Effect of temperature on the Aluminum intake of Indian cookware sample at two hours of exposure in drinking water.
The effect of temperature on the Indian aluminum cookware sample is studied using drinking water after two hours of exposure. The aluminum intake increases with temperature as shown in Figure (10).
The aluminum leaching is five times higher at 100ºC than at ambient temperature. At 185ºC (oven) the leaching is even more and the aluminum intake is more than eight times than that at 100ºC. As the temperature increases, the kinetic energy is higher and the movement of molecules becomes faster. Therefore, aluminum contaminates food more frequently.
The effect of temperature on the Indian aluminum sample using tap water after two hours of exposure is shown in Figure (11).
0 50 100 150 200 250 300 350
20 40 60 80 100
A lu m in u m i n ta k e, (m g /p e rs o n )
Temperature (oC)
[image:9.596.127.462.74.282.2] [image:9.596.132.463.526.736.2]
The aluminum intake at temperatures below 100ºC are less than that in drinking water, while at 100ºC the aluminum intake is three times more than that in drinking water. The above behavior dives an idea regarding preparation of food. Leaching is there from the beginning of the process. It is at most level at boiling temperature which is the longest part of the process. This also shows that leaching is continued even after the cooking process. Finally, if the food is kept for some time before use, through the whole range of the cooling process leaching takes place. Heating the food again in the same pot prior eating, will give rise to more leaching.
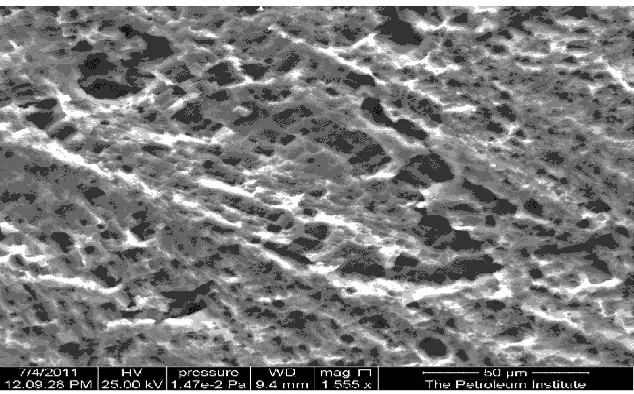
The pH values of the food solution have also a significant effect on aluminum leaching; at pH values of 2, 2.4 and 3.1 the localized attack is clearly noticed (Figures (12)). While at pH value of 6.7, there is very low uniform leaching (Figure (13)).
Figures 12. ESEM images of the Egyptian sample after 14 days of exposure to 3.5% NaCl solution in drinking water (pH= 2) at room temperature.
[image:10.596.140.457.265.462.2]
Figures 14. ESEM images of the Egyptian sample after 14 days of exposure to 3.5% NaCl solution in drinking water (pH= 10) at room temperature .
Increasing the pH to 10 shows very severe local attack (Figure (14)); i.e. pitting is filling the whole surface of the sample. The values of weight loss and pH measurements were repeated several times and the percentage error is so small and can be neglected. Previous work [8] reports that aluminum usually develops a protective surface of oxide film upon exposure to the atmospheric or aqueous solution.
This film is responsible for the corrosion resistance of aluminum in most environments when aluminum is exposed to high concentration of acids or bases. This solution causes pitting corrosion to the aluminum in the presence of chloride ions.
4. CONCLUSION
The aluminum intake using four different samples of cookware, Egyptian, Indian, Qatari, and Chinese origin is studied. It is shown that the type of water has a significant effect on the aluminum intake. The Qatari sample shows lower aluminum intake using drinking water alone and higher value using tap water alone. The addition of food solution and especially citric acid and table salt increase the aluminum intake. The cooking time and temperature has also a significant effect on aluminum leaching from the cookware to the food solution. As the cooking temperature increases, the aluminum intake increases accordingly.
ACKNOWLEDGEMENT
The authors thank the American University of Sharjah, UAE and The Petroleum Institute in Abu Dhabi, UAE for financial support.
References
1. R. G. Pina, and C. Cervantes, Bio Metals, 9 (1996) 311-316.
2. WHO (World Health Organization), “Safety evaluation of certain food additives and
Additives (2001).
3. J. Damond, “A report on Alzheimer’s disease and current research”, Alzheimer Society of Canada (2005).
4. H. Gitelman, “Aluminum and health critical review”, Marcel Dekker, Inc. New York, N.Y (1989). 5. M. S. Kim, Sci. Total Environ., 278 (2001) 127-135.
6. Aluminum and Alzheimer’s disease, Information Sheet, Alzheimer Scotland Action on Dementia, Oct. 4, (2003).
7. P. O. Snyder, “The effect of aluminum and iron cooking utensils on food”, Hospitality Institute of Technology and Management, retrieved on Aug. 8, (2011) from: http://www.hi-tm.com.
8. World Health Organization, Background document for development of WHO guidelines for drinking water quality, 2nd Addendum to Vol. 2. “Health Criteria and Other Supporting Information”, Geneva, (1998).
9. T. Stahl, H. Taschan, H. Brunn, Environ. Sci. Eu., 23 (2011) 37.
10.M. A. Dzulfakar, M. S. Shaharuddin, A. A. Muhaimin, A. I. Syazwan, Water, 3 (2011) 882-893. 11.L. A. Al Juhaiman, Int. J. Electrochem. Sci., 7 (2012) 7283 – 7294.
12.F. S. Mohammed, E. A. H. Al Zubaidy, G. Yacoub, G. Bassioni, Int. J. Electrochem. Sci., 7 (2012) 363-375.
13.R Karbouj, I. Desloges, P. Nortier, Food Chem. Tox. 47 (2009) 571–577.
14.F. S. Mohammed, E. Al Zubaidy and G. Bassioni, Int. J. Electrochem. Sci., 6 (2011) 222-230. 15.E. Raveendran, and I. M. Madany, Sci. Total Environ. 103 (1991) 177-183.