By GENET DABA
A Dissertation Submitted to the National Centre for Development Studies in Partial Fulfillment of the Requirement for the Degree
of Master of Demography at the Australian National University, Canberra
Except where otherwise indicated this thesis is my own work.
ACKNOWLEDGEMENT
I wish to thank Dr D. Lucas my supervisor for all his guidance and support during the writing of this thesis. I am also grateful to Ms. Chris McMurray who proof read my thesis and who was always ready to help during my entire study.
I would like to thank Dr. Link Day my advisor for his advice, Ms. Carol Mehkek and all the staff of the National Centre for Development Studies for their assistance.
I wish to express my gratitude to my office Central Statistical Office for giving me this study leave and allowing me to use the 1981/82 Rural Labour Force Survey data. I also wish to thank the U.N.F.P.A. for providing the fund for my study.
ABSTRACT
This study is based on males and females aged 10+ in the 1981/82 Rural Labour Force Survey. It analyzes the results of the usual and current status approach which were used in the survey. The usual status approach showed higher participation rates than the current status approach for all age groups.
Unemployment and underemployment in rural Ethiopia are also examined and it is found that underemployment as measured by hours worked is more prominent than open unemployment. One reason for low open unemployment is suspected to be the conventional definition of unemployment which in most cases does not represent the rural situation and secondly open unemployment appears to be truly rare in rural Ethiopia.
The levels and patterns of male and female labour force participation are discussed. Males at all ages have higher participation rates than females. The gross years of active life of males is high compared to that of females. Male participation is low in the entry ages, rises to its maximum in the prime ages and again decrease in the retirement ages. Female labour force participation exhibits the central peak pattern.
TABLE OF CONTENTS
Declaration ii
ACKNOWLEDGEMENT ill
Abstract iv
1. INTRODUCTION 1
1.1 DEMOGRAPHIC SITUATION 1
1.2 THE LAND 2
1.3 THE ECONOMY 4
1.4 THE SOURCES AND LIMITATIONS OF DATA 6
1.5 THE SAMPLING METHODOLOGY 7
1.6 OBJECTIVES OF THE STUDY 8
2. THE LABOUR FORCE CONCEPTS 11
2.1 THE LABOUR FORCE APPROACH 11
2.1.1 Usual Status Approach and Current Status Approach 14
2.1.2 Unemployment 17
2.2 The Labour Utilization Approach 19
2.2.1 Underemployment by Duration of Work 20
3. THE MALE LABOUR FORCE 22
3.1 DEMOGRAPHIC FACTORS AFFECTING MALE LABOUR FORCE 22 PARTICIPATION
3.2 SOCIAL FACTORS AFFECTING MALE LABOUR FORCE PARTICIPATION 28
4. THE FEMALE LABOUR FORCE 33
4.1 DEMOGRAPHIC FACTORS AFFECTING FEMALE LABOUR FORCE 34 PARTICIPATION
4.2 SOCIAL FACTORS AFFECTING FEMALE LABOUR FORCE PARTICIPATION 48 5. LENGTH OF ACTIVE LIFE AND LABOUR FORCE PROJECTION 55
5.1 LENGTH OF ACTIVE LIFE 55
5.2 LABOUR FORCE PROJECTION 59
6. SUMMARY OF FINDINGS AND CONCLUSION 64
REFERENCES 68
Table 2-1: LABOUR FORCE PARTICIPATION RATES BY BY AGE AND SEX, 1981/82
16 Table 2-2: ECONOMICALLY ACTIVE POPULATION BY EMPLOYMENT
STATUS*,1981/82
18 Table 2-3: HOURS WORKED BY AGE AND SEX, 1981/82, "CURRENT
STATUS"
20 Table 3-1: REASON FOR NOT WORKING IN MOST OF LAST TWELVE
MONTHS, 1981/82
23 Table 3-2: MALE LABOUR FORCE PARTICIPATION RATES* BY MARITAL
STATUS, 1981/82
25 Table 3-3: MALE LABOUR FORCE PARTICIPATION RATES* BY
MIGRATION STATUS, 1981/82
27 Table 3-4: MALE LABOUR FORCE PARTICIPATION RATES* BY
EDUCATION,1981/82
29 Table 3-5: MALE LABOUR FORCE PARTICIPATION RATES BY REGION 31 Table 4-1: REASON FOR NOT WORKING IN MOST OF LAST TWELVE
MONTHS, 1981/82
38 Table 4-2: FEMALE LABOUR FORCE PARTICIPATION RATES* BY
MARITAL STATUS AND AGE, 1981/82
40 Table 4-3: FEMALE LABOUR FORCE PARTICIPATION RATES BY
RELATIONSHIP TO HEAD OF HOUSEHOLD, 1981/82
42 Table 4-4: FEMALE LABOUR FORCE PARTICIPATION RATES* BY NUMBER
OF CHILDREN UNDER 5 YEARS IN THE HOUSEHOLD, 1981/82
45
Table 4-5: FEMALE LABOUR FORCE PARTICIPATION RATES* BY PLACE OF MIGRATION, 1981/82
47 Table 4-6: RELIGION AND AGE STANDARDIZED PARTICIPATION RATES*
BY REGION, 1981/82
53 Table ÜI i GROSS YEARS OF ACTIVE LIFE, 1981/82 56
Table 5-2: EXPECTATION OF ACTIVE LIFE, MALE, 1981/82 58 Table 5-3: LOSS OF ACTIVE LIFE DUE TO MORTALITY,
MALES,1981/82
60 Table 5-4: PROJECTED MALE AND FEMALE POPULATION, AGED 10+ IN
RURAL ETHIOPIA, 1986-2001
62 Table 5-5: PROJECTED MALE AND FEMALE POPULATION IN THE LABOUR 63
CHAPTER 1 INTRODUCTION
1.1 DEMOGRAPHIC SITUATION
Ethiopia is one of the countries which suffer from lack of demographic information. The first census was conducted only in 1984, and until this time the only sources of data were intermittant sample surveys. A total of six labour force surveys were conducted up to 1981 including the 1981/82 Rural Labour Force Survey which is used in this thesis. Of these, four surveys covered only urban areas and two covered only rural areas. However all these surverys have a problem of comparability because of area coverage. The first rural survey which was conducted in 1969 covered 12 adminstrative regions. The 1981/82 Rural .Labour Force Survey also covered 12 administrative regions but regions included in one survey were not included in the other and vice versa. This made any comparision between the surveys very difficult. Furthermore, because of poor documentation of the 1969 survey definitions used to identify the employed, unemployed and economically inactive are not available which makes any attempt to compare the results of the surveys unreliable.
According to the 1984 Population and Housing Census Supplementary Report the population of Ethiopia was 42 million (C.S.O, 1985a:3) giving a density of 33.6 persons per square kilometre. However, the population density between regions varied from 95.1 persons per square kilometer in Shewa adminstrative region to 7.9 persons per square kilometres Bale adminstrative region.
of the population is aged under 15 years, 49% between 15 and 64 years of age and only 4% above 65 years of age. As a result the dependency ratio of 103 in 1984 was very high.
The census found the birth rate of Ethiopia was 47 per 1000 and the total fertility rate was 6.9 ( C .S . 0 1985b:vii). This crude birth rate was higher than most African countries although a neighbouring country Kenya, had a crude birth rate of 54 per 1000 in 1980 (U.N., 1980:47).
Even though there has been some improvement in health services, life expectancy at birth is still one of the lowest in the world. In 1981 life expectancy at birth was 47 years, and infant mortality, 144 deaths per 1000 births, was one of the highest even among the developing countries of Africa.
1.2 THE LAND
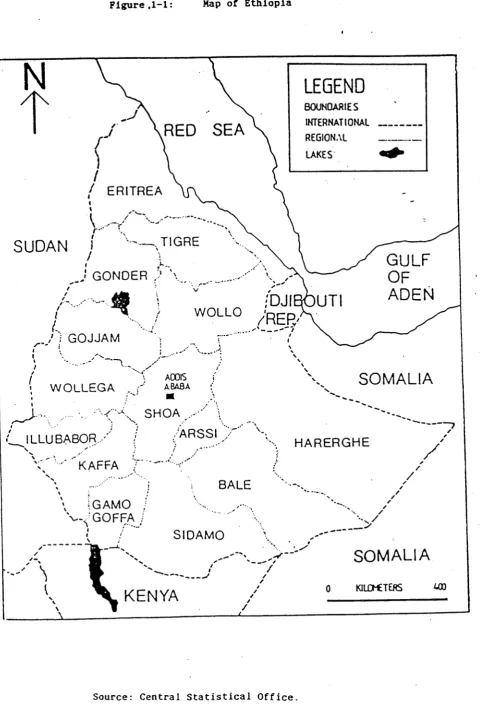
Ethiopia comprises 1,221,900 square kilometers, of which 68% is classified as agricultural land, 7% forest, 10% water and water resources and the remaining 14% is barren land (Rogers,1985:7). The country can be divided into four major physiographic regions. The largest is the Northwestern Highlands and Associated Lowlands. This region covers 43% of the total area and contains 60% of the total population. The region includes six adminstrative regions; Gondar, Gojam, Wellega, Keffa, Illubabour and Shewa. It includes some parts of the adminstrative regions of Eritrea, Tigre, Wello and Gamo Gofa. Sixty percent of the total population live in this area and the capital of the country, Addis Ababa, is also situated there (Mesfin, 1972:37).
Figure ,1-1: Map of Ethiopia
LEGEND
80UNOARIESinternational
REGIONAL
LAKES
/ ERITREA
— . TIGRE
SUDAN
GULF
OF
ADEN
.! GONDER
WOLLO
/"/ GOJJAM
SOMALIA
AOOlS ABABA
WOLLEGA
SHOA
ARSSI
ILLUBABOR •
HARERGHE
KAFFA
BALE
SIDAMO
SOMALIA
KENYA
populated region. Apart from some parts of Harrarge Plateau and the highlands of Arssi and Bale it is mainly inhabited by nomadic and semi-nomadic pastoralists (Mesfin, 1972:44).
The third physiographic region is the Ethiopian Rift Valley. This physiographic region can be divided into three types of topography. It includes the Ghibe Trough which has a general elevation of about 500 to 1000 meters. North of the Ghibe Trough is the Lakes region. In addition to its abundant water resources, the landscape of this region is smooth, making communication between the inhabitants on either side of the Rift Valley easy (Mesfin, 1972:47). The Danakil Depression is the lowest part of the Ethiopian Rift Valley with a general elevation of 200 to 500 meters. This is an area of active volcanoes. The most important feature of this area is the salt plain found there (Mesfin, 1972:51) .
The Coastal Plains which run from the tip of Eritrea to the border of Djibouti in the South comprise the fourth physiographic region. The fact that this region is low. hot and dry makes it unproductive and thus it does not have sedentary settlers and cultivators (Mesfin, 1972:51).
This wide difference between the regions of the country in terms of physiography and also the endowment of water resources has resulted in some areas being highly populated and some areas sparsely populated. It also explains why some areas are agricultural settlement areas and others contain only nomadic people.
1.3 THE ECONOMY
The economic system of the country is dominated by agriculture. More than 90% of the total population depend on agriculture for their livelihood (Rogers,1985:1). Only about 2% of the rural labour force is engaged in non-agricultural activities (Ghose, 1985:132).
marketed agricultural products. Coffee, sugar and cotton contribute 44%, cereals, pulses and oilseeds 20%, and the remaining 14% comprises livestock. However, the agricultural sector at present produces little economic surplus and as a result 70% of the total production is consumed by the farmers themselves (Rogers,1985:1).
In discussing the subsistence agricultural economy it is important to mention the past and present ownership of land. Prior to the 1974 revolution there were two main types of land ownership.
The first type of land ownership was communal individual ownership. This type of ownership existed mainly in the northern part of the country. Land was communally held by descendants of common ancestors or, in some places, the duration of residence in a particular area and building of homes entitled communal individual ownership of land. In reality communal individual ownership of land means collective ownership. The individual does not have absolute ownership over the land because the area of his/her land can vary from time to time depending on such factors as, the total amount of land available to the society and the ability of the individual to operate and manage the given area of land (Mesfin, 1972:85).
The second type of land ownership was private ownership. The acquisiton of land could be as a result of purchase, inheritance or grant from the government. This type of ownership was common in the southern part of the country. Absentee land lords were the major land owners in this area.
Since the 1974 revolution all rural land is owned by the state or by cultivating households. A household could own a maximum of 10 hectares with a prohibition of transfer of land through sale, lease, mortgage or any other such agreement. Most farmers became members of Farmers Associations. These Associations make periodic redistributions of land depending on the size and composition of membership (Ghose, 1985:129).
The state farms are run by the government and use mechanized farming techniques with large units of land. State farms are different from Farmers Associations not only because of their use of mechanized farming techniques but because the workers in the state farms, unlike the majority of farmers, are skilled or semi-skilled and have an urban background.
1.4 THE SOURCES AND LIMITATIONS OF DATA
The primary source of data for this study is the data tape for the 1981/82 Rural Labour Force Survey done by the Central Statistical Office' of Ethiopia. However, the data tape for the 1980/81 Demographic Survey, which was also conducted by the Central Statistical Office of Ethiopia, is a supplementary source, particularly for Chapter 3 and Chapter 4.
The major limitation of the Rural Labour Force Survey data is that it lacks variables such as religion, ethnicity and fertility which could have been used in studying the participation differentials between the sexes and the different regions. Another factor which limits the use which can be made of these data is that the sample discriminates against non-agricultural households. Because of this, non-farm employment, which is said to be increasing and thus an important and interesting area for research, cannot be described.
the data collected. As in the case of most developing countries, age mis-reporting is one characteristic of the data. Another example of the poor quality of the data is that responses to some questions included in the questionnaire, such as those on income, were not recorded in the majority of cases. The absences of this information hindered for example the measurement of underemployment through the low income criterion.
1.5 THE SAMPLING METHODOLOGY
The country is divided into 14 administrative regions which are themselves sub-divided into 102 provinces awrajas and 600 sub-provinces
weredas. In this survey only 12 of the 14 adminstrative regions are covered since Eritrea and Tigrai region are excluded. The sampling methodology was as follows.
A list of Farmers Associations was made in the 12 adminstrative regions. This list of 18,989 Farmers Associations was used as a frame for the selection of primary sampling units. The 18,989 Farmers Associations were distributed throughout the regions, in 77 provinces. These 77 provinces were the first level of stratification. 500 Farmers Associations were selected from within the 77 provinces taking into consideration,
a) the size of the administrative regions,
b) that at least 34 Farmers Associations should be selected from a given adminstrative region.
The number of Farmers Associations that were selected from each province was proportional to the number of Farmers Associations in each of the 77 provinces. The Farmers Associations (the primary sampling units) were selected without replacement with probability proportional to size, size being the number of Farmers Associations.
agricultural household is defined as a household where at least one of the members of the household owns an agricultural holding and takes major decisions regarding the utilization of available resources.
From the list 100 households were selected from each Farmers Association. Selection was then made with probability proportional to the number of land holders in each of the households. These households were used for the 1980/81 Demographic Survey which was a part of the integrated household survey undertaken by the Central Statistical Office of Ethiopia. The Labour Force Survey, which was undertaken in 1981/82, was also a part of the programme of the office. The Labour Force Survey interviewed the first 25 of the 100 households in each Farmers Association interviewed for the Demographic Survey.
1.6 OBJECTIVES OF THE STUDY
One difficulty which is usually faced in planning, especially in rural development planning, is the lack of information on employment and unemployment, demographic and social characteristics of the employed and unemployed. This study attempts to contribute to the scarce information on Ethiopia's rural labour force, by
1) Assessing the potential rural manpower;
2) Examining the employed, unemployed and underemployed and their social and demographic characteristics.
open unemployment (Turnham, 1971:57). Looking at the social and demographic characteristics of the unemployed and underemployed will, to some extent, help explain what prevents individuals from fully utilizing their labour;
3) Calculating the participation rates for the different regions of the country and different sexes and examining the differences;
Male participation rates tend to be the same for most countries and between places within a country. However, female labour force participation rates differ from country to country and between places within a country
(Durand, 1975:37). The reasons for these differences could be demographic or
socio-economic factors.
4) Calculating the length of active life for the male population and projecting the rural labour force to the year 2001.
Regarding underemployment the following questions will be answered,
1) Is rural underemployment more significant than unemployment?
2) Is underemployment higher for women than for men ?
older persons?
This thesis comprises five chapters. This chapter has discussed the demographic situation, the geography, the economy of the country and the source of data and its limitations are also discussed in this chapter.
The second chapter examines the different approaches used to collect labour force data in the 1981/82 Rural Labour Force Survey. In the second section of the chapter unemployment and underemployment are discussed.
Chapter 3 analyses the male labour force in rural Ethiopia. Demographic and social variables which could have some effect on male labour force are examined. The regional differences in male labour force participation is also discussed
CHAPTER 2
THE LABOUR FORCE CONCEPTS
The labour force, a term which in this thesis is used interchangably with economically active population, is that part of the manpower of a country which furnishes labour for the production of economic goods and services. The labour force plays an important role in economic growth both directly as an important input in production, and indirectly as a major influence on the human enviornment.
This chapter reviews various approaches to measuring the labour force. In the first section of the chapter the labour force approach and its results are discussed and in the second section the labour utilization approach is discussed.
2.1 THE LABOUR FORCE APPROACH
The labour force approach was developed as an improvement on the gainful worker approach. The gainful worker approach was thought to be a deficient method because of its inability to show an individual's current activity. As a result the gainful worker does not allow the estimation of the employed, the unemployed, the sick, the retired or those not able to work for some other reason. Since first time job seekers do not have a usual occupation they are excluded from the labour force when one uses the gainful worker approach (Standing, 1975:26).
group includes the employed and unemployed, where the employed are defined as persons who have performed some type of work for pay or profit during the reference period and the unemployed as persons who were without work during the reference period but were available for work and seeking work for pay or profit (I.L.O., 1982:10).
The labour force approach, which is used as a measure of labour supply, is based on three assumptions: that the working age limit is clearly identifiable, that the labour force measures the aggregate labour supply and that activity status is clearly identifiable. Of the three assumption the last two are most challenged. Critics argue that the labour force approach cannot measure the labour supply because in measuring the labour force, factors such as duration of work, effort or intensity of work and commitment to change, which affect the labour supply, are not considered. It is also argued that the identification of activity status is not easy because economic activity depends on the reference period and the minimum amount of work required to be classified as employed (Standing, 1975:32).
seldom look for work (Turnham, 1971:43). Actively looking for work is seen as an absurd practice. They adjust to the peak and slack season work by lengthening or shortening their work hours (Yotopaulos,
1976:202).
DEFINITIONS
Economically Active Population
In the 1981/82 Rural Labour Force Survey of Ethiopia the definitions of economically active and inactive population were based on the standards of the International Labour Organization. The economically active population is measured using both the Usual Status Approach and the Current Status Approach.
The usually active population is the economically active population obtained using the usual status approach while the currently active population is obtained using the current status approach. The currently active and usually active population include the employed as well as the unemployed population.
To identify the usually active population the question asked was, "Were you engaged in productive work most of the last 12 months?" (C.S.O., 1981:11)
A positive answer to this question meant being employed and a negative answer not employed. A person was said to be engaged in productive work if he/she was able to take his/her product, whether service or material, to market for sale or for exchange for some other product. Unpaid family workers who help in the production of such goods and services as explained above were also considered as being engaged in productive work.
for a government organization, private organization or private individual for pay or in kind) or an unpaid family worker.
Workers engaged in crop production, poultry and livestock, hunting and fishery were considered as engaged in productive activity if they took their produce to market or if their produce was partially or totally consumed at home. However, other workers whose products or services were totally consumed by the family were not considered as productive workers and hence their work was unproductive.
The question asked for current activity was" Were you engaged in productive work last week?" Productive work was defined as above and any person who had worked half a day or more during the reference week was considered as working.
For both the usual and current status approach a person is considered as unemployed if he/she answered "no" to the questions listed above and was actively seeking work or was not seeking work, during the given reference periods, but was willing to work if work was available. The willingness to work was based upon the individual's response (C.S.O., 1981:30).
2.1.1 Usual Status Approach and Current Status Approach
The usual status approach and current status approach are two methods of measuring the labour force. They are varieties of the labour force approach.
The usual status approach has a longer reference period which can stretch to one month, a quarter or twelve months before the survey. This approach has an advantage over the current status approach in countries where several surveys cannot be undertaken within a year and where there is a significant seasonal pattern. The other advantage is that since the reference period stretches over a long period "it can provide information on the economic activity of most consequence to each person" (I.L.O., 1982:17).
On the other hand, using the usual status approach has its drawbacks. It is difficult to determine activity status, occupation and industry over the long reference period because the possibiliity of movement and change is higher in the long reference period than the brief reference period.
Another disadvantage of the usual status approach is its reliance on memory-dependent responses so errors are higher than for the current status approach. This makes it unreliable as a measure of employment, unemployment and detailed classification by occupation and industry
(I.L.O. ,1982:36) .
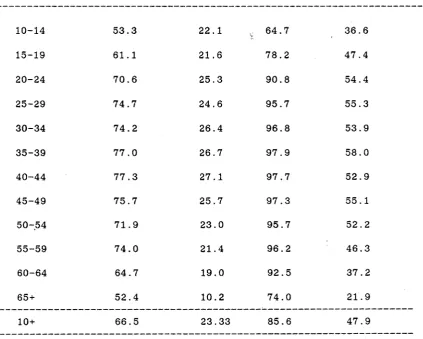
Table 2-1: LABOUR FORCE PARTICIPATION RATES BY BY AGE AND SEX, 1981/82
PARTICIPATION RATES
CURRENT STATUS USUAL STATUS
AGE MALE FEMALE MALE FEMALE
10-14 53.3 22.1 64.7 36.6
15-19 61.1 21.6 78.2 47.4
20-24 70.6 25.3 90.8 54.4
25-29 74.7 24.6 95.7 55.3
30-34 74.2 26.4 96.8 53.9
35-39 77.0 26.7 97.9 58.0
40-44 77.3 27.1 97.7 52.9
45-49 75.7 25.7 97.3 55.1
50-54 71.9 23.0 95.7 52.2
55-59 74.0 21.4 96.2 46.3
60-64 64.7 19.0 92.5 37.2
65 + 52.4 10.2 74.0 21.9
10 + 66.5 23.33 85.6 47.9
Source:- Computed from the 1981/82 Rural Labour Force Survey data tape.
a) People who were working for most of the long period may have retired or stopped working at the time of the survey,
b) Some people may not have been working during the survey because it was the off-season, or
[image:23.550.35.459.231.570.2]The wide gap between the results of the two approaches can be explained in this case by reasons (a) and (b). Agriculture, the main occupation in rural Ethiopia, is affected by seasonality. This seasonality results in underutilization of labour during the slack season and overutilization during the active seasons of ploughing, weeding and harvesting. The cropping season in most areas extends only from June to January (Ghose, 1985:132, 133). The rainfed type of agriculture with almost no irrigation schemes also makes the work of the farmers very unevenly distributed throughout the year. The survey from which the activity rate was calculated was undertaken in April, a month which is part of the slack season.
The other reason is that unpaid family workers, who comprise a large proportion of the labour force, participate mainly during the peak season. When this season passes women, who comprise 58% of the unpaid family workers who participate chiefly during the peak season, go back to their usual household work and thus they cease to be part of the labour force.
2.1.2 Unemployment
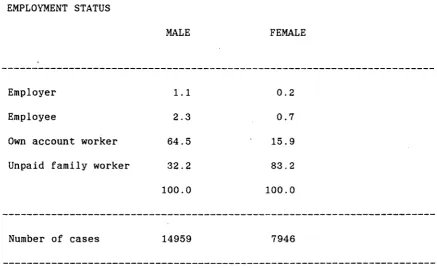
Unemployment is one manifestation of labour underutilization. According to the conventional labour force approach only 35, out of 34098 working age population of 10 years and over, were classified as unemployed. This improbable figure could have resulted, as Blaug (1974:25) suggests, because of the definition in the survey which is the international standard definition of unemployment. The other possible reason could be the very few appearances of open unemployment in rural areas. Turnham (1971:56) after investigating the unemployment situation in several developing countries came to the conclusion that even if a thorough investigation of unemployment is made, open rural unemployment is very low.
the male and 83% of the female economically active population are unpaid family workers. As stated above, in both types of situations the rate of open unemployment appears very low because the employer/employee agreement which, when broken, makes a person unemployed, is non-existent. Secondly, most of the time there is some kind of work to be done on the family farm, therefore the own account worker does not look for work. Thirdly, heavy demands, on labour during the peak season with little work during the slack season is accepted by Ethiopian farmers. As farmers live in close communities where everyone knows everybody and every situation, they know if there is work available in their vicinity. Where they see most people without work the farmers become reluctant to look for work.
Table 2-2: ECONOMICALLY ACTIVE POPULATION BY EMPLOYMENT STATUS*,1981/82
EMPLOYMENT STATUS
MALE
SEX
FEMALE
Employer 1.1 0.2
Employee 2.3 0.7
Own account worker 64.5 15.9
Unpaid family worker 32.2 83.2
100.0 100.0
Number of cases 14959 7946
Note:- *= Employment status of the usually active population.
[image:25.550.30.468.399.667.2]2.2 The Labour Utilization Approach
Another manifestation of the underutilization of labour is underemployment. The extent of underemployment is calculated on the basis of the labour utilization approach. According to the International Labour Organization underemployment can be divided into two. Visible and invisible underemployment (I.L.O., 1982:12).
Visible underemployment exists when people involuntarly work less than "normal" hours and would accept additional work. Invisible underemployment exists when people are working full time but there is a mismatch of education, low productivity and low income.
Because of the limited data on this topic in the 1981/82 Rural Labour Force Survey, inadequately utilized labour by income and efficiency cannot be measured. Blaug (1974;125) however suggests the prevalance of underemployment by income and low productivity in rural Ethiopia. Ghose (1985:33) also commenting on this point, says that underemployment in rural Ethiopia is seen through the low productivity
in agriculture which is a result of the techonological backwardness.
Mismatch by education is one manifestation of invisible underemployment. It occurs when an individual's job is incompatible with their education. That is, when a person's education is not fully utilized in their occupation (Hauser, 1977:12). Underemployment by mismatch of education is almost inapplicable in this case because 80% of the survey population is illiterate. This means there is not much scope to compare individuals' occupations with their education.
2.2.1 Underemployment by Duration of Work
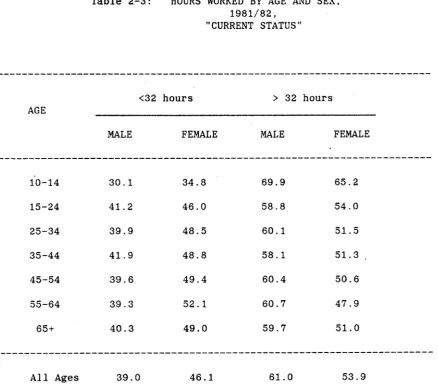
To distinguish the part of the labour force adequately utilized from the inadequately utilized, a cut off point is needed. Hauser(1977) considering comparability of data between countries mentioned 40 hours per week. However, for rural Ethiopia, taking into consideration the customs and traditions of the country, a 32 hours cut off point is used. In the data used the information available is the number of days worked and thus 32 hours work is taken as the equivalent of four days work.
Table 2-3: HOURS WORKED BY AGE AND SEX, 1981/82,
"CURRENT STATUS"
AGE
<32 hours > 32 hours
MALE FEMALE MALE FEMALE
10-14 30.1 34.8 69.9 65.2
15-24 41.2 46.0 58.8 54.0
25-34 39.9 48.5 60.1 51.5
35-44 41.9 48.8 58.1 51.3
45-54 39.6 49.4 60.4 50.6
55-64 39.3 52.1 60.7 47.9
65 + 40.3 49.0 59.7 51.0
All Ages 39.0 46.1 61.0 53.9
[image:27.550.33.472.285.670.2]The results obtained using this cut off level are shown in Table 2-4. The usual pattern is that the percentage working less than normal hours is high for the young age groups, low for the intermediate age groups and high for the old age groups (Hauser, 1977:13). However in Table 2-4 percentages are almost the same for all ages, about 40%. The slightly lower percentage for the young ages is because they have jobs like taking the herds to and from the river. These jobs are always present, be it the slack or peak season. The figures in Table 2-4 are not very far from the range Ghose(1985:132) mentioned for rural Ethiopia which was 25-40%.
CHAPTER 3
THE MALE LABOUR FORCE
The degree to which demographic and socio-economic factors affect the labour force varies according to sex. Some factors such as religion and custom which may influence the level of female labour force participation have little effect on male participation. This chapter considers factors affecting the male labour force, while Chapter 4 focusses on females. As mentioned in Chapter 2, the 1981/82 Rural Labour Force Survey measures both the currently active population and the usually active population. In the following discussion the usually active population is considered. Since the survey was done in the slack season of agriculture in Ethiopia, the currently active population is underestimated. Activity rates and labour force participation rates which are both calculated as a percentage of population in an age group or in a total population who are in the labour force are alternatively used in this thesis.
3.1 DEMOGRAPHIC FACTORS AFFECTING MALE LABOUR FORCE PARTICIPATION
AGE
show the pattern of male participation rates Durand (1975:22) classified age groups into the entry age, prime age and retirement age. In the entry age men are still entering the labour force and the participation rises with age. In the prime age most men are in the labour force and participation rate reaches its maximum. Around retirement age participation rates start to decline as people leave the labour force because they are too old to work or they are sick.
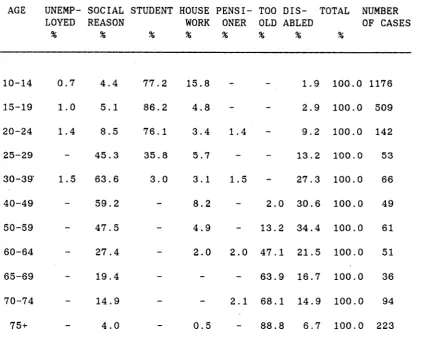
Table 3-1: REASON FOR NOT WORKING IN MOST OF LAST TWELVE MONTHS, 1981/82
AGE UNEMP- SOCIAL STUDENT HOUSE PENS I- TOO DIS- TOTAL NUMBER L0YED
%
REASON
% %
WORK
%
ONER %
OLD ABLED
% %
OF CASES %
10-14 0.7 4.4 77.2 15.8 _ _ 1.9 100.0 1176
15-19 1.0 5.1 86.2 4.8 - - 2.9 100.0 509
20-24 1.4 8.5 76.1 3.4 1.4 - 9.2 100.0 142
25-29 - 45.3 35.8 5.7 - - 13.2 100.0 53
30-39 1.5 63.6 3.0 3.1 1.5 - 27.3 100.0 66
40-49 - 59.2 - 8.2 - 2.0 30.6 100.0 49
50-59 - 47.5 - 4.9 - 13.2 34.4 100.0 61
60-64 - 27.4 - 2.0 2.0 47.1 21.5 100.0 51
65-69 - 19.4 - - - 63.9 16.7 100.0 36
70-74 - 14.9 - - 2.1 68.1 14.9 100.0 94
75 + - 4.0 _ 0.5 — 88.8 6.7 100.0 223
SOURCE:- Computed from the 1981/82 Rural Labour Force Survey.
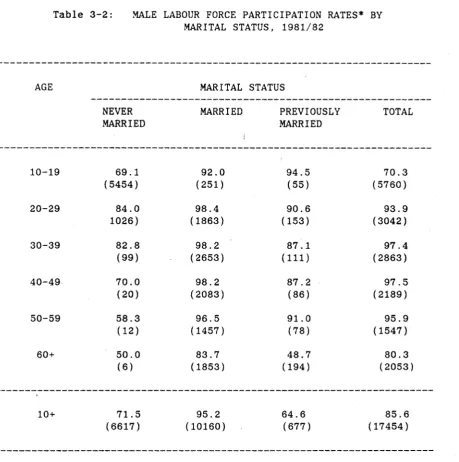
[image:30.550.33.465.283.629.2]As shown in Table 3-2, the participation rate in the entry age group 10-19 is 70%. This same pattern of entry was also apparent in the urban areas of the country. A 1978 survey of 17 major towns revealed a similar pattern but with a participation rate of only 16% for the age group 10-19 and 80% for the males aged 20-29 (C .S .0.,1980:149).
Table 3-2 shows a significant rise in participation to 94% in the age group 20-29 from 70% in the preceding age group. Between ages 30-49 the participation rate reaches its maximum of 97%. Until age 60 no significant decline in participation rate is seen. For ages past 60, retirement or "too old" starts to show as an important reason for not working in Table 3-1. In the Civil Service of the country there exists a pension system where women aged 55 years and men aged 60 stop working and start receiving a pension from the Government. However, in the rural areas with no old age pension for farmers or any sort of social security, economic necessity obliges the old men to remain in the labour force longer. Table 3-1 shows that only after the age of 65 did more the 50% report that they were not working because they were too old.
MARITAL STATUS
Male activity rates classified by marital status are presented in Table 3-2. This table shows that in all age groups married men have higher participation rates than single men. The previously married category, which comprises widowers and divorcees, has the second highest participation rates and the never married have the lowest participation. The higher participation of married men is a common feature of some developing countries (Sheehan, 1978; Standing and Sheehan, 1978).
Table 3-2: MALE LABOUR FORCE PARTICIPATION RATES* BY MARITAL STATUS, 1981/82
AGE MARITAL STATUS
NEVER MARRIED
MARRIED PREVIOUSLY MARRIED
TOTAL
10-19 69.1 92.0 94.5 70.3
(5454) (251) (55) (5760)
20-29 84.0 98.4 90.6 93.9
1026) (1863) (153) (3042)
30-39 82.8 98.2 87.1 97.4
(99) (2653) (111) (2863)
40-49 70.0 98.2 87.2 97.5
(20) (2083) (86) (2189)
50-59 58.3 96.5 91.0 95.9
(12) (1457) (78) (1547)
60 + 50.0 83.7 48.7 80.3
(6) (1853) (194) (2053)
10 + 71.5
(6617)
95.2 (10160)
64.6 (677)
85.6 (17454)
Note:- 1) *= Computed using the usually active population. 2) Base numbers of activity rates are shown in brackets. Source:- Same as Table 3-1.
[image:32.550.29.489.65.528.2]The higher participation of married men could have resulted because of the following reasons. Firstly men in rural Ethiopia get married after they start working and are able to take care of a family which means in most cases being in the labour force precedes marriage. Secondly with a family to take care of they are more motivated to work than never married men. At age 60 the participation of married men is still high while that of the previously married men has decreased compared to the preceding age groups. This could be an indication of late withdrawal of married men from the labour force.
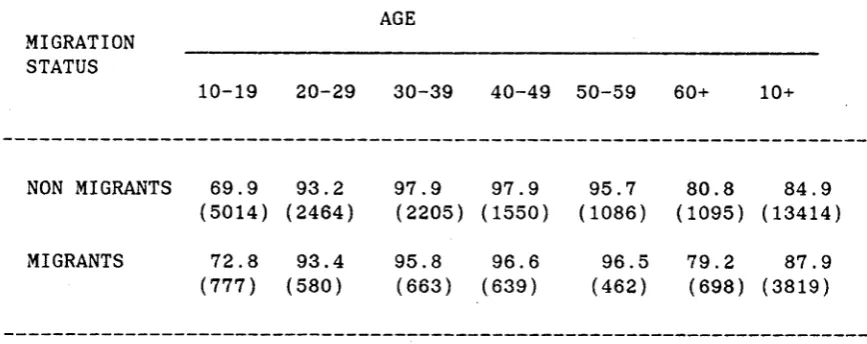
MIGRATION
Depending on the motive inducing mobility, migration can have a positive or a negative relationship with labour force participation rates. Of the different reasons for migration, the economic motive seems to be dominant. Moves are usually from low levels of economic opportunities to areas where there are better opportunities and thus migrants are more likely to be in the labour force (Standing, 1978:2.08,209) .
Table 3-3: MALE LABOUR FORCE PARTICIPATION RATES* BY MIGRATION STATUS, 1981/82
MIGRATION
AGE STATUS
10-19 20-29 30-39 40-49 50-59 60+ 10+
NON MIGRANTS 69.9 (5014) 93.2 (2464) 97.9 (2205) 97.9 (1550) 95.7 (1086) 80.8 (1095) 84.9 (13414) MIGRANTS 72.8 (777) 93.4 (580) 95.8 (663) 96.6 (639) 96.5 (462) 79.2 (698) 87.9 (3819)
Note:- 1) *=Computed by using the usually active population. 2) Base numbers for activity rates are shown in brackets. Source:- Same as Table 3-1.
[image:34.550.28.462.168.340.2]3.2 SOCIAL FACTORS AFFECTING MALE LABOUR FORCE PARTICIPATION
Education
The educational system in Ethiopia before 1974 was one of the most neglected, even compared with other African countries. Educational facilites were inadequate with a great shortage of qualified teachers. These inadequate facilites were also unevenly distributed between the regions of the country. The highest concentration of schools was seen in the two regions of Shewa and Eritrea which had the two major urban cities of the country (Shwab, 185:88).
Since the 1974 revolution the Government has tried to improve the educational system in several ways. The prime concern of the Government is to eradicate illiteracy. Between 1974 and 1976 the "National Work Campaign for Development Through Cooperation" was in operation. The main participants of this campaign were secondary students and teachers from all over the country. Apart from other development oriented works such as building of roads etc. the main achievement of this campaign was the initiation of literacy work in the rural areas.
The second attempt to erradicate illiteracy was the launching of the "National Literacy Campaign" in 1979. Since then the campaign has continued in rounds or stages. The first two rounds mainly focussed on urban areas but after the second round the emphasis shifted to rural areas (N.L.C.C.C., 1984:18).
In Ethiopia the educational system is divided into three levels. Grades 1-6 are primary school, grades 7-8 junior secondary school and grades 9-12 secondary school. In the 1981/82 Rural Labour Force Survey the highest grade completed and literacy status were the information available. But because of the concentration of males with some education in the primary school detailed classification by grades resulted in several cells with very few cases. Thus the broad categories of no formal education and some education are used in Table 3-4.
Table 3-4: MALE LABOUR FORCE PARTICIPATION RATES* BY EDUCATION,1981/82
AGE NO FORMAL
EDUCATION
SOME FORMAL EDUCATION
10-19 83.2 38.7
(4062) (1632)
20-29 95.9 83.1
(2383) (575)
30-39 97.4 98.0
(2570) (256)
40-49 97.6 95.7
(2068) (95)
50-59 95.9
(1501)
60 + 80.4
(2015)
Note:- 1)..= cell less than 25.
2) * =Computed using the usually active population. 3) Numbers in bracket are base numbers for percentage. Source:- Same as Table 3.1.
[image:36.550.44.466.420.643.2]because of school attendance, and it could have a positive impact by increasing the opportunity cost and propensity to be in the labour force (U.N., 1968:56) .
Table 3-4 shows that education has a negative relationship with male labour force participation in the early ages. For ages 10-19 and 20-29 those who have some education have lower participation than those who do not have any formal education. For age groups 30-39 and 40-49 no significant difference is seen between the participation rates of those with some education and those with no education. The negative relationship between education and male participation rates in the early ages could be the effect of school attendance on labour force participation. Table 3-1 above shows the reason for not working during the reference period of twelve months. In the entry ages from 10-19 most males reported being a student as a reason for not working. Nintey-two per cent per cent in this age group who were students were attending primary school and 8% were attending junior secondary and secondary school. In the age group 20-24, 52% were attending primary school while 48% were attending junior secondary and secondary school.
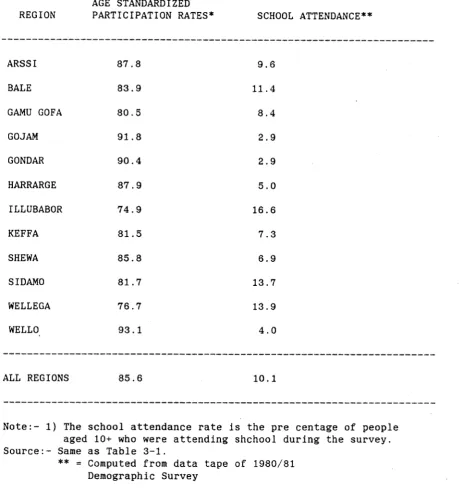
REGIONAL DIFFERENCES
Table 3-5 gives the age standardized participation rates for twelve regions of the country. The rates are mostly high but there seems to be some variation within the regions. Five regions have participation rates exceeding that of the whole country and two regions, Illubabour and Wellega, have a significantly lower figure than the country as a whole.
Table 3-5: MALE LABOUR FORCE PARTICIPATION RATES BY REGION
REGION
AGE STANDARDIZED
PARTICIPATION RATES* SCHOOL ATTENDANCE**
ARSSI 87.8 9.6
BALE 83.9 11.4
GAMU G0FA 80.5 8.4
GO JAM 91.8 2.9
GONDAR 90.4 2.9
HARRARGE 87.9 5.0
ILLUBAB0R 74.9 16.6
KEFFA 81.5 7.3
SHEWA 85.8 6.9
SIDAMO 81.7 13.7
WELLEGA 76.7 13.9
WELL0 93.1 4.0
ALL REGIONS 85.6 10.1
Note:- 1) The school attendance rate is the pre centage of people aged 10+ who were attending shchool during the survey. Source:- Same as Table 3-1.
** = Computed from data tape of 1980/81 Demographic Survey
[image:38.550.25.496.121.614.2]* CO U2 E— < o o o z o r -< x o o o CO o o o o CxJ C_3 X o (X. ex 3 o X < < s: ex o * X CJ z < o z 1iZ E E -< _ 3 c c o CO o o o o o o o X fcj E— E-" < u CO
s
o I 00 03 u a bo o o Q O O O ♦ -o o o o o o o o o o o o o o o o o o o o o o o o o o o o oo oo
o o
S31VH NOIJWdIDIJilVd
CHAPTER 4
THE FEMALE LABOUR FORCE
In general female labour force participation rates are lower than the corresponding rates for males. Although the pattern of male participation is almost the same for most countries, the pattern of female labour force participation differs widely from country to country and between places within a country (Durand, 1975:37). In some censuses and surveys in developing countries the low level of female participation could be a result of underestimation because of the definition of productive work. Women spend a significant amount of their time preparing food and carrying water and fire wood long distances every day. Domestic work is not classified as a productive work so they are left out of the labour force even though when the same job is done for pay it is classified as productive work (Boserup, 1974:82).
Secondly, women's participation rates could be underestimated because of a technical problem of under-reporting. Under-reporting can occur due to the irregularity of women's work outside the household, that is, the greater incidence of seasonal work among women, which is usually overlooked during reporting. Thirdly, proxy reporting by husbands or fathers who have the traditional idea that a woman's place is at home could be another reason for under-reporting. Furthermore, women's work can be under-reported when items for sale such as handicrafts made at home by women are neglected. (Beneria, 1981:14-15).
and social variables affecting female labour force participation in rural Ethiopia are considered. For reasons discussed in Chapter 3 in this chapter also the usually active population is considered except in Figure 4.1 where a comparison between the two approaches is shown. Because of the limited number of questions on some variables in the 1981/82 Rural Labour Force Survey a wider discussion on the subject was impossible. All the analysis is based on cross tabulation of participation by the available demographic and social variables. Efforts to undertake Multiple Classification Analysis were not fruitful.
4.1 DEMOGRAPHIC FACTORS AFFECTING FEMALE LABOUR FORCE PARTICIPATION
AGE
Age-specific activity rates are commonly used to show the different patterns of economic activity. The age patterns of female economic activity fluctuates from society to society more than the male patterns because the age at which women enter or leave the labour force greatly depends on life cycle events such as marital status, childbearing or widowhood. In some societies unmarried women have high rates of participation but they leave the labour force when they get married and have children. These women have a chance of re-entering the labour force when their children are old enough and they do not need their care. In some cases the time for re-entering the labour force is when they become widows (Durand, 1975:37).
middle ages when they have children who need to be cared for. In the double peak pattern the first peak is a result of high participation of young women who do not have any child care responsibility and the second peak shows the re-entering of married women whose children have grown up and widows. The portion re-entering the labour force is higher in the double peak than the peak and shoulder pattern. The late peak pattern shows that early motherhood has an effect on female participation rates resulting in low participation of young women. Central peak and central plateau represent a situation where female labour force participation and marriage and motherhood are not closely related (Durand, 1975:42).
In developing countries, until the ages when women retire because they are too old to work, age often seems to have a positive relationship with female labour force participation (Anker and Knowles, 1983:191). This positive relationship is a result of the nature of the work they do. It is mostly agricultural, near the home and compatible with child care and their marriage (U.N., 1962:23).
Ijn the 1960 census data it was found that Ghana had the late peak pattern. Age specific activity rates were low for the young age groups and started to increase with age, reaching a peak in the age group 50-59. They then declined as the women became too old to work. In the lower ages the participation rate was low because most women in these ages were engaged in housework. In the older age groups participation increased because homemaking and marriage rates decrease. Divorce increases or husbands marry other wives and the women have to work for psychological reasons to be independent, or to meet their financial needs (Tetteh, 1971:39).
motherhood. This accounts for the age specific pattern (Eltahir, 1983:56).
Figure 4-1 which is based on data shown in Table 2-1, shows that the level of female participation is low compared to male participation. The refined female activity rate( the percentage of adult females in the labour force) was found to be 86% for males and 48% for females when the usually active population is considered. When the currently active population is used the refined rates were 23% for females and 67% for males.
In Chapter 3, working age males were divided into three groups: those of entry age, those of prime age and those of retirement age. A similar approach can be used for females in rural Ethiopia. Table 4-2 indicates that, at the age of entry participation is very low. Reference to Table 3-4 and Table 4-1 shows that more females who were not employed were engaged in housework, whereas most males who did not work were students.
In the prime age group, from 20-49, years participation rates for females increased significantly from the entry age. As shown in the final column of Table 4-2 the female participation rate reached its maximum of 56% in the age group 30-39. As in the entry age the main reason for being out of the labour force was house work in Table 4-1. A significant decline in participation is seen after age 59 when the main reason for not working becomes old age.
Figure 4-1: MALE AND FEMALE LABOUR FORCE PARTICIPATION
RATES, 1981/82, USUAL AND CURRENT APPROACH
%
MALE
FEMALE
fSUAL APPROACH
CURRENT APPROACH
CURRENT APPROACH
% USUAL APPROACH
AGE
[image:44.550.12.502.123.772.2]Table 4-1: REASON FOR NOT WORKING IN MOST OF LAST TWELVE MONTHS, 1981/82
AGE UNEMP LOYED
%
SOCIAL REASON
%
STUDENT %
HOUSE WORK
%
PENSI ONER
%
TOO OLD %
DIS- TOTAL NUMBER
ABLED CASES
% %
10-14 0.1 1.5 24.3 73.5 0.1 - 0.6 100.0 1775
15-19 0.2 1.9 15.2 81.6 - - 1.0 100.0 964
20-24 0.4 4.1 2.4 91.9 0.1 - 1.0 100.0 777
25-29 0.4 4.0 0.1 93.6 0.1 - 1.8 100.0 904
30-39 0.1 5.3 0.1 92.6 0.1 - 1.8 100.0 1410
40-49 0.2 6.4 0.1 89.6 0.1 1.3 2.3 100.0 922
50-59 0.2 9.8 - 70.7 0.3 16.7 2.3 100.0 641
60-64 - 5.9 - 39.6 1.0 51.4 2.1 100.0 389
65-69 - 4.3 - 36.8 1.9 51.4 5.7 100.0 209
70-74. - 2.9 - 15.4 2.1 77.1 2.5 100.0 240
75 + - 2.0 - 7.5 1.2 86 .5 2.9 100.0 347
Source:- Computed from the 1981/82 Rural Labour Force Survey data tape.
MARITAL STATUS
[image:45.550.32.466.155.600.2]women and the lowest for married women. The activity rates for divorcees and widows lies between these two ranges. Married women have the lowest participation rates because they get most of the economic support they need from their husbands. The high participation rates for single women (including never-married, separated and widowed) is because they have to work to support themselves and their dependants (U.N., 1971:57; Darling, 1975:17; Bowen and Finegan, 1969:244; Nassef, 1970:64).
However, in the U.S.A in 1960, the participation rates of single women depended on their family status, that is, whether they were the head of the household or a member of a household in which another person was the head. Women who lived alone or were living with non-relatives had higher participation rates. For separated women and women whose husbands were away, the duration of the husband's absence played an important role in motivating the women to work. Divorced and widowed women's participation was also affected by the duration of time since the event. Women who lost their husbands long ago had higher participation rates than women who had lost their husband recently
(Bowen and Finegan, 1969:247).
Using the 1960 Egyptian census, Nassef showed the effect of marital status on female labour force participation. Married women had the lowest participation rates compared to single, divorced and widowed women who had first, second and third place respectively (Nassef,
1970:65).
Table 4-2: FEMALE LABOUR FORCE PARTICIPATION RATES* BY MARITAL STATUS AND AGE, 1981/82
A C C
MARITAL STATUS NEVER
MARRIED
MARRIED PREVIOUSLY
MARRIED TOTAL
10-19 36.5 51.4 58.7 40.9
(3377) (1090) (189) (4656)
20-29 55.4 58.3 54.9
(3416) (192) (3735)
30-39 55.3 65.2 55.8
(3008) (181) (3198)
40-49 53.0 60.3 53.8
(1724) (209) (2023)
50-59 51.2 28.6 50.2
(908) (199) (1330)
60 + 41.8 19.6 27.8
(608) (200) (1635)
10 + 36.3
(3535)
53.5 (5752
40.0 (2289)
47.9 (16577)
Note:- l)..=cell less than 50.
2) *= Computed using the usually active population.
3) Base numbers for activity rates are shown in brackets. Source:- Same as Table 4-1.
Table 4-2 shows female labour force participation rates by marital status. In rural Ethiopia, the participation rates for never married women were not higher than those of currently married women. This is partly because the never married category had significant cases only in the age group 10-19, the age group where female students were concentrated. After the age of 20 only 1% were never married, indicating that early marriage was universal in rural Ethiopia.
[image:47.550.26.506.69.472.2]previously married women. The previously married category includes widows and divorcees. The high participation rate of this group is expected because women usually become the head of the household when the husband, who is usually the bread winner, dies. Being the head of a household widows participate more because they have a responsibility to their family members.
Even though married women have lower participation rates than widows and divorcees in most age groups they still have high participation rates. This could be an indication that marriage does not have a significant negative effect on the female labour force participation rate. The participation rate of married women is close to each other in all age groups except ages 60+ when it is lower as people get old and leave the labour force.
RELATIONSHIP TO HEAD OF HOUSEHOLD
Relationship to head of household seems to have a clear relationship with female labour force participation. As shown in Table 4-3 women who are heads of households have higher participation rates, except in the age group 60+, than those in other categories. This result agrees with Sheehans finding for Khartoum, capital of the Sudan
(Sheehan, 1978:168).
Table 4-3: FEMALE LABOUR FORCE PARTICIPATION RATES BY RELATIONSHIP TO HEAD OF HOUSEHOLD, 1981/82
AGE RELATIONSHIP
HEAD SPOUSE CHILD RELATIVES
10-19 55.3 37.3 41.9
(698) (3189) (772)
20-29 83.2 54.4 45.2 53.2
(143) (3157) (239) (203)
30-39 74.2 54.6 57.1
(225) (2893) (84)
40-49 68.8 52.7 42.3
(213) (1640) (137)
50-59 62.9 52.1 29.6
(248) (847) (236)
60 + 42.7 44.1 11.5
(361) (528) (788)
Note:- 1)*= Computed using the usually active population. 2 ) .. Cell less than 20.
3) Base numbers of activity numbers are shown in brackets. Source:- Same as Table 4-1.
NUMBER OF CHILDREN IN THE HOUSEHOLD
[image:49.550.31.484.61.455.2]of marriage, and income. However, even controlling for these variables the inverse relationship still persisted (Weller, 1977:507).
Other writers writing on developed countries, such as Mincer(1962 ) , Sweet(1973) and Bowen and Finegan(1969), using data for U.S.A, and Dar1ing(1975) using data for Australia, Canada, Finland, Japan and Sweden, have also stressed this point, saying that not only is the participation of women affected by the presence of children but the age and number of children also has an effect on women's participation. A women with children of pre-school age will be more affected than a mother with grown-up children (Mincer,1962; Sweet,1973; Darling,1975; Bowen and Finegan,1969).
Standing (1977) stated that the effect of children on women's work depends on the type of work in question. A job which allows the mother to take care of her children and at the same time be able to work, or which has flexible working hours, removes the negative effect of fertility on female labour force participation. The availability of the extended family or cheap nursemaids who can take care of the children, also enables women to participate. On the other hand, if the nature of work is incompatible with child care, fertility could have a negative
impact on female participation rates (Standing, 1977:169).
In the underdeveloped countries of Africa the probability of an inverse relationship is low. An inverse relationship between fertility and female labour force participation is expected if the women are working away from home in paid jobs, or if the women have white collar occupations. These are characteristics of jobs in the modern sector which are usually concentrated in urban areas rather than in rural areas (Weiler,1977:499).
In Khartoum, the capital of Sudan, the presence of children under the age of fourteen has a negative impact on female labour force participation. The decline in participation increases with each additional child. However, the decrease is much lower for women with one child (Sheehan, 1978:1650).
In the case of Ghanaian women, there was a positive relationship between fertility and participation rates. In fact, the larger the number of children, the more mouths to feed, the higher the level of participation of women (Johnson, 1978:128). In Nigeria, as in Ghana, work is often compatible with child care, and thus we see a positive relationship between fertility and female labour force participation rates. The number of children increases the economic need for supporting them, and thus motivates women to work (Standing and Sheehan, 1978:129). Another factor which explains the positive relationship of fertility and female labour force participation in urban Nigeria is the availability of the extended family to take care of the children when a woman goes out to work (Lucas, 1977:34).
Brindary (cited in Weller, 1977:498), using areal data, showed that a positive relationship existed between fertility and female participation rates in rural Egypt. Anker and Knowles tried to show empirically that child care does not have any effect on the rural
labour force in Kenya. They showed that female labour force is more affected by farm ownership and the absence of the husband (Anker and Knowles, 1983:204).
Table 4-4: FEMALE LABOUR FORCE PARTICIPATION RATES* BY NUMBER OF CHILDREN UNDER 5 YEARS IN THE
HOUSEHOLD, 1981/82
AGE NUMBER OF CHILDREN
0 1-2 3 +
15-19 35.7 38.8 35.8
(1915) (2244) (461)
20-29 49.7 54.5 47.9
(781) (2476) (478)
30-39 53.3 53.0 48.9
(745) (1925) (528)
40-49 47.3 50.0 53.8
(1014) (854) (156)
50-59 46.0 43.6 41.4
(916) (362) (52)
60 + 31.9 15.2 13.3
(1018) (524) (109)
15 + 43.8 49.0 45.4
(6250) (8504) (1807)
Note:- 1)*= Computed using the usually active population. Source:- Same as Table 4-1.
[image:52.550.24.472.62.487.2]of the extended family to take care of the children. This result confirms what Durand said about the central peak pattern, which is discussed earlier in the thesis (Durand,1975:42).
MIGRATION
According to Standing the economic motive is the major factor in female migration (Standing, 1978:212). Employment opportunities or wage differentials which are perceived or actual between areas play an important role in migration. However Thadani and Todaro, (1979:17) stated marriage also plays an important role in female migration. Ware (1981:142), condemning the the neglect of marital migration in the literature on migration, also stated that in many areas women move with their husbands when they get married and this marital migration actually constitutes the majority of all migratory moves.
The relationship between migration and labour force participation can be positive or negative, depending on different situations. All other things being equal, for example, female migrants may have higher participation rates because usually migrants are achievement-oriented groups (Anker and Knowles,. 1983:191). On the other hand, migrants could have lower participation rates because they do not have the strong contacts which the non-migrants have. This could make it difficult for them to find jobs easily and in the long term could lead them out of the labour force. However, this negative relationship may not be evident in the rural areas because migrants could have farm ownership in the area where they migrate (Anker and Knowles,1983:191).