Int. J. Electrochem. Sci., 9 (2014) 6201 - 6212
International Journal of
ELECTROCHEMICAL
SCIENCE
www.electrochemsci.org
A Penicillin Biosensor by Using Silver Nanoparticles
Parisa Sistani1, Leila Sofimaryo2, Zahra Rakhshan Masoudi2, Arezou Sayad3, Roya Rahimzadeh2, Bahareh Salehi4 ,*
1
Department of Biology, Faculty of natural science, University of Tabriz, Tabriz, Iran 2
Department of Biology, Payame Noor University, IR. Of IRAN 3
Department of Medical Genetics, Shahid Beheshti University of Medical Sciences, Tehran 1985717443, Iran
4
Young Researchers and Elites Club, North Tehran Branch of Islamic Azad University, Tehran, Iran *
E-mail: [email protected]
Received: 19 July 2014 / Accepted: 21 August 2014 / Published: 25 August 2014
Based enzymatic biosensor for selective detect of penicillin by using silver nanoparticles designed. Convergence of bioelectrochemistry and nanotechnology improved duty of novel biosensors. Here silver nanoparticles used to facilitate electron exchange between biosensor elements and investigated with XRD, TEM and size distribution techniques and the mean size of the silver nanoparticles was around 90 ± 10 nm. Main equation for this research was: Penicillin + H2O = penicilloate−+ H1+. The electrochemical evaluations applying the potentiometric method were carried out for different penicillin G salt concentrations varying from 100 μM to 100 mM made in a buffer solution at pH 7.4. The tested sensor configuration showed a wide linear dynamic range for the output response vs. the logarithmic concentration of penicillin G salt solution. To investigate the reproducibility of the given sensor, we examined the potentiometric reply of all five sensor electrodes in 5, 10, 20 and 30 mM penicillin solutions also the relative standard deviation was detected to be less than 4%.
Keywords: Biosensor, Penicillin, Silver nanoparticles, Electrochemistry
1. INTRODUCTION
2. EXPERIMENTAL SECTION
2.1. Materials
The penicillinase enzyme with given activity 1,500–3,000 U/mg-protein from Bacillus cereus, penicillin G sodium salt, sodium hydrogen phosphate (Na2HPO4), potassium dihydrogen phosphate (KH2PO4), sodium chloride (NaCl), potassium chloride (KCl), sodium hydroxide (NaOH) and hydrochloric acid (HCl) were purchased from (Sigma Aldrich). Silver nitrate (AgNO3), Hydrazine hydrate, Citrate of sodium and Sodium Dodecyl Sulphate (SDS) were purchased from Merck. The N-5-azido-2-nitrobenzoyloxysuccinimide (ANB-NOS) cross linking chemical was purchased from (Pierce). All other chemicals were of analytical grade.
2.2. Apparatus
All the electrochemical experiments were carried out using potentiostat PGSTAT 30 model from Autolab (Ecochemie, Netherlands), interfaced with a private computer. All the potentials were described regarding to an Ag/AgCl reference electrode. The morphology of the produced particles was done on a JEOL JEM-1200 EXII transmission electron microscope operating at accelerating voltages of 120 kV. The XRD experiments were carried out on a SIEMENS D500 diffractometer equipped with Cu Kα R radiation (λ = 1.5406 A). The electrochemical cell was a three-electrode system consisting of a glassy carbon working electrode (diameter of 3 mm), a platinum counter electrode, and an Ag/AgCl (3MNaCl) reference electrode. All pH measurements were done on a Jenco digital pH meter. Also, the experiments were carried out inside a Faraday cage at room temperature (ca. 25 ◦C).
2.3. Preparation of silver nanoparticles
2.4. Immobilization of the Enzyme
sensor electrodes were prepared after the immobilization of enzyme penicillinase on to the surface of grown silver nanoparticles in combination with (ANB-NOS) as a cross linker. The process of immobilization followed two steps; first a 10 mM (ANB-NOS) solution was prepared in phosphate buffer at pH 7.4, then silver nanoparticles electrode was hatched in this solution for one hour, after that sensor electrode was washed with de-ionize water to remove the solid residue particles, then in second step, this electrode was put into the enzyme penicillinase solution for 20 min. The penicillinase enzyme solution was developed in same phosphate buffer at pH 7.4 additionally concentration of enzyme was 5 mg/mL.Then immobilized sensor electrode was kept at 4 °C temperature for about 16 hours. All immobilized sensor electrodes were kept at 4 °C temperature when not in use.
2.5. Preparation of Sensor Working Electrode
The most commonly used carbon-based electrode in the analytical laboratory is glassy carbon (GC). It is made by pyrolyzing a carbon polymer, under carefully controlled conditions, to a high temperature like 2000 oC. An intertwining ribbon-like substance effects with retention of high conductivity, firmness and inertness. The electrochemistry is influenced extensively by its surface chemistry of carbon-oxygen functionalities and its cleanliness; i.e., lack of adsorbed imperfections. Polishing on smooth ground glass plates enable the circumstance of the polishing substance to be rigidly managed for optimum cleanliness. In addition, the use of deagglomerated alumina of small particle size (0.05 μm) allows for a more scratch free active electrode surface. The use of particles of even smaller size (0.007 μm fumed silica) should improve the facility also behavior. If this does not activate the surface, re-polishing with larger particle size abrasive, such as 0.25: m diamond ensued by 0.05: m alumina or 0.007: m silica. The degree of activation of a GC disk electrode can be evaluated by looking at the diversity in the peak potential for the redox couple of ferri/Ferrocyanide, which is expected to be close to 60 mV. First, use slurry of the 0.05 μm alumina to polish the electrode. Polish with light pressure for nearly 30 seconds. The electrode should next be instantly rinsed with water. GC electrodes can maintain much of their behavior by saving them in a solution of alumina or silica. To act this, add 6 or 7 scoops of both alumina and silica to about 25 ml of deionized water additionally shake the solution with the electrode in it. Basically, the electrode is being continuously polished. When you are ready to use the electrode again, rinse it with a stream of pure deionized water and it is ready to go.
3. RESULTS AND DISCUSSION
3.1. Transmission electron microscopy investigation
[image:5.596.179.416.173.359.2]
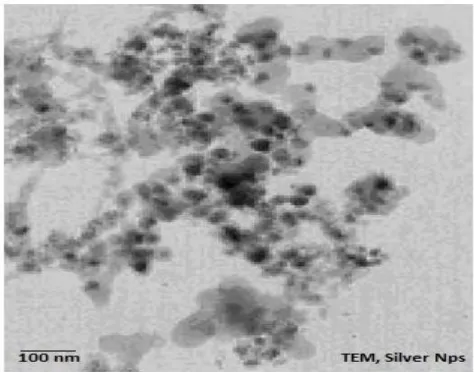
structure, symmetry, orientation and crystalline defects. These features have led the TEM nowadays be a very important tool in many advanced research in physics, chemistry, crystallography, materials science and biology. In this research the morphology of the well aligned and vertically oriented increased silver nanoparticles was analyzed by Transmission electron microscopy (TEM) as demonstrated in Figure 1; for this assays the scales bare was 100 nm.
Figure 1. Transmission electron microscopy investigation of silver nanoparticles; scale bare was 100 nm.
3.2. X-ray diffraction (XRD) investigation
[image:5.596.132.457.465.702.2]
The powder XRD pattern of the silver nanoparticle is shown in Figure 2. Here, the three peaks can be seen at 2θ= 38.2,44.3 and 64.5o, which are characteristic diffraction peaks of metallic silver. These peaks dispatch to the three d-spacing (111), (200), additionally (220), respectively. Crystallite size (D) is measured from Scherrer’s equation D = Kγ/(βcosθ), for peak expanding from size results only. According to the equation of Scherrer’s equation, the mean diameter of silver nanoparticles arranged was about 90nm.
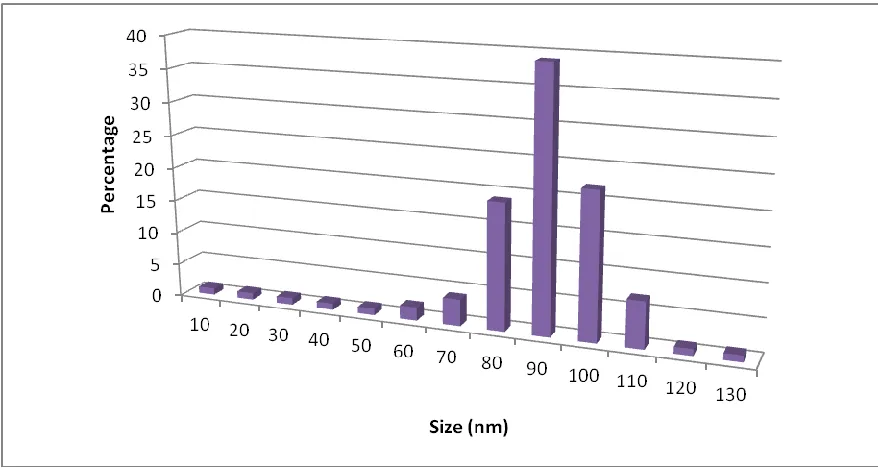
[image:6.596.78.517.239.474.2]A particle size analyzer was applied to determine the area of sizes of the silver nanoparticles. Figure 3 demonstrates the size dispersion of one of the arranged silver nanoparticles. The mean size of the silver nanoparticles was around 90 ± 10 nm.
Figure 3. Size distribution of silver nanoparticles
3.3. Bioelectrochemical studies
The electrochemical cell voltagei.e., the potential difference between the sensor electrode and the reference electrode (Ag/AgCl), changes with the variation in the composition of the penicillin test electrolyte solution. These conversions in the approaching potential were applied to the concentration of the penicillin in the test electrolyte solutions and the reply of penicillinase enzyme. The electrochemical answer of the penicillin biosensor depends on the measure of the catalytic activity of the penicillinase enzyme to penicillin. The hydrolysis reply of penicillin G salt in existence of penicillinase enzyme is represented in the following equation:
Penicillin + H2O = penicilloate−+ H1+
[image:7.596.96.502.249.469.2]
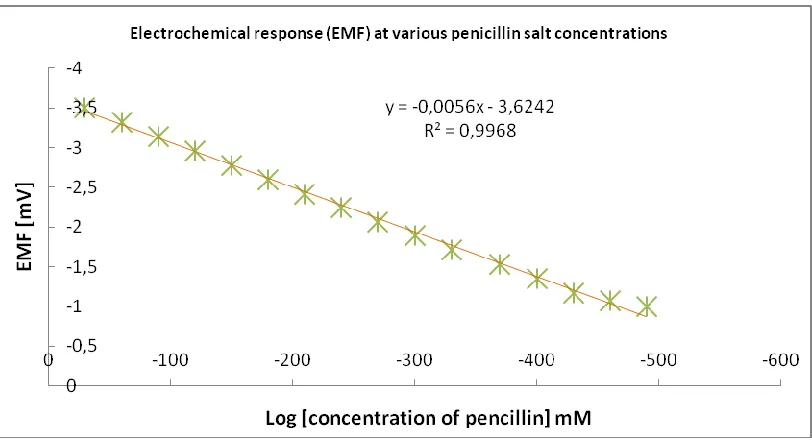
As an effect of atop reaction, hydrogen ions (H1+) are created and can be applied to detect the penicillin concentration [19]. Because of the generation of (H1+) ions in the reaction, the pH of the solution also depletes. As the number of charges created around the silver nanoparticles based sensor electrode conversions, an alteration into the electrode potential was viewed [20]. The electrochemical evaluations applying the potentiometric method were carried out for different penicillin G salt concentrations varying from 100 μM to 100 mM made in a buffer solution at pH 7.4. The tested sensor configuration showed a wide linear dynamic range for the output response (EMF) vs. the logarithmic concentration of penicillin G salt solution as demonstrated in Figure 4. We acquired a slope of 135 mV/decade, which is a display of high specificity for the evaluation of penicillin.
Figure 4. Calibration curve of the immobilized silver nanoparticles based sensor electrode showing the electrochemical response (EMF) at various penicillin salt concentrations (100 μM to 100 mM) with Ag/AgCl reference
3.4. Performance evaluation of the sensor
-400
-350
-300
-250
-200
-150
-100
-50
0
0 1 2 3 4 5 6
V
o
lt
a
g
e
(
m
V
)
Number of Electrode Performance Evaluation of the Sensor
5 m M , V= -350 m V
10 m M , V= -275 m V
20 m M , V= -200 m V
[image:8.596.63.534.79.362.2]30 m M , V= -125 m V
Figure 5. Performance Evaluation of the Sensor for Selective Detect of Penicillin by using of Silver nanoparticles
[image:8.596.57.538.430.698.2]
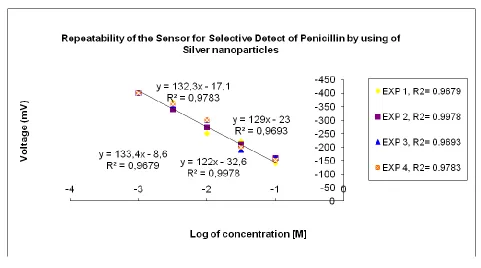
In addition, the repeatability of the displayed sensor was also evaluated by acting four analyses with the equal sensor electrode for four sequential days, and following each calculation the electrode was soaked in a phosphate buffer solution (PBS) and later that it was dehydrated and saved at 4 °C. The sensor has demonstrated an excellent repeatability action as exhibited in Figure 6.
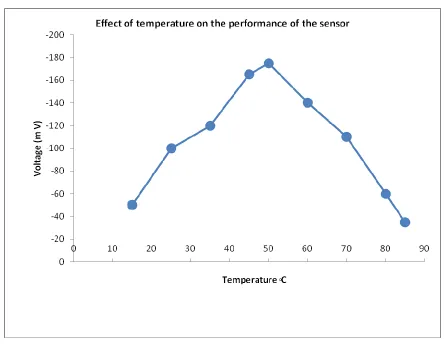
[image:9.596.76.520.311.655.2]The effect of temperature on the performance of the sensor response was also studied by varying the temperature from 15 °C to 85 °C. The results are shown in Figure 7. During the experiments, a trend of gradual increase in the EMF answer of sensor electrode with increasing temperature was viewed, and it reached its maximum amount at around 50 °C. This is due to the reality that the enzyme has its maximum behavior at 50 °C and above 50 °C there was a sudden decrease in the EMF reply of the sensor due to the heating outcome on the immobilized enzyme, which degraded the enzyme functionality. However, the sensor demonstrated maximum reply at 50 °C but it was not as stable as at room temperature. Hence, we have elected to act at room temperature 25 ± 2 °C for the ease of exercised calculations furthermore also to avoid evaporation of the solution.
Figure 7. Effect of temperature on the performance of the sensor response
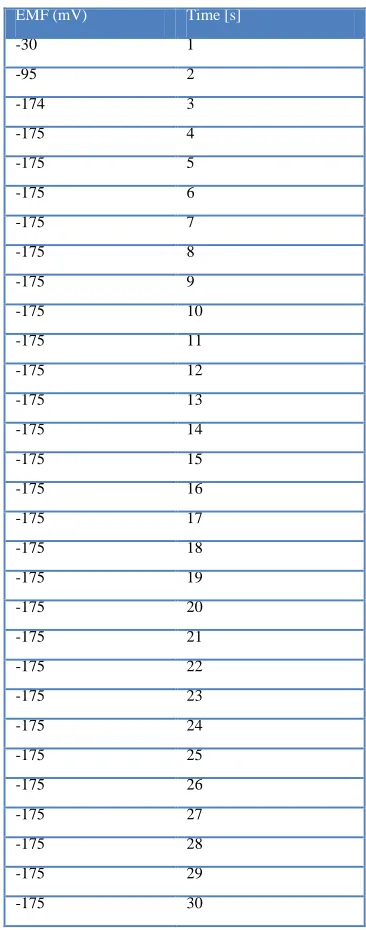
interfering ions. The enzyme penicillinase has adequate selectivity [21-26]. For penicillin, the enzyme-analyte reaction is highly characteristic also created the charged ions which were selectively evaluated by our proposed sensor. The penicillinase is very particular in reaction with penicillin, even in presence of other interfering species. We detected no definitive antagonist of sensor with Na1+, K1+, d-glucose, ascorbic acid, uric acid, urea, sucrose, lactose, glycine, penicilloic acid and cephalosporins. In Figure 8, it can be observed that on combining entire above interfering elements (100 μM of each) into 1 mM of our penicillin electrolyte solution, no conversions on the output signal stability or magnitude was viewed. Furthermore, the sensor additionally demonstrated a very fast response time of less than 4 second when the signal reached its steady state stable value.
Table 1. The time response curve of the proposed sensor in a 1,000 μM penicillin electrolytic test
solution in presence of interfering species
EMF (mV) Time [s]
-30 1
-95 2
-174 3
-175 4
-175 5
-175 6
-175 7
-175 8
-175 9
-175 10
-175 11
-175 12
-175 13
-175 14
-175 15
-175 16
-175 17
-175 18
-175 19
-175 20
-175 21
-175 22
-175 23
-175 24
-175 25
-175 26
-175 27
-175 28
-175 29
[image:10.596.206.389.289.754.2][image:11.596.207.389.210.543.2]
The storage firmness of the offered sensor has been assayed with a categories of analyses acted frequently for more than four weeks and the sensor electrodes were conserved at 4 °C when not in function. It has been viewed that the sensor held their enzymatic activity up to 94% of their beginning behaviors demonstrating good storage skill and reusability for a long period of time as observed in Table 2.
Table 2. Calibration curve showing the study of the electromotive (EMF) response with the influence of storage at 4 °C for three weeks
EMF (mV) Number of days
-175 1
-174.5 2
-174 3
-173.5 4
-173 5
-172.5 6
-172 7
-171.5 8
-171 9
-170.5 10
-170 11
-169.5 12
-169 13
-168.5 14
-168 15
-167.5 16
-167 17
-166.5 18
-166 19
-165.5 20
-165 21
4. CONCLUSION
penicillinase is very particular in reaction with penicillin, even in presence of other interfering species. We detected no definitive antagonist of sensor with Na1+, K1+, d-glucose, ascorbic acid, uric acid, urea, sucrose, lactose, glycine, penicilloic acid and cephalosporins.
References
1. Y.G. Guo, J.S. Hu, L.J. Wan, Adv. Mater., 20 (2008) 2878
2. T.Y. Wei, C.H. Chen, H.C. Chien, S.Y. Lu, C.C. Hu, Adv. Mater., 21 (2009) 1 3. B. Liu, H. Shioyama, H.L. Jiang, X.B. Zhang, Q. Xu, Carbon, 48 (2010) 456 4. H. Jiang, T. Zhao, C.Y. Yan, J. Ma, C.Z. Li, Nanoscale, 2 (2010) 2195
5. D.C. Wang, W.B. Ni, H. Pang, Q.Y. Lu, Z.J. Huang, J.W. Zhao, Electrochim. Acta ,55 (2010) 6830 6. B. Nowack, Science, 330 (2010) 1054–1055
7. S. A. Blaser, M. Scheringer, M. MacLeod and K. Hungerbühler, Sci. Total Environ.,390 (2008) 396–409
8. S. Chernousova and M. Epple, Angew. Chem. Int. Ed., 52 (2013) 1636–1653 9. V.P. Yakovlev, S.V. Yakovlev, Litterra: Moscow, Russia, 2007.
10.J. Liu and R. H. Hurt, Environ. Sci. Technol., 44 (2010) 2169–2175 11.D. J. You, T. S. Park and J. Y. Yoon, Biosens.Bioelectron., 40 (2013) 180.
12.Y. Zhou, X. Xia, Y. Xu, W. Ke, W. Yang and Q. Li, Anal. Chim.Acta, 722 (2012) 95. 13.A. Errachid, N. Zine, J. Samitier, J. Bausells, Electroanalysis,16 (2004) 1843.
14.B. Eggins, Chemical Sensors and Biosensors in Analytical Techniques in the Sciences; Wiley: West Sussex, UK, 2002.
15.M.J. Schoning, A. Poghossian, Analyst, 27(2002)1137.
16.K. Ito, M. Takahashi, T. Yoshimoto, D. Tsuru, J. Bacteriol., 176 (1994) 2483. 17.M.J. Lobo, A.J. Miranda, P. Tuñón, Electroanalysis, 9 (1997) 191.
18.S. Ogushi, M. Ando, D. Tsuru, J. Biochem., 96 (1984) 1587.
19.Y. Murakami, R. Hoshi, A. Hirata, J. Mol. Catal. B: Enzym., 22 (2003) 79. 20.F. Mizutani, S. Yabuki, T. Katsura, Anal. Chim.Acta, 274 (1993) 201. 21.E. Leszczynaska, R. Koncki, S. Glab, Chem. Anal. , 41(1996) 839.
22.E. Akyilmaz, O. Kozgus, H. Türkmen, B. Cetinkaya, Bioelectrochemistry, 78 (2010) 135. 23.A. Lahiji, A. Sohrabi, D.S. Hungerford, C.G. Frondoza, J. Biomed. Mater. Res., 51 (2000) 586–
595.
24.X. He, R. Yuan, Y. Chai, Y. Shi, J. Biochem. Biophys. Methods, 70 (2007) 823–829. 25.E. Khor, Curr. Opin. Solid State Mater. Sci., 6 (2002) 313–317.
26.M. Rinaudo, Polym. Int., 57 (2008) 397–430.