Int. J. Electrochem. Sci., 9 (2014) 6558 - 6571
International Journal of
ELECTROCHEMICAL
SCIENCE
www.electrochemsci.org
Characterization of Corrosion Process of Q235 Carbon Steel in
Simulated Concrete Pore Solution by EIS and EN Techniques
Xuehui Wang1,2, Jihui WANG1,2,*, Xin Yue2
1
State Key Laboratory of Hyraulic Engineering Simulation and Safety, Tianjin University, Tianjin 300072, P R China
2
Tianjin Key Laboratory of Composite and Functional Materials,School of Materials Science and Engineering, Tianjin University, Tianjin 300072, P R China
*
E-mail: [email protected]
Received: 13 June 2014 / Accepted: 18 July 2014 / Published: 25 August 2014
The corrosion behavior of Q235 carbon steel in simulated concrete pore solution was investigated by electrochemical impedance spectroscopy (EIS) and electrochemical noise (EN) techniques. The equivalent circuit, statistical analysis, wavelet transform, chaos theory and cluster analysis method were employed to research the EIS and EN data of Q235 carbon steel in simulated concrete pores solution. The results showed that at the initial immersion, Q235 steel had higher charge transfer resistance, film resistance, noise resistance and fractal dimension, but lower standard deviation σI,
average charge q and correlation dimension. When the immersion time was larger than 48 hours, the charge transfer resistance, film resistance, noise resistance and fractal dimension of Q235 steel decreased greatly, but the standard deviation σI, average charge q and correlation dimension of Q235
steel increased abruptly. Two distinct stages, i.e. passive state (Cluster 1) and initiation and development of pitting corrosion (Cluster 2), could be classified for Q235 carbon steel in simulated concrete pore solution.
Keywords: Q235 carbon steel; concrete pores solution; electrochemical impedance spectroscopy (EIS); electrochemical noise (EN) techniques
1. INTRODUCTION
structures were performed in the seawater environment, chloride ions in the seawater could penetrate into the reinforcement and make the pH value around the steel bar reduced to a lower value. The protective film on steel surface could be destroyed and the reinforcing steel would be repassivated [1]. As a result, the reinforced concrete structures would be deteriorated, and the premature failure would occur.
In recent years, many methods have been used to explore the corrosion behavior of Q235 carbon steel in solutions simulating concrete pores [2-5]. Dawson [6] firstly investigated the corrosion behavior of reinforced concrete by electrochemical impedance microscopy (EIS) method, and found that the corrosion behavior of reinforced concrete was highly related to the surface film on the steel. Sanchez [3] proved that the spontaneous growth of passive layers upon steel rebar in alkaline media was associated with the enrichment of Fe (III)-oxides. Hu [7] reported that the charger transfer resistance Rt
was decreased after immersion in sodium chloride solution and the active corrosion occurred on the rebar. Qiao [1] found that the capacitive arcs in high frequency and medium frequency regions in the EIS spectrum were responsible for the cement mortar and double layer respectively, and the corrosion process was controlled by the diffusion of oxygen in low frequency region. However, the corrosion process of rebar could not be monitored simultaneously by EIS method.
Electrochemical noise (EN) method is an in situ electrochemical technique, which generates spontaneously by corrosion processes and does not disturb the corrosion system. So EN measurement is becoming one of the most promising methods for detecting corrosion process and exploring the corrosion mechanism. Legat [5] indicated by EN test that the process of corrosion initiation was consisted of a sequence of several events, and metastable pitting happened on the rebar without stable pitting. During the wetting and drying of concrete, the distribution of anodic and cathodic sites could change alternately. By analyzing the EN data with discrete wavelet method, Hu [8] provided a criterion to determine the threshold value controlling the evolution of corrosion state of steel in concrete. By wavelet analysis, Zhao [9] found that during the 20 cyclic immersion and drying tests there were three different corrosion stages of reinforcing steel in cement mortar, including a competition process between breakdown and repassivation of passive film, pitting development and active corrosion.
Apart from statistical and wavelet transform analysis, fractal, phase space reconstruction theory and cluster analysis method could also be applied to resolve the EN data [10-13]. But until now, there was no information about these methods used to analyze the EN data in reinforcement corrosion. The projective of this paper is to determine the corrosion process of Q235 steel bar in simulated concrete pore solution by using EIS and EN techniques. The corrosion parameters of charge transfer resistance, noise resistance, crystal energy, fractal dimension, correlation dimension were calculated to characterize the corrosion process of reinforcing steel.
2. EXPERIMENTAL
2.1 Material and test solution
a copper wire at one end to provide electrical contact, and then embedded in epoxy resin. The exposed surface of specimen was abraded with silicon carbide paper (from 240# to 1000#), and then degreased by acetone, washed by distilled water and dried by hot air.
Table 1. Chemical composition of Q235 carbon steel (wt%)
C Si Mn P S Fe
0.14-0.22 0.12-0.30 0.30-0.65 0.045 0.050 balance
The simulated concrete pore solution was prepared as follows: firstly 100 grams Portland cement (Brand PS32.5) was added to 1000 ml distilled water, and then the solution was continuously stirred for 10 minutes in order to dissolve all the alkaline substances. After keeping still for 5 min, the obtained solution with the pH value of 13.5 was subsequently filtrated with a vacuum pump. The test solution was composed by this filtrated solution and 0.3 mol/L NaCl solution in a ratio of 1:1 [14].
2.2 Immersion test
The test samples with an exposed area 49.6 mm2 were immersed in the above simulated concrete pore solution at room temperature. After different immersion periods, the surface morphology of corroded samples was observed by Olympus GX51 optical microscope.
2.3 EIS measurement
The electrochemical impedance spectroscopy tests of Q235 steel in simulated concrete pore solution were carried out at room temperature under different immersion time by using a PARSTAT 2273 electrochemical workstation (Princeton Applied research, USA) and Powersuite software. Two identical Q235 steel with an exposed area 49.6 mm2 were used as working electrode and counter electrode, and a saturated calomel electrode (SCE) was as reference electrode. The measurements were taken at open circuit potential with a 10 mV amplitude signal and the applied frequency ranged from 10 kHz to 0.01 Hz. After tests, the results obtained were typically fitted to an equivalent circuit by applying ZsimpWin software, and the corresponding electrochemical parameters were calculated.
2.4 EN measurement and analysis
Statistical analysis: After EN test, a 5-order polynomial fitting was applied to remove the direct current component from original EN data. The standard deviation of electrochemical potential noise σV and electrochemical current noise σI were calculated. The noise resistant Rn and average
charge q in each event was obtained by equation Rn=σV/σI and q=(σV*σI)/(B*b), where B is the
Stern-Geary coefficient, b is the bandwidth of the measurement.
Wavelet analysis: The electrochemical noise signal of Q235 steel in simulated concrete pore solution was decomposed to seven levels (d1-d7, and s7) by using the wavelet transform technique based on orthogonal db2 wavelet. And the fraction of energy associated with each detail crystal d
j E
was calculated as follows:
(j=1, 2, …, 7)
Where d was the detail crystal and N was the total number of data points for each recording run. E was the total energy, which equaled to the sum of seven detailed crystals (d1-d7), discounting the contribution of s7 crystal:
For orthonormal discrete wavelet decomposition, the following power law of was obeyed, in which was the variance of detail crystal dj. After calculating, the following equation
could be obtained:
(j=1, 2…..7)
The slope β was obtained from the plot versus level j: . Finally, the fractal dimension Dfd was obtained by Dfd=2.5-0.5.
Chaos analysis: According to phase space construction theory, the electrochemical noise data were reconstructed into m-dimension state vector with time delay and embedding dimension m by mutual information method and Cao’s method. The correlation function C(r) (probability of the endpoint distance between two vectors less than r) was calculated, and then the plot of lnC(r) vs. ln(r) was obtained. The correlation dimension Dcd was determined by the slope of plot with linear squares
regression techniques. The details of chaos analysis procedure can be found in Ref. 10.
Cluster analysis: The potential and current signal of each EN data during different immersion time were selected as the variables of cluster analysis, the optimum cluster number (k) was set as 2, i.e. Cluster 1 corresponds to the passive state and Cluster 2 to the stable pitting state. The k-means cluster analysis method was applied, in which the squared Euclidean distance was taken as the similarity measurement and the Ward’s method as amalgamation rule. The details of cluster analysis procedure can be found in Ref. 11[11].
3. RESULTS AND DISCUSSION
3.1 Surface morphology
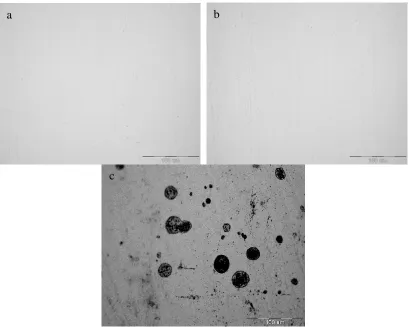
surface (Fig. 1a). After immersion in concrete pore solution, no obvious surface change was observed on Q235 steel when the immersion time was less than 47 hours (Fig. 1b). But when the immersion time was larger than 48 hours, there were many corrosion pits with different size on the steel surface (Fig. 1c). These observations indicated that Q235 steel in concrete pore solution was in the passive state with the immersion time less than 47 hours, and changed into pitting corrosion stage with the immersion time larger than 48 hours.
Figure 1. Surface morphology of Q235 steel before and after immersion in simulated concrete pore solution (a) before immersion, (b) after immersion of 47.0 hours, (c) after immersion of 53.5 hours ×500
3.2 EIS spectrum
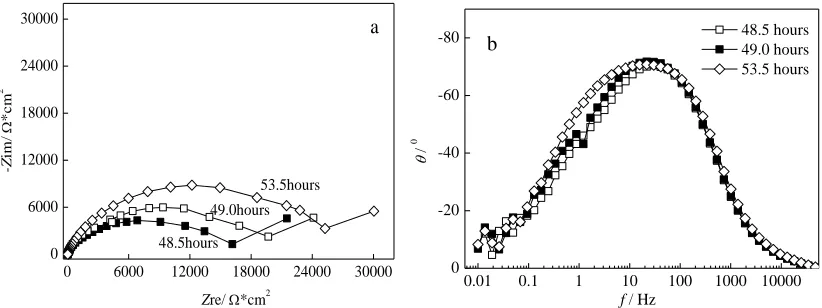
Fig. 2 and Fig. 3 are the electrochemical impedance spectrum of Q235 carbon steel in simulated concrete pore solution. During the immersion time in 3.5- 47 hours, there were two capacitance loops in Nyquist plot, and the diameter of capacitance loop increased with the immersion time from 3.5 to 47 hours (Fig. 2a). The two capacitance impedances should be associated to the passive film surface and steel rebar surface respectively. With the immersion time larger than 48 hours, EIS spectrum of Q235 steel consisted of two capacitance loops in high frequency range and a straight line in low frequency range, the diameter of capacitance loop increased with the immersion time (Fig. 3a). However, the diameter of capacitance loop with the immersion time larger than 48 hours was
c
[image:5.596.95.504.187.514.2]
almost two orders lower than that with immersion time less than 47 hours [7, 16]. This indicated that pitting corrosion was occurred.
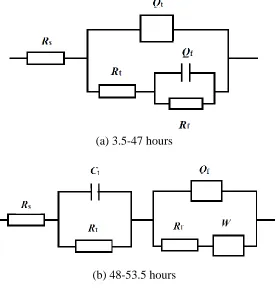
By considering the above characteristics of EIS spectrum, the electrochemical equivalent circuits in Fig. 4 were used to correspond to Fig. 2 and Fig. 3, in which Rs is the solution resistance, Rt
is the charge transfer resistance between steel rebar and concrete pore solution, Qt (or Ct) is the
constant phase element (or capacitance) between steel bar and concrete pore solution, Rf is the passive
film resistance, Qf is the capacitance between passive film and concrete pore solution, W is the
Warburg resistance indicating the diffusion process across the corrosion pit [7]. The fitting parameters were calculated and listed in Table 2 and Table 3.
0.0 3.0x10⁵
6.0x10⁵ 9.0x10⁵ 1.2x10⁶ 1.5x10⁶ 0.0 3.0x10⁵ 6.0x10⁵ 9.0x10⁵ 1.2x10⁶ 1.5x10⁶ 47.0 hours 22.0 hours 6.0 hours -Z im / * c m 2
Zre /*cm2 3.5 hours
a
0.01 0.1 1 10 100 1000 10000
0 -20 -40 -60 -80
f / Hz
3.5 hours 6.0 hours 22.0 hours 47.0 hours
[image:6.596.91.510.256.425.2]b
Figure 2. EIS spectrum of Q235 steel in simulated concrete pore solution with the immersion time less than 47 hours, (a) Nyquist plot and (b) Bode plot
0 6000 12000 18000 24000 30000
0 6000 12000 18000 24000 30000 53.5hours 49.0hours -Z im / * c m 2
Zre/ *cm2 48.5hours
a
0.01 0.1 1 10 100 1000 10000
0 -20 -40 -60 -80 / 0
f / Hz
48.5 hours 49.0 hours 53.5 hours
b
Figure 3. EIS spectrum of Q235 steel in simulated concrete pore solution with the immersion time larger than 47 hours,(a) Nyquist plot and (b) Bode plot
It can be seen that during the immersion in 3.5-47 hours the charge transfer resistance Rt was
located between 2786~5310Ωcm2, but the passive film resistance Rf increased from 5.45×10⁵ to
[image:6.596.95.506.493.647.2]
simulated concrete pore solution was in the passive state, and the corrosion resistance of steel increased with the immersion time. After the immersion time larger than 48 hours, the charge transfer resistance Rt and passive film resistance Rf decreased to 398~1131Ωcm2 and 6165~11970 Ωcm2
respectivley (Table 3), which were obviously lower than that with the immersion time less than 47 hours. Meanwhile, there was a Warburg resistance W occurred in the EIS spectrum. These observations proved that the passive film on Q235 steel started to be destroyed because of the penetration and diffusion of Cl- ions in the passive film [17], and then the corrosion pits were initiated and developed gradually.
(a) 3.5-47 hours
(b) 48-53.5 hours
Figure 4. Equivalent circuit diagram of Q235 steel in simulated concrete pore solution with the immersion time (a) less than 47 hours and (b) larger than 48 hours
Table 2. EIS fitting results of Q235 carbon steel in simulated concrete pore solutions with the immersion time less than 47hours
t/h Rs
/Ω∙cm2 Rt
/Ω∙cm2
Qt
/Ω-1∙cm-2∙s-1
nt Rf /Ω∙cm 2
Qf
/ Ω-1∙cm-2∙s-1
nf Chisq
3.5 17.63 3387 1.4810-5 0.94 5.455105 2.65010-6 0.9 5.1310-3
6.0 18.01 4126 1.48710-5 0.95 6.614105 1.41910-6 1 6.7510-3
22.0 19.30 2786 1.19910-5 0.97 1.561106 1.85210-6 1 8.5510-3
23.5 19.00 5017 1.34010-5 0.96 1.56106 1.34210-6 1 6.9410-3
28.0 18.78 7929 1.42210-5 0.95 1.412106 7.82510-7 1 8.7810-3
29.5 19.83 5180 1.30110-5 0.95 1.631106 1.91810-6 0.94 8.1710-3
[image:7.596.164.440.230.520.2] [image:7.596.53.545.635.772.2]
Table 3. EIS fitting results of Q235 carbon steel in simulated concrete pore solutions with the immersion time larger than 47 hours
t/h Rs
/Ω∙cm2 Rt
/Ω∙cm2 Ct
/F*cm-2
Rf
/Ω∙cm2 Qf
/Ω-1∙cm-2∙s-1
n W
/Ω∙cm2∙s-1/2 Chisp
48.5 19.36 710 6.24510-5 6165 1.010-4 0.8 1.6×10⁻³ 6.83×10⁻³ 49.0 19.06 1131 6.19710-5 8390 1.010-4 0.8 2.5×10⁻³ 3.75×10⁻³ 53.5 18.87 398 14.5010-5 11970 6.010-5 0.8 1.8×10⁻³ 1.90×10⁻³
3.3 EN analysis
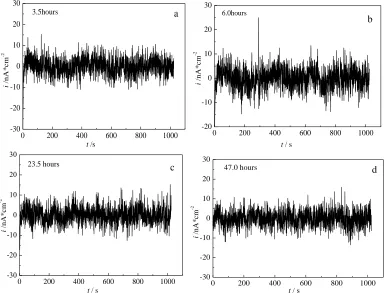
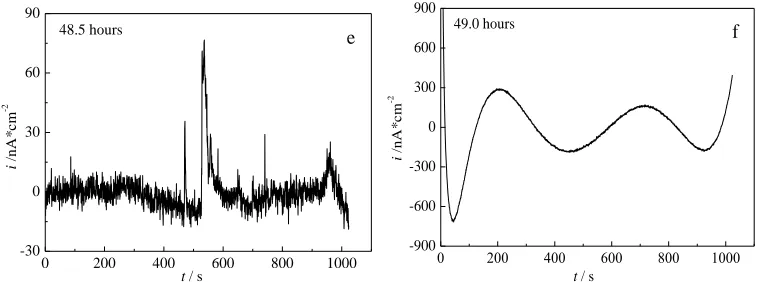
[image:8.596.54.543.112.190.2]The electrochemical current noise of Q235 steel in simulated concrete pore solution is shown in Fig. 5. During the immersion time less than 47 hours, the current fluctuations were in high frequency with the amplitude less than 15 nAcm-2, and large isolated transients were hardly observed (Fig. 5a-5d), which indicating that Q235 steel was undergoing a passive state with a lower corrosion rate. For the immersion time larger than 48 hours, larger transients with larger amplitude (80 nAcm-2 in Fig. 5e or 1500 nAcm-2 in Fig. 5f) and low frequency were observed in the current fluctuations, which indicated that pitting corrosion with higher corrosion rate occurred on the surface of Q235 steel. These results accord with the surface morphology of Q235 steel in Fig. 1.
0 200 400 600 800 1000
-30 -20 -10 0 10 20 30 i / n A * cm -2
t /s
3.5hours a
0 200 400 600 800 1000
-20 -10 0 10 20 30 i / n A * cm -2
t / s 6.0hours
b
0 200 400 600 800 1000
-30 -20 -10 0 10 20 30 i / n A * cm -2
t / s 23.5 hours
c
0 200 400 600 800 1000
-30 -20 -10 0 10 20 30 i / n A *cm -2
t / s
[image:8.596.108.493.410.703.2]
0 200 400 600 800 1000
-30 0 30 60 90 i / n A * cm -2
t / s 48.5 hours
e
0 200 400 600 800 1000 -900 -600 -300 0 300 600 900 i / n A * cm -2
t / s
[image:9.596.110.489.72.213.2]49.0 hours f
Figure 5. Electrochemical current noise of Q235 steel in simulated concrete pore solution at different immersion time (a)3.5h, (b)6.0h, (c)23.5h, (d)47.0h, (e)48.5h, (f)49.0h
By statistical calculation, the standard deviation of current noise σI, average charge q in every
event and noise resistance Rn of Q235 carbon steel is shown in Table 4 and Fig. 6. When the
immersion time was less than 47 hours, the standard deviation of current noise σI and average charge q
of Q235 carbon steel were kept in a lower value with the order of 3~5 nAcm-2 and 10-13 C, and the noise resistance Rn was located in order of 104Ωcm2. After the immersion time larger than 48 hours, σI
and q values suddenly increased to the order of 101~102 nAcm-2 and 10-12~10-11 C, and the noise resistance Rn decreased to 102~103Ωcm2. All these results meant that two distinct processes could be
classified for the corrosion behavior of Q235 steel in simulated concrete pore solution.
Table 4. Standard deviation of current noise σI, average event charge q and noise resistance Rn of Q235
carbon steel at different immersion time
Time/h 3.5 6.0 22.0 23.5 28.0 29.5 47.0 48.5 49.0 53.5
σI/nA·cm-2
q/10-13C
4.05 0.896 4.27 0.826 3.90 0.925 3.96 0.801 3.93 2.59 3.95 2.58 3.85 1.75 9.94 20.4 343.0 197.0 429.0 836.0 Rn/Ω·cm2 39178 30862 12099 18043 25510 26032 15922 2980 122 427
0 10 20 30 40 50
0 100 200 300 400 I Rn
t / hours
I / n A * c m -2 1 10 100 1000 10000 100000 R n / * c m 2
Figure 6. Standard deviation of current noise σI and noise resistance Rn of Q235 carbon steel in
[image:9.596.189.421.582.731.2]
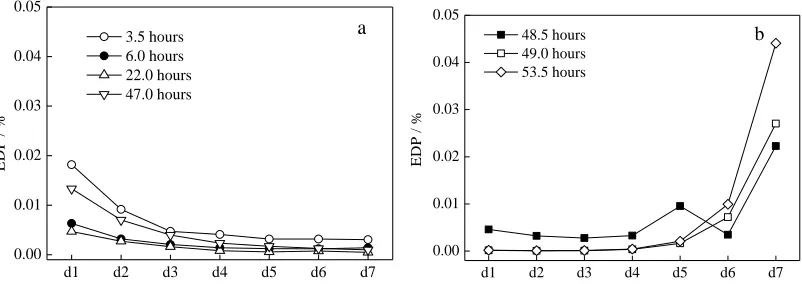
The distribution of crystal energy of Q235 carbon steel in simulated concrete pores solution under different immersion time is shown in Fig. 7. During the immersion time less than 47 hours, the maximum crystal energy was located in d1 crystal, which indicating the current noise mainly fluctuated in a higher frequency range. This characteristic is corresponded with Fig. 5a-5d, and means that Q235 steel is in a passive state [15]. After the immersion time larger than 47 hours, the maximum crystal energy was changed to d7 crystal, which indicating the current noise fluctuated in a lower frequency range. This observation accords with the result of Fig. 5e and Fig. 5f, and implies that a localized corrosion is occurred on the steel [1].
d1 d2 d3 d4 d5 d6 d7
0.00 0.01 0.02 0.03 0.04 0.05
E
D
P
/
%
3.5 hours 6.0 hours 22.0 hours 47.0 hours
a
d1 d2 d3 d4 d5 d6 d7
0.00 0.01 0.02 0.03 0.04 0.05
E
D
P
/
%
48.5 hours 49.0 hours 53.5 hours
b
Figure 7. Energy distribution plots of Q235 carbon steel in simulated concrete pore solution at different immersion time(a)3.5-47.0 hours(b)48.0-53.5hours
Fig. 8 is the fractal dimension Dfd of Q235 carbon steel in simulated concrete pores solution
under different immersion time. When the immersion time was less than 47 hours, the fractal dimension was kept almost invariable around 2.0, which meant the steel surface was in general corrosion or passive state. After the immersion time larger than 48 hours, the fractal dimension was decreased abruptly and fixed at 1.0, indicating the pitting corrosion was occurred on the steel[10,13].
0 10 20 30 40 50 60
0.0 0.5 1.0 1.5 2.0 2.5 3.0
F
ra
c
ta
l
D
im
e
n
si
o
n
D fd
[image:10.596.101.502.226.368.2]t / hours
[image:10.596.186.410.545.715.2]
-2 -1.5 -1 -0.5 0 0.5 1 1.5
x 10-8
-2 -1.5 -1 -0.5 0 0.5 1
1.5x 10
-8
[image:11.596.75.514.73.612.2]a
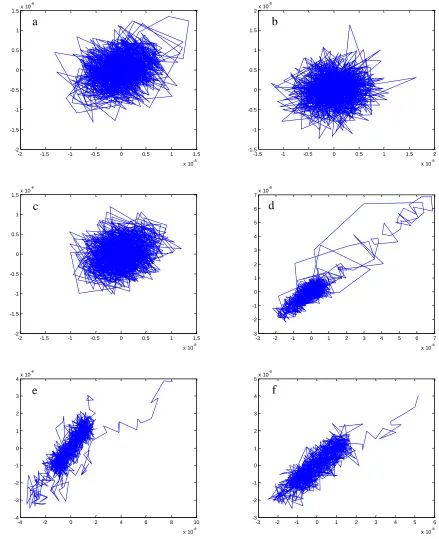
Figure 9. Phase space construction diagram of electrochemical potential noise of Q235 carbon steel in simulated concrete pore solution at different immersion time (a)3.5h, (b)6.0h, (c)47.0h, (d)48.5h, (e)49.0h, (f)53.5h
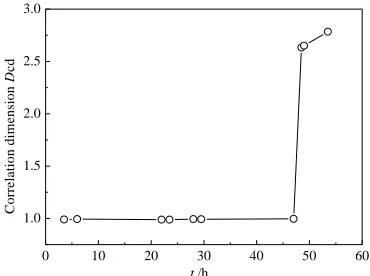
The phase space diagram of electrochemical current noise of Q235 steel in simulated concrete pore solution is shown in Fig. 9, and the calculated correlation dimension Dcd is shown in Fig. 10.
From Fig. 9 and Fig. 10, it can be seen that with the immersion time less than 47 hours the phase space
-3 -2 -1 0 1 2 3 4 5 6
x 10-8
-3 -2 -1 0 1 2 3 4
5x 10
-8
f
-4 -2 0 2 4 6 8 10
x 10-8
-4 -3 -2 -1 0 1 2 3
4x 10
-8
e
-3 -2 -1 0 1 2 3 4 5 6 7
x 10-8
-3 -2 -1 0 1 2 3 4 5 6
7x 10
-8
d
-2 -1.5 -1 -0.5 0 0.5 1 1.5
x 10-8
-2 -1.5 -1 -0.5 0 0.5 1
1.5x 10
-8
c
-1.5 -1 -0.5 0 0.5 1 1.5 2
x 10-8
-1.5 -1 -0.5 0 0.5 1 1.5
2x 10
-8
diagram of Q235 steel was in a “spherical shape”(Fig. 9a-9c), and the correlation dimension Dcd was
around 1.0(Fig. 10), indicating the passivation or uniform corrosion was occurred on Q235 steel surface. Whereas with the immersion time larger than 48 hours, the phase space diagram was in a “rod-like shape” (Fig. 9d-9f), and the correlation dimension Dcd was around 2.60~2.80(Fig.10), indicating
the local corrosion or pitting corrosion was occurred on Q235 steel surface [10].
0 10 20 30 40 50 60
1.0 1.5 2.0 2.5 3.0
C
o
rr
e
la
ti
o
n
d
im
e
n
si
o
n
D
cd
t /h
Figure 10. Dependence of correlation dimension of Q235 carbon steel in simulated concrete pore solution on immersion time
The cluster distribution of Q235 carbon steel in simulated concrete pore solution as the function of immersion time is shown in Fig. 11. It can be seen that there are two distinct distributions: 3.5–47 hours belonging to Cluster 1, 48.5–53.5 hours belonging to Cluster 2. It means that Q235 steel in simulated concrete pore solution was in passive state before the immersion less than 47 hours. After 48 hours of immersion, it is changed into stable pitting corrosion stage. This conclusion is accorded with that of Fig. 6, Fig. 7, Fig. 8 and Fig. 10.
0 10 20 30 40 50 60
1 2
C
lu
st
e
r
t / h
[image:12.596.201.386.184.322.2] [image:12.596.175.422.527.713.2]
From the above results, it can be concluded that there are two distinct stages existed on the corrosion process of Q235 steel in simulated concrete pore solution. The first step is the passivation state of Q235 steel in the initial immersion. In this stage, a passive film is formed and growth on the steel surface because of the alkalinity of concrete pore solution with pH value greater than 13. The second step is the initiation and development of pitting corrosion of Q235 steel because of the rupture of passive film by the penetration and diffusion of Cl- ions in the concrete pore solution.
4. CONCLUSIONS
(1) During the initial immersion in simulated concrete pore solution, Q235 steel has a higher charge transfer resistance, film resistance, noise resistance and fractal dimension. Whereas with the immersion time larger than 48 hours, the charge transfer resistance, film resistance, noise resistance and fractal dimension of Q235 steel decrease greatly.
(2) During the initial immersion in simulated concrete pore solution, Q235 steel has a lower standard deviation σI, average charge q and correlation dimension. After the immersion time larger
than 48 hours, the standard deviation σI, average charge q and correlation dimension of Q235 steel
increase abruptly.
(3) Two distinct stages could be classified for the corrosion of Q235 carbon steel in simulated concrete pore solution, i.e. formation and growth of passive film (Cluster 1), breakdown of passive film and development of pitting corrosion (Cluster 2).
ACKNOWLEDGEMENTS
This paper was supported by National Key Basic Research Program of China (No.2011CB610505 and 2014CB046801), Key Project of Tianjin Natural Science Foundation (13JCZDJC29500) and Specialized Research Fund for the Doctoral Program of Higher Education (20120032110029).
References
1. G. F. Qiao and J. P. Ou, Electrochim. Acta, 52 (2007) 8008. 2. K. Darowicki, Corros. Sci., 37 (1995) 913.
3. M. Sánchez, J. Gregori, C. Alonso, J. J. García-Jareño, H. Takenouti and F. Vicente, Electrochim. Acta, 52 (2007) 7634.
4. H. A. A. Al-Mazeedi and R. A. Cottis, Electrochim. Acta, 49 (2004) 2787. 5. A. Legat, M. Leban and Ž. Bajt, Electrochim. Acta, 49 (2004) 2741.
6. D. G. John, P. C. Searson and J. L. Dawson, Corros. Eng. Sci. Tech., 16 (1981) 102. 7. R. G. Hu, R. S. Huang, R. G. Du, C. J. Lin, Acta Phys. Chim. Sin., 19 (2003) 46.
8. R. G. Hu, C. J. Lin, B. Zhao and R. G. Du, Proceedings of 16th International Corrosion Congress, Paper 258, Beijing, 2005.
9. B. Zhao, J. H. Li, R. G. Hu, R. G. Du and C. J. Lin, Electrochim. Acta, 52 (2007) 3976.
10.D. H. Xia, S. Z. Song, J. H. Wang, J. B. Shi, H. C. Bi and Z. M. Gao, Electrochem. Commun., 15 (2012) 88.
13.X. H. Wang, J. H. Wang, C. W. Fu, Y. K. Gao, Int. J. Electrochem. Sci., 8 (2013) 7211. 14.T. Haruna, Y. Morikawa, S. Fujimoto and T. Shibata, Corros. Sci., 45 (2003) 2093. 15.G. F. Qiao and J. P. Ou, Corros. Sci. Prot. Tech., 21 (2009) 365.
16.Y. Morozov, A. S. Castela, A. P. S. Dias and M. F. Montemor, Cem. Concr. Res., 47 (2013) 1. 17.L. Yohai, M. Vázquez and M. B. Valcarce, Electrochim. Acta, 102 (2013) 88.