Int. J. Electrochem. Sci., 7 (2012) 7720 - 7739
International Journal of
ELECTROCHEMICAL
SCIENCE
www.electrochemsci.org
Effect of Some Organic Aldehydes on the Electropolishing of
Copper in Phosphoric Acid
Nabila M. Elmalah1, S.M.Abd Elhaliem2, A.M.Ahmed1 and, S.M.Ghozy2,*
1
Chemistry Department Faculty of Science Alexandria University
2
Chemistry Department Faculty of Science Elzagazig University
*
E-mail: [email protected]
Received: 26 February 2012 / Accepted: 30 April 2012 / Published: 1 August 2012
Electropolishing of copper in phosphoric acid is considered as corrosion rate of copper and due to the economic importance of copper there are several researches deals with acceleration and inhibition of this process. From the previous studies this process may be controlled by the presence of some materials which may cause acceleration or inhibition of this process. In this paper the electropolishing process inhibited with different ratio by addition of some organic aldehydes ( formaldehyde, acetaldehyde, paraldehyde, benzaldehyde, salicylaldehyde, anisaldehyde, and tolualdehyde) by addition with concentration ( 10-5 - 10-2 mol. l -1 ).The results reveal that organic aldehydes have
strongest inhibitive effect ranging from 14.3 – 61.9 % and the thermodynamic parameters and dimensionless group were present.
Keywords: Electropolishing of copper, organic aldehydes, Limiting Current, Inhibition of corrosion.
Thermodynamic parameters and dimensionless group.
1. INTRODUCTION
Due to its excellent thermal conductivity and good mechanical workability, copper is a material commonly used in heating and cooling systems. Scale and corrosion products have a negative effect on heat transfer, and they cause a decrease in the heating efficiency of the equipments. Therefore, periodic descaling and cleaning in hydrochloric acid pickling solution are necessary.
Corrosion inhibitors can be used to prevent copper dissolution. Amines are known to be very effective inhibitors for metal and alloys in different corrosion media. Benzotriazole, for instances, was studied and found to have excellent inhibition properties in several corrosion environments [8-11]. The molecule contains nitrogen atoms and it is also useful in preventing copper staining and tarnishing [12].
One of the most important methods in the protection of copper against corrosion is the use of organic inhibitors[13].
Organic compounds containing polar groups including nitrogen, sulfur, oxygen, and heterocyclic compounds with polar functional groups and conjugated double bonds have been reported to inhibit copper corrosion [14-22].
The inhibiting action of these organic compounds is usually attributed to their interactions with the copper surface via their adsorption. Polar functional groups are regarded as the reaction center that stabilizes the adsorption process, in general, the adsorption of an inhibitor on a metal surface depends on the nature and the surface charge of the metal, the adsorption mode, its chemical structure and the type of electrolyte solution[23].
The phenomenon of electropolishing is first discovered by Jaquet [24]. A lot of work has been done on this phenomenon owing to its important as metal finishing process. A great deal of work has been directed to study the mechanism of electro polishing as well as to establish conditions for different metals and alloys involved in the process.
Mechanistic studies have revealed that electro polishing is diffusion controlled process taking place at the limiting current which is attained most probably when the diffusion layer becomes saturated with Cu in, electropolishing of copper.
Therefore, the values of the limiting current which determined the polishing rate depends on the rate of mass transfer of Cu+2 from the diffusion layer to the bulk solution. The latter depends on the relative movement of the ions at the anode and in the electrolyte. Earlier works studied the factors affecting the limiting current have overlooked the effect of anode geometry as an important factor in determining the value of the limiting current.
The work of Heckerman and Simpson indicated that, electro polishing of copper in phosphoric acid results in the formation of a thin film of a phosphorous compound. The nature of solid film is not known. The radio tracer work suggested that, it a phosphorous containing compound. Other work based on electron diffraction showed .That, the film is an oxide. Hull cell studies by Lurking suggested that, copper oxides are formed during electro polishing of copper in H3PO4 [25].
It can be denied that, a viscous layer is present at the surface of copper anodes during electro polishing as shown by the work of Walton [26].
phosphoric acid at different conditions. The rate of copper corrosion is determined by measuring the anodic limiting current.
2. EXPERIMENTAL PROCEDURE
2.1. Chemicals:
Analar grade H3PO4 (98% w/w) and double distilled water used to prepare the electrolyte. The
organic aldehydes were used in this work are Formaldehyde, Acetaldehyde, Paraldehyde, Benzaldehyde, Salicylaldehyde, Anisaldehyde and O-Tolualdehyde.
2.2. Apparatus and Procedure:
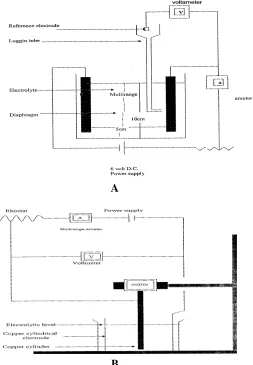
Fig (1.a) shows the cell and electrical circuit used in the present work.
A
B
[image:3.612.191.444.319.684.2]
The cell consists of a rectangular plastic container having the dimensions 5.1x5x10 cm with electrodes filing the whole cross section. The electrodes were rectangular copper sheets of 10 cm height and 5 cm width. Electrodes separation was 5 cm. A porous PVC diaphragm was used to prevent the effect due to H2 bubbles. The electrical circuit consists of 6V D.C. power supply, while a voltmeter
is connected in parallel with the cell to measure the voltage and multirange ammeter connected in series with cell to measure the current.
2.3. Measurements of the Limiting Current:
Polarization curves were obtained by increasing the cell current step wise and the steady state anode potential against a reference electrode consisted of a wire immersed in a cup of Luggin tube filled with phosphoric acid concentration similar to that in the cell, the tip of the Luggin tube was placed 0.5-from the anode. The potential difference between the anode and the reference was measured by high impedance potentiometer. Five phosphoric acid concentration (6, 8, 10 ,12 and 14 M) were prepared from Analar grade phosphoric acid distilled water. The anode height varied from 1-5 cm. Before each run, the back part of the anode was insulated with polystyrene lacquers and the active surface of the anode was polished with fin emery paper, degreased with trichloroethylene, washed with alcohol and finally rinsed in distilled water. Electrode treatment was similar to that used by Wilke[27]. Organic acid concentration were 10-5 – 10-2 mol. l-1. The rate of electro polishing of copper was determined at 25°C.
2.4. Rotating Cylinder Electrode (R.C.E.) Cell and Circuit:
Fig (1.b) is a block diagram of the apparatus which permits the rotating of a cylinder electrode at accurately controlled angular velocities. The shaft was driven by a variable speed motor. The frequency of rotation, recorded as revolution per minute-, was counted by an optical tachometer. The glass vessel which holds electrolyte is 13 cm diameter. The electrical circuit Fig (1.b) consists of 6 volts D.C. power supply, a multirange ammeter connected in series with the cell to measure the current, and voltmeter is connected in parallel with the cell to measure its voltage.
The anode consists of a copper metal cylinder ( 4.76 cm ) diameter and 2 cm length. The sides and back of the cylinder as well as the drive shaft are insulated by epoxy- resin. The cathode is made of a cylinder copper metal electrode of 12 cm diameter; it's also acted as the reference electrode by virtue of its high surface area compared to that of the anode.
3. RESULTS AND DISCUSSIONS
3.1.ElectropoIishing using Divided and Undivided Cell:
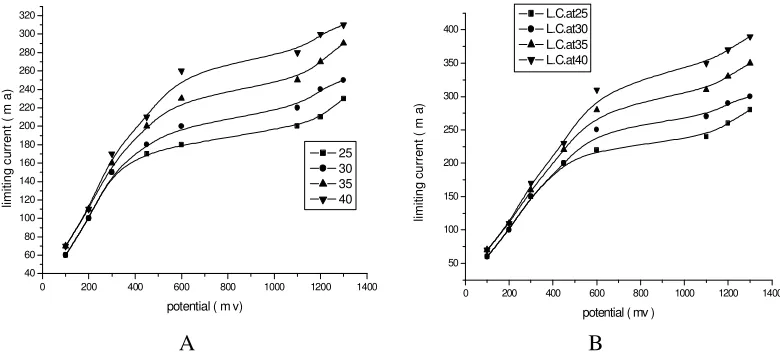
at the same temperatures. The data indicate that on used undivided cell, cathodic H2 evolution
[image:5.612.110.500.176.355.2]increases the anodic limiting current. This increase is attributed in part to the fact that, the uprising hydrogen bubbles induce a radial momentum transfer which enhances the rate of polishing at the anode. Also indicated that on increasing the temperature the limiting current increase, this refers Figure to the high temperature catalyze the electro polishing process.
0 200 400 600 800 1000 1200 1400
40 60 80 100 120 140 160 180 200 220 240 260 280 300 320
lim
it
in
g
c
u
rr
e
n
t
(
m
a
)
potential ( m v)
25 30 35 40
A
0 200 400 600 800 1000 1200 1400
50 100 150 200 250 300 350 400
lim
it
in
g
c
u
rr
e
n
t
(
m
a
)
potential ( mv ) L.C.at25 L.C.at30 L.C.at35 L.C.at40
B
Figure 2. Show the relation between the limiting current and temperature, H3PO4= 8M, (a: with and b :
without diaphragm )
3.2. Effect of aldehydes concentration on the limiting current density:
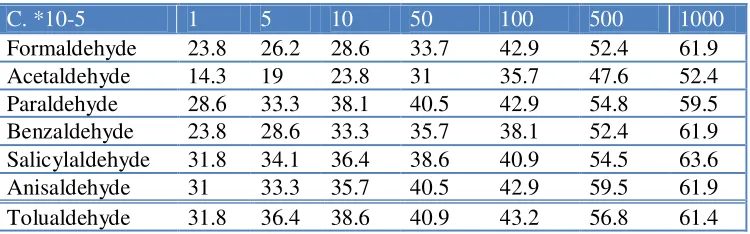
The observed limiting current density , which represents the rate of copper metal corrosion in phosphoric acid at 25 º C , decrease with increasing the concentration of the organic aldehydes under studying.
It found that the limiting current decreases with increasing the concentration of aldehydes. From the practical point of view and on the basis of results obtained the uses of aldehydes studied in the concentration range between (10 -5 - 10 -2 mol.l-1 ) inhibit the corrosion of copper metal in 8 M H3PO4 acid[28,29]. The limiting current in absence of organic aldehydes (I), and in the presence of
organic aldehydes (IL), the percentage inhibition can be calculated from the following equation:
I - I L
% inhibition = * 100 I
→ ( 1 )
1- The solubility of the dissolved copper phosphate in the orthophposphoric acid, which is
responsible for the limiting current, decreases with increasing the phosphoric acid concentration. 2- The increase in the diffusion layer thickness, which relates the resistance of electrolyte to the
[image:6.612.120.495.196.313.2]rate of mass transfer of copper ion from anode surface to the bulk solution.
Table 1. Give the effect of aldehyde concentration on the percentage inhibition of copper electrode in
the presence of 8M H3PO4 at 25 º C.
1000 500
100 50
10 5
1 C. *10-5
61.9 52.4
42.9 33.7
28.6 26.2
23.8 Formaldehyde
52.4 47.6
35.7 31
23.8 19
14.3 Acetaldehyde
59.5 54.8
42.9 40.5
38.1 33.3
28.6 Paraldehyde
61.9 52.4
38.1 35.7
33.3 28.6
23.8 Benzaldehyde
63.6 54.5
40.9 38.6
36.4 34.1
31.8 Salicylaldehyde
61.9 59.5
42.9 40.5
35.7 33.3
31 Anisaldehyde
61.4 56.8
43.2 40.9
38.6 36.4
31.8 Tolualdehyde
3.3. Adsorption Isotherm
The adsorption of the inhibitor molecules from aqueous solutions can be regarded as substitution adsorption process between the organic compounds in the aqueous phase and water molecules adsorbed on the electrode surface (H2O(s)).
Org (aq) + xH2O(s) = org(s) + x (H2O) → (2)
Where x (the size ratio) is the number of water molecules displaced by one molecule of inhibitor. The above process reaches equilibrium when the chemical potential on the left hand equal to that of the right hand side.
Adsorption isotherms are very important in determining the mechanism of electrochemical reactions. the most frequently used isotherms are those of Langmuir . Frumkin, Parsons, Temkin, Flory-Huggins, and Bockris-Swinkels [32].
These entire isotherms are of the general form:
f(Ө,x)exp(-aӨ)= KC → (3)
3.4.Application of Isotherm:
The degree of surface coverage (Ө) at constant temperature was determined from the following equation[35,36].
I - I L
Ө =
I
→ ( 4 )
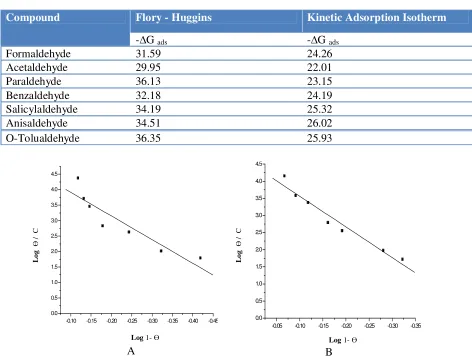
Figs (3.a – 3.g ) show the Flory-Huggins adsorption isotherm for copper electrode in H3PO4
plotted as log Ө /C against log ( 1- Ө) at 25°C. A straight line is obtained with a slope X and intercept log x K. The experimental data fits the Flory-Huggins adsorption isotherm which represented by:
log Ө /C =Iog xk+xlog(l- Ө) → ( 5 )
where x is the number of water molecules replaced by one molecule of the inhibitor. It is clear that, the surface coverage data are useful for discussing adsorption characteristics. The adsorption of inhibitors at metal-solution interface may be due to the formation of electrostatic or covalent bonding between the adsorbates and the metal surface [37]. The kinetic adsorption isotherm may be written in the form [38]:
Iog Ө /1- Ө =Iog k' + y → (6)
From equation ( 6 ) a plot of log Ө /1- Ө against log C should yields a straight line with intercept of log K` and slop = y , where y is the number of inhibitor molecules occupy one active site. The binding constant of adsorption K= k'l/y, where 1/y is the number of the active surface sites occupied by one molecule of the inhibitor, and k is the binding constant. Figs (4.a– 4.g) indicate linear relationship between log Ө / 1- Ө and log C at 25°C, and the calculated values of 1/y and K are given in Table (2 ). And from this table,. it is obvious that the value of 1/y for all compounds are higher than one indicating that, the given inhibitors molecules are attached to more than one active site. The free energy of adsorption (∆Gads). at different concentration of the aldehydes as calculated from the
following equation:
∆Gads = -RT In (55.5 K) → (7)
the value 55.5 is the concentration of water in the solution mol/1.
The values of ∆G ads are given in Table (3). In all cases, the (∆G ads) values are negative and lie
in the range of 22.01 – 36.35 KJ/mol. The most efficient inhibitor shows the most negative (∆G ads)
value. This suggests that, they are strongly adsorbed on metal surface. The negative values of (∆G ads)
than (- 40) indicating that the inhibitors are physically adsorbed on the metal surface. similar results have also been reported by Talati [38].
[image:8.612.107.506.167.302.2]
Table 2. Gives the values of K,X and 1/Y of H3PO4 of some organic aldehydes to Flory – Huggins,
and Kinetic Adsorption Isotherm constants at 25 º C.
Kinetic Adsorption Isotherm Flory - Huggins
Compound X K K' Y 1/Y K
322.4 4.2 0.239 3.99 6200.6 7.63 Formaldehyde 130.04 3.6 0.276 3.84 3198.9 8.96 Acetaldehyde 361.8 5.5 0.181 3.036 38715.6 10.37 Paraldehyde 312.7 5.54 0.2204 3.55 7862.3 8.03 Benzaldehyde 493.97 5.6 0.1785 3.023 17705.7 8.5 Salicylaldehyde 654.98 5.11 0.1955 3.55 20201.3 8.499 Anisaldehyde 632.5 5.85 0.1709 3.012 42444 9.86 O-Tolualdehyde
Table 3. Gives the calculated values of free energy of adsorption (K.J. mol -1) of H3PO4 in the
presence of the aldehydes
-0.05 -0.10 -0.15 -0.20 -0.25 -0.30 -0.35
0.0 0.5 1.0 1.5 2.0 2.5 3.0 3.5 4.0 4.5 B
-0.10 -0.15 -0.20 -0.25 -0.30 -0.35 -0.40 -0.45
0.0 0.5 1.0 1.5 2.0 2.5 3.0 3.5 4.0 4.5 A
Kinetic Adsorption Isotherm Flory - Huggins
Compound
-∆G ads
-∆G ads
24.26 31.59 Formaldehyde 22.01 29.95 Acetaldehyde 23.15 36.13 Paraldehyde 24.19 32.18 Benzaldehyde 25.32 34.19 Salicylaldehyde 26.02 34.51 Anisaldehyde 25.93 36.35 O-Tolualdehyde
Log 1- Ө
L o g Ө / C
Log 1- Ө
[image:8.612.71.543.357.721.2]
-0.10 -0.15 -0.20 -0.25 -0.30 -0.35 -0.40 -0.45
1.5 2.0 2.5 3.0 3.5 4.0
D
-0.15 -0.20 -0.25 -0.30 -0.35 -0.40 -0.45
1.5 2.0 2.5 3.0 3.5 4.0
F
-0.15 -0.20 -0.25 -0.30 -0.35 -0.40
1.5 2.0 2.5 3.0 3.5 4.0 4.5
C
-0.15 -0.20 -0.25 -0.30 -0.35 -0.40 -0.45 1.5
2.0 2.5 3.0 3.5 4.0
E
-0.15 -0.20 -0.25 -0.30 -0.35 -0.40 -0.45
1.5 2.0 2.5 3.0 3.5 4.0
G
Figure 3. Show the relation between Log (Ө / C) and Log (1- Ө ) at 25 º C in case of all
aldehydes.where ( a: for formaldehyde b: for acetaldehyde, c: for paraldehyde, d: for benzaldehyde, e: for salicylaldehyde, f : for anisaldehyde, and g: for tolualdehyde )
Log 1- Ө
L
o
g
Ө
/
C
Log 1- Ө
L
o
g
Ө
/
C
L
o
g
Ө
/
C
Ө
Log 1- Ө
L
o
g
Ө
/
C
L
o
g
Ө
/
C
Log 1- Ө
[image:9.612.110.498.54.630.2]
-5.0 -4.5 -4.0 -3.5 -3.0 -2.5 -2.0
-0.8 -0.6 -0.4 -0.2 0.0 0.2 B
-5.0 -4.5 -4.0 -3.5 -3.0 -2.5 -2.0
-0.9 -0.8 -0.7 -0.6 -0.5 -0.4 -0.3 -0.2 -0.1 0.0 0.1 0.2 0.3 A
-5.0 -4.5 -4.0 -3.5 -3.0 -2.5 -2.0
-0.9 -0.8 -0.7 -0.6 -0.5 -0.4 -0.3 -0.2 -0.1 0.0 0.1 0.2 0.3 D
-5.0 -4.5 -4.0 -3.5 -3.0 -2.5 -2.0
-0.9 -0.8 -0.7 -0.6 -0.5 -0.4 -0.3 -0.2 -0.1 0.0 0.1 0.2 C
-5.0 -4.5 -4.0 -3.5 -3.0 -2.5 -2.0
-0.9 -0.8 -0.7 -0.6 -0.5 -0.4 -0.3 -0.2 -0.1 0.0 0.1 0.2 0.3 F
-5.0 -4.5 -4.0 -3.5 -3.0 -2.5 -2.0
-0.9 -0.8 -0.7 -0.6 -0.5 -0.4 -0.3 -0.2 -0.1 0.0 0.1 0.2 0.3 E L o g ( Ө / 1 - Ө )
Log C
Log C
L o g ( Ө / 1 - Ө )
Log C
L o g ( Ө / 1 - Ө )
Log C
L o g ( Ө / 1 - Ө ) L o g ( Ө / 1 - Ө )
Log C
L o g ( Ө / 1 - Ө )
-5.0 -4.5 -4.0 -3.5 -3.0 -2.5 -2.0
-0.9 -0.8 -0.7 -0.6 -0.5 -0.4 -0.3 -0.2 -0.1 0.0 0.1 0.2
G
Figure 4. Show the relation between Log (Ө / 1- Ө ) and Log C at 25 º C in case of all aldehydes
where ( a: for formaldehyde, b: for acetaldehyde, c: for paraldehyde, d: for benzaldehyde, e: for salicylaldehyde, f : for anisaldehyde, and g: for tolualdehyde )
3.5.Effect of temperature and thermodynamic treatment of the reaction
The effect of temperature on the Cu electro polishing rate in absence and presence of organic additives was determined in the temperature ranges between (25 - 40ºC) . It was observe that the electro polishing rate increases with temperature for different concentrations of organic additives. Values of Ea that have been derived from the slopes of Arrhenius [39].
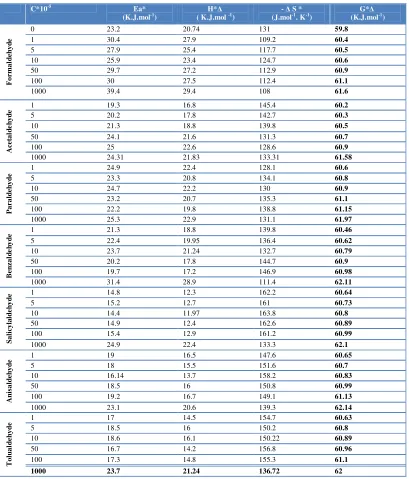
It is obviously seen that the Ea values in absence and presence of organic additives are less than < 40 k J mol-1, also indicating that the diffusion processes are controlling the electropolishing reaction[40]. In this research, the thermodynamic parameters such as change in free energy ∆G*, enthalpy ∆H* and entropy ∆S* were calculated in same way as the related researches did in literature [41 – 44]. From transition state equation [45] a straight line was obtained, from which can ∆H* and ∆S* be calculated from the slope and intercept, respectively. The free energy change, ∆G*, can be represented as follows:
∆G* = ∆H* - T∆S* → (8)
The result indicated of that the tested compounds acted as inhibitors through adsorption on copper surface, which resulted in formation of a barrier to mass and charge transfer. The values of ∆H* reflect the strong adsorption of these compounds on copper surface. The negative values of ∆S* pointed to a greater order produced during the process of activation.
This can be achieved by the formation of activated complex representing the association or fixation with consequent loss in the degree of freedom of the system during the process. ∆G* values showed limited increase with rise in the concentration of organic additives revealing that weak dependence of ∆G* on the composition of the organic additives can be attributed largely to the general linear composition between ∆H* and ∆S* for the given temperature [39,46].
Log C
L
o
g
(
Ө
/
1
-
Ө
)
[image:11.612.214.424.66.252.2]
3.6.1. The isokinetic relationship
Table 4. The values of E* and all thermodynamic parameters For all different concentration of the
organic aldehydes.
G* ∆
(K.J.mol-1
)
- ∆ S *
(J.mol-1
. K-1
)
H* ∆
( K.J.mol -1
) Ea* (K.J.mol-1 ) C*10-5 59.8 131 20.74 23.2 0 F o r m a ld e h y d
e 1 30.4 27.9 109.2 60.4
60.5 117.7 25.4 27.9 5 60.6 124.7 23.4 25.9 10 60.9 112.9 27.2 29.7 50 61.1 112.4 27.5 30 100 61.6 108 29.4 39.4 1000 60.2 145.4 16.8 19.3 1 A c e ta ld e h y d e 60.3 142.7 17.8 20.2 5 60.5 139.8 18.8 21.3 10 60.7 131.3 21.6 24.1 50 60.9 128.6 22.6 25 100 61.58 133.31 21.83 24.31 1000 60.6 128.1 22.4 24.9 1 P a r a ld e h y d
e 5 23.3 20.8 134.1 60.8
60.9 130 22.2 24.7 10 61.1 135.3 20.7 23.2 50 61.15 138.8 19.8 22.2 100 61.97 131.1 22.9 25.3 1000 60.46 139.8 18.8 21.3 1 B e n z a ld e h y d e 60.62 136.4 19.95 22.4 5 60.79 132.7 21.24 23.7 10 60.9 144.7 17.8 20.2 50 60.98 146.9 17.2 19.7 100 62.11 111.4 28.9 31.4 1000 60.64 162.2 12.3 14.8 1 S a li c y la ld e h y d e 60.73 161 12.7 15.2 5 60.8 163.8 11.97 14.4 10 60.89 162.6 12.4 14.9 50 60.99 161.2 12.9 15.4 100 62.1 133.3 22.4 24.9 1000 60.65 147.6 16.5 19 1 A n is a ld e h y d e 60.7 151.6 15.5 18 5 60.83 158.2 13.7 16.14 10 60.99 150.8 16 18.5 50 61.13 149.1 16.7 19.2 100 62.14 139.3 20.6 23.1 1000 60.63 154.7 14.5 17 1 T o lu a ld e h y d e 60.8 150.2 16 18.5 5 60.89 150.22 16.1 18.6 10 60.96 156.8 14.2 16.7 50 61.1 155.3 14.8 17.3 100 62 136.72 21.24 23.7 1000
Variation in the rate within series may be caused by changes in either, or both, the enthalpy or the entropy of activation the correlation of ∆ H * with ∆ S * is linear relation ship may be stated algebraically :
[image:12.612.103.512.133.612.2]
The operator, δ, concerns difference between any two reactions in the series. Substituting from the equation (11 ) into the familiar relationship:
δ ∆ H* = δ ∆ G* + T δ ∆ S* → (11) We obtain
β δ ∆ S * = δ ∆ G* + T δ ∆ S* → (12)
Where δ ∆ G* = zero , β = T. In other words , the slop in a linear plot of ∆ H * versus ∆ S* is the temperature at which all reactions that conform to the line occur at the same rate. β there for known as the isokinetic temperature . The isokinetic plot of ∆H* and ∆S* for different concentration of the organic aldehydes, fig (5.a – 5.g) and table (4) was found to be linear and the isokinetic temperature (β) was computed from the slop of the plot as 344K, 357.6K, 347.8K, 341.1K, 357.1K, 384K and 355K. These values are much higher than that of the experimental temperature 298 K indicating that the rate of the reaction is enthalpy controlled [47- 49 ].
125 130 135 140 145 150 155
14 16 18 20 22 24
slop = 0.3576
B
80 90 100 110 120 130
20 22 24 26 28 30 32 34 36 38
slop = 0.344
A
110 120 130 140 150 160
14 16 18 20 22 24 26 28 30
slop = 0.3411
D
125 130 135 140 145 150 155
14 16 18 20 22 24
slop = 0.3478
C
∆
H
(
K
.J
.m
o
l
-1)
-∆ S (J.mol-1
. K-1
)
∆
H
(
K
.J
.m
o
l
-1)
-∆ S (J.mol-1. K-1 )
∆
H
(
K
.J
.m
o
l
-1)
-∆ S (J.mol-1
. K-1
)
∆
H
(
K
.J
.m
o
l
-1)
-∆ S (J.mol-1
. K-1
140 145 150 155 160
12 14 16 18 20 22
slop = 0.384
F
130 135 140 145 150 155 160 165 170
10 12 14 16 18 20 22 24
slop = 0.35711
E
135 140 145 150 155 160 165 170
10 12 14 16 18 20 22
slop = 0.355
G
Figure 5. Show the relation between ∆ H*( k j mol -1 ) and -∆ S*( j mol -1 K -1 ) for different concentration of organic aldehydes where ( a: for formaldehyde, b: for acetaldehyde, c: for paraldehyde, d: for benzaldehyde, e: for salicylaldehyde, f : for anisaldehyde, and g: for tolualdehyde )
3.7. Effect of Stirring and Application of Dimensionless Analysis:
The effect of the speed-of rotation on the rate of electro polishing of copper in presence of organic Aldehydes additives can also be used to determine whether the electro polishing process is diffusion or chemically controlled process. If the rate of electro polishing increases by increasing the speed of rotation, then the reaction is diffusion controlled. However, if the rate of electro polishing is independent of the rotation it is likely to be a chemically controlled process.
The angular velocity to is given by:
W =2Π rpm → ( 13 )
where r is the radial distance in cm , rpm is revolution per minute
∆
H
(
K
.J
.m
o
l
-1)
-∆ S (J.mol-1. K-1 )
-∆ S (J.mol-1. K-1 )
∆
H
(
K
.J
.m
o
l
-1)
∆
H
(
K
.J
.m
o
l
-1)
-∆ S (J.mol-1
. K-1
[image:14.612.124.497.61.489.2]
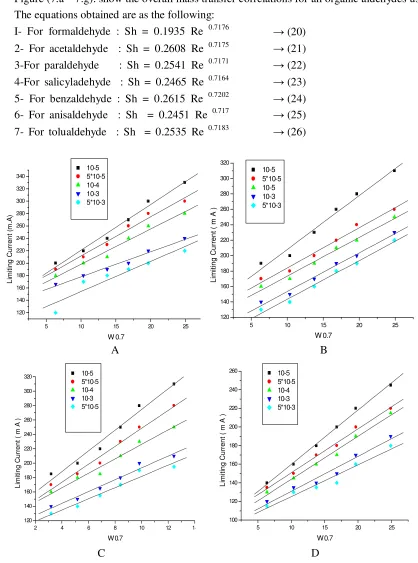
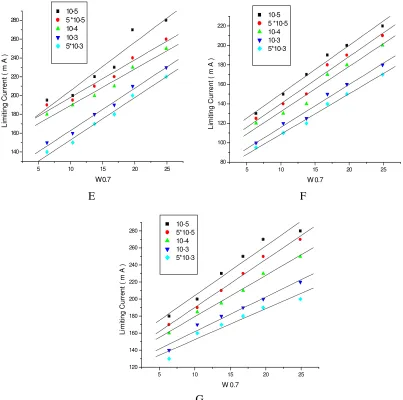
Figure (6.a – 6.g): Show the relation between the limiting current density and the angular velocity W0.7 at different compositions of the organic aldehydes at 25°C. Straight lines were obtained and the limiting current increases with increasing rotation, which indicates that the electro-polishing is a diffusion controlled process.
Figure (6.a – 6.g): Show the effect of the speed of rotation on the limiting current density in absence and in the presence of organic aldehydes. The data satisfy the Eisenberg equation. The 'diffusion coefficient of copper ions (D) in the different solutions was determined from the values of the limiting current densities according Eisenberg equation [50, 51].
→ (14) IL=0.079nFC b v 0.7d -0.3U 0.344 D 0.644
Where: n is the number of exchanged electrons
F is the Faraday s constant; n F is called "Faradic equivalence C b is the bulk concentration (mol.cm-3).
U is the peripheral velocity = w r in cm. rad.s-1
And where, w is the angular velocity in rad.s-1, r is the radial distance in cm or U= 2 Π W r in cm s -1
d is the characteristic length for the rotating cylinder = the diameter of the cylinder in cm , D is the diffusion coefficient for the metal ions(Cu+2 ion in the present case) in cm2 S-1, and v is the kinamatic viscosity in Stoke (ע= η/ρ).
Values of (D) and (ע) for all solutions under different conditions are also recorded. The diffusion coefficient, D, of Cu+2 ions in solutions containing organic aldehydes decreases due to the increase in the viscosity η according to Stokes-Einstein equation(52 ):
η/ T = constant → ( 15 )
where: η is the viscosity of the solution (g.cm-1 .s-1 ). D is the diffusion coefficient of Cu2+ (cm2. S-1). And T is the absolute temperature (K).
The dimensionless groups most often used in convection mass transfer were( 53): Sherwood number Sh = kd/D → (16)
Schmidt number Sc = v/D → (17 )
Reynolds number Re= ud/v → ( 18 ) Where k mass transfer coefficient.
D, diffusion coefficient V, kinematics viscosity and.
d, distance from the entrance or leading edge.
Reynolds number was used in forced convection problem, while Groasshof number was used in the case of natural of dimensional analysis [53]. To obtain an overall mass transfer correlation under
the present conditions by using the method of dimensional analysis it is supposed that:
Sh = a Re b (Sc)0.33 → (19 )
By plotting log {Sh /(Sc 0.33) } against log (Re), a straight line is obtained, its slope gives the constant b,. while the intercept gives the constant a, and C = 0.33 (indication forced convection).
Figure (7.a – 7.g): show the overall mass transfer correlations for all organic aldehydes used. The equations obtained are as the following:
I- For formaldehyde : Sh = 0.1935 Re 0.7176 → (20) 2- For acetaldehyde : Sh = 0.2608 Re 0.7175 → (21) 3-For paraldehyde : Sh = 0.2541 Re 0.7171 → (22) 4-For salicyladehyde : Sh = 0.2465 Re 0.7164 → (23) 5- For benzaldehyde : Sh = 0.2615 Re 0.7202 → (24) 6- For anisaldehyde : Sh = 0.2451 Re 0.717 → (25) 7- For tolualdehyde : Sh = 0.2535 Re 0.7183 → (26)
5 10 15 20 25
120 140 160 180 200 220 240 260 280 300 320 L im it in g C u rr e n t ( m A ) W 0.7 10-5 5*10-5 10-5 10-3 5*10-3 B
5 10 15 20 25
120 140 160 180 200 220 240 260 280 300 320 340 L im iti n g C u rr e n t (m .A ) W 0.7 10-5 5*10-5 10-4 10-3 5*10-3 A
5 10 15 20 25
100 120 140 160 180 200 220 240 260 L im it in g C u rr e n t ( m A ) W 0.7 10-5 5*10-5 10-4 10-3 5*10-3 D
2 4 6 8 10 12 14
[image:16.612.92.510.109.672.2]
5 10 15 20 25
80 100 120 140 160 180 200 220 10-5 5 *10-5 10-4 10-3 5*10-3 L im it in g C u rr e n t ( m A ) W 0.7 F
5 10 15 20 25
140 160 180 200 220 240 260 280 L im iti n g C u rr e n t ( m A ) W 0.7 10-5 5 *10-5 10-4 10-3 5*10-3 E
5 10 15 20 25
120 140 160 180 200 220 240 260 280 L im it in g C u rr e n t ( m A ) W 0.7 10-5 5*10-5 10-4 10-3 5*10-3 G
Figure 6. The relation between Il and W 0.7 for aldehydes at different concentrations. Where ( a: for
formaldehyde, b: for acetaldehyde, c: for paraldehyde, d: for benzaldehyde, e: for salicylaldehyde, f : for anisaldehyde, and g: for tolualdehyde )
y = 0.7175x - 0.2608
0 0.5 1 1.5 2 2.5
2.47 2.67 2.87 3.07 3.27 3.47
Log Re L o g S h / ( S c ) 0 .3 3 B y = 0.7176x - 0.1935
0 0.5 1 1.5 2 2.5
2.5 2.7 2.9 3.1 3.3 3.5
[image:17.612.104.507.66.466.2]
y = 0.7202x - 0.2615
0 0.5 1 1.5 2 2.5
2.3 2.5 2.7 2.9 3.1
Log Re
L
o
g
S
h
/
(
S
c
)
0
.3
3
D
y = 0.7171x - 0.2541
0 0.5 1 1.5 2 2.5
2.2 2.4 2.6 2.8 3 3.2
Log Re
L
o
g
S
h
/
(
S
c
)
0
.3
3
C
y = 0.717x - 0.2451
0 0.5 1 1.5 2 2.5
2.2 2.4 2.6 2.8 3
Log Re
L
o
g
S
h
/
(
S
c
)
0
.3
3
F
y = 0.7164x - 0.2465
0 0.5 1 1.5 2 2.5
2.3 2.5 2.7 2.9 3.1 3.3
Log Re
L
o
g
S
h
/
(
S
c
)
0
.3
3
E
y = 0.7183x - 0.2535
0 0.5 1 1.5 2 2.5
2.23 2.43 2.63 2.83 3.03 3.23
Log Re
L
o
g
S
h
/
(
S
c
)
0
.3
3
G
Figure 7. The relation between Log Re and Log Sh / (Sc) 0.33 for aldehydes at different
concentrations where ( a: for formaldehyde, b: for acetaldehyde, c: for paraldehyde, d: for benzaldehyde, e: for salicylaldehyde, f : for anisaldehyde, and g: for tolualdehyde )
4. CONCLUSION
Electropolishing of copper in phosphoric acid is considered as corrosion rate of copper. It is measured by measuring the limiting current .
[image:18.612.116.531.68.540.2]
• The rate of inhibition ranged from 14.3 - 61.9 % depending on the type of the aldehyde and its concentration.
• The corrosion rate increases by increases the temperature and the activation energy of the reaction is less than 40 k. j. i.e. the reaction is diffusion controlled. All aldehydes verify Flory – Huggins and Kinetic Adsorption Isotherm.
• Dimensionless group were calculated which indicated that the corrosion process takes place by forced convection.
References :
1. P.T. Gilber and L.L. Shreir, Copper and Copper alloy in Corrosion, second ed., Newnes-Butterworths, London, UK, 1976, P.436
2. J.R. Weeks and G.R. Hill, J. Electrochem. Soc. 103 (1956) 203 3. D.P. Gregory and Riddiford, J. Electrochem. Soc. 107 (1960 ) 950 4. J. Bumbulis and W.F. Graydon, J. Electrochem. Soc. 109 (1962) 1130 5. R. Otsuka and Uda, Crros.Sci. 9 (1969) 703.
6. R. Schumacher, A. Muller and W. Stockel, J. Electroanal. Chem. 219,(1987), 311.
7. A.H. Moreira, A.V. Beriedefti, P.L. Calo and P. T. A. Sumodjo, Electrochim. Acta 38 (1993) 981. 8. K.A. Altura and H. Nobe, Corrosion 28 (1972) 345.
9. R.J. Chin, D. Altura and H. Nobe, Corrosion 29 (1973) 472 10. L.F.A Da Costa and S.M.L. Agostinho, Corrosion 35 (1989) 472
11. G. Moretti, V.V. Molokanov, G. Quartarone and A. Zingales, Corrosion 54 (1998) 135. 12. K.F. Khaled and N.I. Hackerman, Electrochim. Acta 49 (2004) 485.
13. D.Q. Zhang, L.X. Gao and G.D. Zhou, Corros. Sci. 46,(2004),3031.
14. A.G. Christy, A. Lowe, V. Otieno-Alego, M. stoll, and R.D. Webster, J.Appl. Electrochem.34 (2004) 225.
15. C. Wang, S. Chen and S. Zhao, J.Electrochem.Soc. 151 (2004) 11.
16. Y. Ma H, C. Yang, B.S. Yin, G.Y. Li and S. Chen, J.L. Luo, J.Appl. Surf. Sci.218 (2003) 143. 17. H. Otmacic and E. Sttupnisek-Lisac, Electrochim. Acta 48 (2002) 985.
18. M.A. Elmorsi and A.M. Hassanein, Corros.Sci.41 (1999) 2337.
19. M. Scendo, D. Poddebniak and J. Malyszko, J. Appl. Electrochem.33 (2003) 287.
20. H. Otmacic, L. Telegdi, K. Papp and E. Stupnisek-Lisac, J. Appl. Electrochem., 34 (2004) 545. 21. A. Dalali, B. Hammouti, R. Touzani, S. Kertit, A. Ramdai, and K. Elkacemi, Anti-corros. Methods Mater. 49 (2002) 96.
22. M. Al-Khrafi and Al-Hajar, Corr. Sci., 28 (1988) 163.
23. M.G. Fontana and K.W. Staehle, Advances in Corrosion Science and Technology, vol. 1, plenum press, New York, (1970).
24. P.A. Jaquet, Trans. Electrochem. Soc. 69 (1936) 629.
25. N. Hackerman and R. Hard, "First International Congress of Metallic Corrosion", Butterworth, London, 166(1962).
26. Walton, J Electrochem. Soc. 97 (1950) 219.
27. C.R. Wilke, M. Eiesenberg and C.W. Tobias, Chem. Eng. Prog. 49 (1953) 663. 28. N. Hackerman and Makirides and, Ind. Eng. Chem. 39 (1954)790. 29. F. Mansfeld and Kenkle, Corr.Sci. 15 (1975) 767.
30. J.D. Talati and J.M. Pandya, Br. Corr. J. 16 (1976) 603. 31. A.A. Taha, Bulletin of Electrocherm 9 (1993) 80 32. A.N. Frumkin, Z.Phys.Chem. 116 (1925) 446.
33. U. Ateya, B. EL-anadouli and F. EL_Nizamy, Corros.Sci. 24 (1984) 509. 34. K. Kannan and Chandradrase, Bull.Electrochem. 20 (2004) 471.
36. E.E. Ebenso, U.J. Ekpe,B.I. Ita and O.E. Offioing,U.J.I .book, Mater.Chem. Phys., 60(1999) 79. 37.E.E. Ebenso, Bull. Electrochem., 19 (2003) 209.
38. D. Talati and M. Darji, J. Ind .Chem. Soc. 65 (1988) 94. 39. E.A.Noor, Mater. Chem .Phys., 114 (2009) 533.
40. H.Ashassi-Sorkhabi,B.Shaabani,And D.Seifzdeh, Electrochim. Acta, 50 (2005) 3446. 41. R. Solmaz, G.Kardas,B. Yazici, M.Erbil, Colloids Surf. A Physicochem. Eng. Aspects, 312 (2008). 42. E.Malkoc, Y.Nuhoglu, J. Hazard. Mater., 127 (2005) 120.
43. E.Malkoc, Y.Nuhoglu, M.Dundar, J. Hazard. Mater. 138 (2006) 142. 44. Y.Nuhoglu, E.Malkoc, Bioresource. Tech. 100 (2009) 2375.
45. M. Quinet, F.Lallemand, L.Ricq, J.Y.Hihn, P.Delobelle, C.Arnould, Z.Mekhalif, Electrochim. Acta , 54 (2009) 152.
46. H.M.A. Soliman, Appl. Surf.Science, 195 (2002) 155.
47. G.M.El-Subruiti, S.S. Massoud, Transition, Met. Chem., 25 (2000) 344. 48. B.G. Atya, B.E. El-Anadouli and P.M. El-Nizamy, Corros.Sci., 24 (1984) 321.
49. B. Al-Anadouli, F. Eltaib, F. El- Nizami and B.B.B. Ateya, Extended abstracts of the electrochemical soc. fall meeting, chigaco, 188 (1988).
50. P.H. Strickland and F. Lawson, Proc. Aust. Inst. Min.Met., 236 (1970) 25.
51. M. Eisenberg, C.W. Tobias and .C.R. Wilk 'lonic Mass Transfer and Concentration Polarization at Rotating Electrodes", J. Electrochem. Soc., 101 (1954 306.
52. A.A. Taha., S.H. Sal lam , A.M. Ahmed, Anti. Corr., 41 (1994) 10. 53. A.M. Ahmed, G.B. Mohamed , J. Chin. Chen. Soc (Taiwan), 2 (1989) 78.
© 2012 by ESG (www.electrochemsci.org)