By
Edy Juwono Slamet
A thesis submitted in partial fulfilment of the requirements for the degree of Master of Arts in Demography
at the
Australian National University
DECLARATION
Except where otherwise indicated this thesis is my own work.
I would like to express my gratitude to Dr Paul A. Meyer, my
supervisor and Dr Terence H. Hull, my advisor. This thesis would not
have been completed without their encouragement, guidance and
constructive suggestions. I am grateful to Chris McMurray for her
assistance and constructive suggestions on the final draft of the
thesis. As well, I am also grateful to all the staff of the Menzies
Library for their assistance with references.
I would also like to thank the Australian Government for providing
me with the scholarship and the Australian National University for
giving me the opportunity to participate in the MA Program in
Demography.
Finally, my gratitude goes to my wife, Thalita Hadiah and my
ABSTRACT
This study has examined the levels, trends and differentials of
infant and child mortality, fertility and migration in East Java. Based
on these findings, alternative projections of the population from 1980 to 2000 were made, and the implications of these projections for school
enrolment and the labour force were discussed. The main analysis was
based on the 1980 census and the 1980 East Java Population Survey.
In general, the results of this study confirm that infant and
child mortality have decreased gradually, probably as a result of social
and economic development. The age specific fertility rates also have
decreased since the mid-1960s. The results also reveal mortality and
fertility differentials according to urban-rural residence, maternal
education and age of mother. The total fertility rate in East Java was
one of the lowest among all provinces in Indonesia, and the annual
growth rate of East Java was lower than the national level. In balance
East Java had no out-migration.
East Java, in terms of size of population is the largest of the 27
provinces in Indonesia with 29.2 million in 1980. The population will
continue to increase to the year 2000, ranging from 36.0 million to 38.8 million depending on the rates of fertility decline and out-migration. Primary school enrolments are not expected to increase rapidly, because
of already high levels of enrolment and declines in fertility, but
secondary school enrolments should continue to increase due to an
CONTENTS
Page
Chapter One - Introduction 1
1.1 Objectives of the study 1
1.2 Historical growth of population: Review 2
1.3 Population growth in Indonesia: Review 5
1.4 Geographical background 11
1.5 Plantation and agricultural production 12
1.6 General demographic background 16
1.7 Age structure 18
1.8 The quality of data 26
Chapter Two - Mortality 32
2.1 Introduction 32
2.2 Infant and child mortality rates 37
2.3 Life table and expectation of life 42
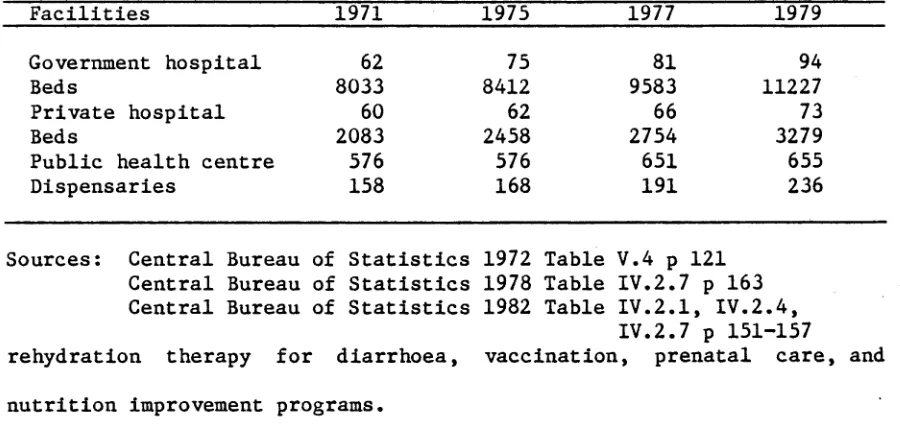
2.4 Causes of declining mortality 43
Chapter Three - Fertility 47
3.1 Introduction 47
3.2 Age specific fertility and total fertility rates 49
3.3 Determinants influencing declining fertility 52
3.3.1 Age at marriage 57
3.3.2 Frequency of marriage 60
3.3.3 Educational attainment 62
4.1 Introduction 67
4.2 Sources of migration data 70
4.3 Volume, direction and characteristics of migrants 73
4.3.1 Volume and direction of life-time migration 73
4.3.2 Inter-provincial life-time migration 74
4.3.3 Life-time migration of East Java 76
4.3.4 Recent (five-year) migration 78
4.4 Characteristics of migrants 81
4.4.1 Age and sex structure 81
4.4.2 Main occupation 83
4.4.3 Educational Attainment 83
Chapter Five - Population Projections and Implications 87
5.1 Introduction 87
5.2 Basic data and assumptions 88
5.2.1 Basic data 88
5.3 Results and implications of population projections 91
5.3.1 Projection of the school enrolment population 94
5.3.2 Projection of the labour force 99
Chapter Six - Summary and Conclusion 108
LIST OF TABLES
Page 1.1 Population of Java-Madura in 1975-1950 7 1.2 Population and growth rate of Indonesia, 7
Java-Madura and East Java, 1930-1980
1.3 Population and average annual growth for Regencies 13 and Municipalities: East Java, 1961-1980
1.4 Sawah area and index of growth by residencies: 14 East Java 1880-1979
1.5 Harvested area, production and yield per hectare 19 of food crops: East Java 1971-1980
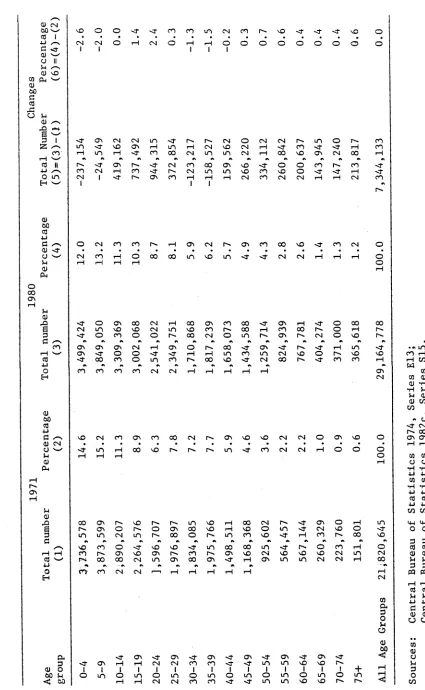
1.6 Population and changes by age group: East Java 20 1971-1980
1.7 Survival ratio: population of East Java 1971-1980 21 1.8 Survival ratio: urban East Java 1971-1980 22 1.9 Survival ratio: rural East Java 1971-1980 23 1.10 Analaysis of age-sex distribution: East Java 30
1971 and 1980
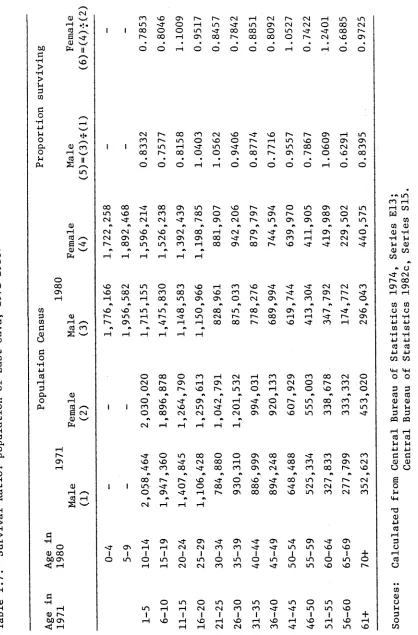
2.1 Crude death rates: Java 1930-1960 33
2.2 Estimates of infant mortality rates by various 35 methods: Indonesia 1971 and 1980
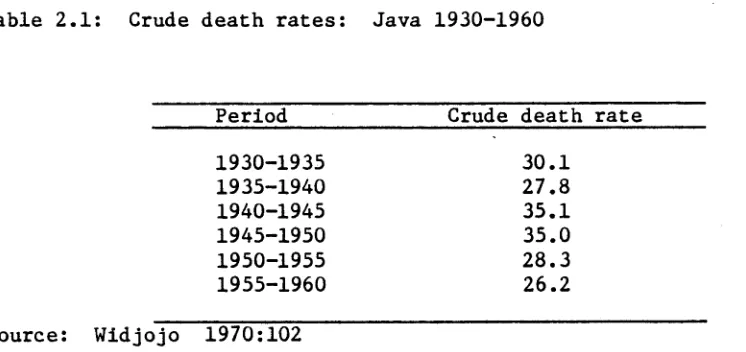
2.3 Estimated value of q(0) based on various sources of 36 data and employing West and South model life tables:
Indonesia 1971, 1976, 1979 and 1980
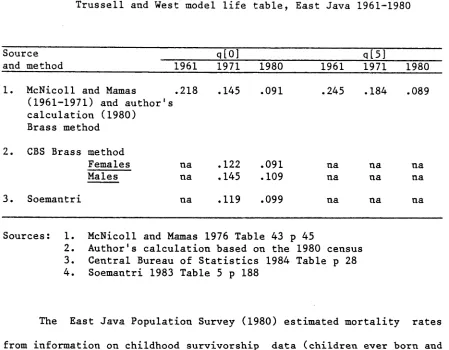
2.4 Values of q(0) and q (5) from various sources using 38 Brass and Trussell and Western model life table,
East Java 1961-1980
2.5 Infant mortality rates from childhood survivorship 39 data by sex using South model life table: East
Java 1974, 1976 and 1978
2.6 Infant mortality rates estimated from childhood 40 survivorship data, both sexes by area of residence
and education of mother by Sullivan method and South model life table: East Java, 1974, 1976 and 1980
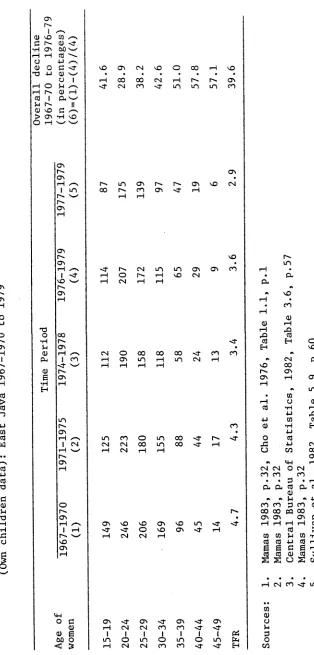
3.1 Estimates of fertility rates by age of women from 49 various censuses and surveys (own children data):
East Java 1967-1970 to 1979
3.2 Estimates of fertility rates by age of women (from 51 various censuses and surveys): East Java 1965—
1970 to 1979
3.3 Mean number of children ever born to ever-married 54 women by age: East Java 1971, 1973, 1976 and 1980
3.4 Average parity (completed family size) of ever 56 married women aged 45-49 by place of residence and
age at first marriage: East Java 1980
3.5 Average parity of ever married women aged 10-49 by 58 place of residence and age group: East Java 1980
3.6 Percentages of never married women by age and 59 singulate mean age at marriage in East Java 1961,
1971, 1976 and 1980
3.7 Average parity of ever married women by age, 61 frequency of marriage and place of residence:
East Java 1980
3.8 Average parity of ever married women aged 15-49 by 64 educational attainment: East Java 1980
3.9 Average parity of ever married women aged 10-49 by 65 age group and used contraception: East Java 1980
4.1 The Migration Questionnaire in the 1971 and 1980 73 population censuses
4.2 Broad patterns of lifetime migration in Indonesia, 73 1971 and 1980 (in thousands)
4.3 Life-time migration rates, 1971 and 1980 (as 75 percentage of enumerated population)
4.4 Volume of life-time migration: East Java 1971 and 77 1980
4.5 Volume of recent migration: East Java 1980 80 4.6 Age distribution and sex ratio of life-time in- 82
4.7 Population and life-time in-migrants 10 years of age 84 and over by type of main occupation: East Java 1980
4.8 Educational level of population and life-time 85 migrants 10 years and over: East Java 1980
5.1 Projected total population (in thousands) and 92 annual rate of increase (per cent): East Java
1980-2000
5.2 Projected population by broad age group (in 93 thousands) and age distribution (per cent)
5.3 Existing and projected school enrolment rates: 96 East Java 1971-2000
5.4 Number of schools, teachers, pupils and pupil ratio 96 at primary schools, junior high schools and senior
high schools: East Java 1971 and 1980
5.5 School projections (in thousands): East Java 1980- 97 2000
5.6 Existing and projected labour participation rates 101 by sex and age group: East Java 1980-2000
(Kristianto assumption)
5.7 Existing and projected labour force population by 104 sex and age group (in thousands): East Java
1980-2000 (Cho et al assumption)
5.8 Existing and projected labour force by sex and age 105 group (in thousands): East Java 1980 and 2000
(Kristianto assumption)
5.9 Existing and projected labour force population by 106 sex and age group (in thousands): East Java 1980
LIST OF FIGURES
Page
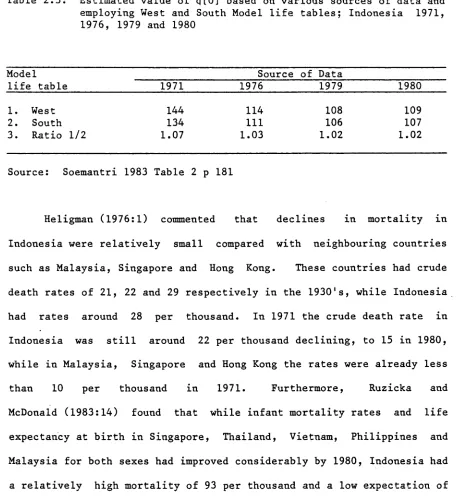
1.1 Single year age pyramid of East Java 1980 24 1.2 Five year age pyramid of East Java 1980 25 1.3 Single year age pyramid of East Java, Urban 1980 27 1.4 Single year age pyramid of East Java, Rural 1980 28
2.1 Crude death rate in Java, 1873-1960 34
LIST OF MAPS
INTRODUCTION
1.1 THE OBJECTIVES OF THE STUDY
The nature of population growth in Indonesia has been debated by demographers, especially trends during the nineteenth century, but there is agreement that since independence the nation has exhibited continuing
increases in its growth rates. East Java has unique demographic
characteristics which distinguish it from the other 26 provinces in
Indonesia. Population censuses and surveys have found that the
fertility rate in East Java was lower than in the other provinces, and
that natural increase is one of the lowest within Indonesia and
considerably lower than the national level.
The main objective of this study is to examine population trends
in East Java based on the 1971 and the 1980 population census data. The
particular aims are as follows:
1. to describe the trends of mortality, fertility and migration
between the 1971 and the 1980 population censuses, and also to
examine the causes and consequences of these trends.
2. to make some population projections to the year 2000 and consider
on analysis of the 1971 and the 1980 population censuses, and the 1980 East Java Population Survey (EJPS). The two censuses were carried out in September 1971 and October 1980, and the EJPS in May-June 1980 by Central Bureau of Statistics (CBS). Published materials are used for the basic analysis of this study. Other censuses and surveys are also referred to and comparisons are made to assess levels and trends in mortality, fertility and migration. The population projections were made using the 1980 census data, adjusted for age mis-reporting by the United Nations method.
The first Chapter of this study examines the theories of population growth and their application to Indonesia, and then surveys the general demographic and socio-economic situation in East Java. The following three Chapters analyse in detail the published results of the various censuses and surveys with regard to mortality, fertility, and migration in East Java. The final Chapter applies the conclusions from these analyses to produce a series of projections of the total population, school enrolment and the labour force, and to examine their implications.
1.2 HISTORICAL GROWTH OF POPULATION: REVIEW
3
population grew slowly. During the second stage in the latter part of the eighteenth century the death rate fell due to improvements in medical knowledge and public health. By these means the death rate was brought under a measure of human control, but the birth rate remained high and uncontrolled and consequently there was a period of very rapid increase of population. The third stage occurred in the nineteenth century when the birth rate also became subject to control as a result of industrialisation, urbanisation, the growth of per capita income and increases in productivity. At this time human beings began to plan their family size. Although population continued to grow very substantially in absolute terms for several decades thereafter, the rate of growth began to decline.
Malthus argued in his 1798 essay that population, when unchecked, goes on doubling itself every twenty-five years, or in a geometrical ratio. "A thousand million people can just as easily double every twenty-five years by the power of population as can a thousand people. While the subsistence for mankind which the earth affords might be increased every twenty-five years by a quantity equal to what it at present produces, it could not possibly be made to increase faster than in an arithmetical ratio" (Malthus 1970:8-30).
Some economists argue against Malthusian ideas, and the relationship of population growth and economic development has been an issue of debate between them and and demographers. There are three main schools of thought. On one side are the nationalists, who argue that population growth stimulates development. The Prime Minister of Malaysia is one example, as he has stated that Malaysia needs a
relationship exists and that other social welfare problems associated with low levels of economic development are a result of unjust social and economic institutions, not population growth. Marx and Engels pointed out that the consequences of population growth as discussed by Malthus were really the result of the capitalist economic system and of society, not of population growth per se. The third group are the Neo-Malthusians, who are strong advocates of birth control as a check, to population growth, although Malthus was opposed to birth control as being a "vice** (Weeks 1982:28-32). This group has raised public consciousness about population growth and the possible effects of recent growth. Ehrlich (1968:9-19) states that there are too many people in the world in relation to resources to provide the necessities and amenities of life. For example, only ten countries grew more food than they needed in the 1960s and all the others (including China, India and Russia) imported more than they exported.
5
(1967:107) also took this view and argued that there was little evidence of any significant association, positive or negative, between income and population growth rates. Kuznetz (1979:308) in his analysis of 40 countries in Asia, Africa and Latin America, concluded that there was not a significant negative growth of per capita product with increasing population. Thirwall (1972:331-352) examined the percentage change in population between 1950 and 1966 in 32 countries, and found very little support for the notion that programmes for controlling population growth will have much of an impact on the growth of output per head. Black (1962:132-133) refuted arguments that a large population implies a good market for a country's products. He said this theory can conceivably be true in the circumstances of a rich country with resources to spare, but it seems irrelevant to most of the developing countries.
In general, the pattern of historical population growth is modified in its details from country to country by the peculiarities of
social institutions and cultural traditions. Lucas (1980:31-33) said that in Western Europe enough differences existed between countries to throw doubt on the transition theory, and there are many problems in applying the theory to developing countries. In Europe the mortality decline was more gradual and more obviously related to socio-economic development, while developing countries had unprecedented rates of growth due to rapid mortality decline.
1.3 POPULATION GROWTH IN INDONESIA: REVIEW
the population of According to the 1980 population census,
mass. Java is characterised by wet rice agriculture, fertile volcanic soils, high agricultural productivity and high population density. Other islands have mainly swidden agriculture, alkaline soils, low agricultural productivity and low population densities (McDonald 1980:81).
During the nineteenth century population data were compiled and reported in a number of sources (see Table 1.1). These data have been examined by demographers such as Widjojo (1970), Peper (1970) and Breman (1971) who have made their own estimates based on these records. However the data relate almost exclusively to Java, as information on the other islands was primarily guesses, limited to the areas of Dutch exploitation, and based mainly on reports by local leaders
(Widjojo 1970:61, Breman 1971:19).
T a b le 1 .1 : P o p u la ti o n o f J a v a -M a d u ra in 1 7 7 5 -1 9 5 0 7 c . j-i o T3 C 3 ÖC O SC u 3 rH •H a . S o CJ 3 03 > T3 3 03 M 03 . 3 CJ 03 s h 3 T3 03 P4 -C 00 3-1 3 jO 3 03 03 03 2 CO I—I 03 03 3 03 03 Q Ö0 03 r—I CO 3-1 03 > r— I
03 •H 3 o I—I o 00 03 i—I CO 3-i 03 > rH 03 •H 3 O i—1 O o CO ON 1—I I o on a s r—l 03 > 03 4-J CO 03 W 03 C 03 03 }-i 3 03 03 2 I 03 > 03 03 •H CO 03 3 O 03 3 W o-i O 3 O •H -u 03 pH 3 a. o (U
L n o r ^ o o o c T i i H r H O O O O r ^ < r < N | O'» O rH O O cm i—I C T i O r ^ - o O L n i —i\T) C N i O < f i ^ r v H H o o Oi n NOr ^ r - MDc o c o
C M r O r O C O C O M j - O N O O CM
< r c o Cu
rH 03 • I—I CM
-O rH
03 • H O.
0) 4-J 03 3- i rC 4- J 3 O M 00 T3 3 03 - 3 4-1 5 /**N O 03
coj 03 4-J 3 3 a >j < &
3 to 03
U 03 03 4-1
> 3
< Pd
CO O t o CM CM rH
rH ON l O CM rH I—I
CO CM I- 1 rH
O co a s co 03 3 03 co 3 O X 4-J c •H o o •H 4-J 03 I—I 3 a o P-r I o CM CN O oo ON
00 00 03
• • 3
<H rH
o r"-MT rH CM CO CM as rH I—I O CM rH a s CM o rH lO f"-a s s o I—I a s CM CM m in CM a. PQ
rH O 3
r-» O
a s a s -H
I-i I- 1 4-J 3
3 0 rH
3 •(-) 3
S o a.
03 •!—) O
03 33 Ph
3-i -H PP 5
CM
3_i m m c M r - ^ o m o o 3 r ^ c T i O O ^ H r H i n m
3 r ^ r ^ 0 0 0OcO0000CT\ ?r4 I rH rH rH rH rH rH rH rH
CO 03 U 3-4 3 O C/3 rH 03 rH rO 3 EH O CM O'* rH O o co 00 Mf ON CM < r <r CO 3 3 03 3 3 3
3 3 3
O -H •H > OO o 3 3-4
Ctf PU
3 3j
3 3 3
•H 03 >
3 3 3
3 £ •->
3 I
0 3 4-J
0 3 > CO
3 3 3
H J-3 W S
concluded that during the nineteenth century famines were brought under control by improvements in communications, public health, and law and order. Widjojo (1970) and Peper (1970), however, rejected such arguments, pointing out that famines were not eliminated during that time, and that vaccinations were available only for smallpox and thus did not significantly reduce mortality because there was no treatment for other major diseases such as cholera, plague and beri-beri (Peper 1970:79-80). Keyfitz (1953:647) noticed that the rate of growth during the nineteenth and early twentieth centuries was highly irregular due to epidemics and crop failures in the middle of the nineteenth century, floods in 1861, crop failures in 1901 and 1902 and the influenza epidemic in 1918-1919.
Under the infamous cultuur stelsel a peasant's land taxes were eliminated on his undertaking to cultivate government export crops on one-fifth of his fields, or alternatively work sixty days of the year on government owned estates or on other projects (Geertz 1963:52-53). This system was designed by the Dutch to increase production of and concentration on export crops for their own benefit at minimum cost, especially for labour. This system resulted in the production of crops such as sugar and coffee increasing sharply because of technical improvements and modernised irrigation. But Manderson (1974:53) commented that the cultuur stelsel seemed to bring only little wealth to the indigenous people, as most products and profits were shipped to Netherlands.
estimates. Breman (1971) suggested a figure of around 6 million for 18ÜÜ with a rate of growth of 1.4 per cent per annum for 1800-1850, and 1.75 per cent per annum for 1850-1900. Peper (1970) suggested a figure of between 8 and 10 million for 1800, with a growth rate of only 0.5-1.0 per cent per annum from 1800 to 1850. Both agreed that the annual growth rate during that period was less than 2.0 per cent. Widjojo (1970:75) estimated the annual growth rate during 1920-1930 to have been 1.5 per cent. Keyfitz (1953, quoted in Manderson 1974:14-15) estimated a higher annual growth rate during 1920-1930 than Widjojo, 1.7 per cent for Java and 2.8 per cent for the other islands.
Ma
p
o
f
I
n
d
o
n
e
s
i
a
I
n
d
o
n
e
s
t
a
Oc
ea
1.4 GEOGRAPHICAL BACKGROUND
The location of East Java is shown in Map 1. East Java consists of the main section which extends between Central Java and Pasuruan with the Eastern Hook extending from Pasuruan to the Straits of Bali. The north of the main section is mainly lowland while the south hilly to mountainous. The Eastern Hook is largely lowland with three volcanic masses. Some of the volcanoes in East Java are quite active. In the north-east there are a number of islands, the largest being Madura. The largest rivers in this province, the Brantas and Solo, deposit on their flood plains fertile alluvial materials derived largely from the rich, basic volcanic soils in the head waters.
Before the Dutch colonial government established an irrigation system, the people of Java had already practiced primitive methods of irrigation such as making simple reservoirs with traditional tools. In East Java the Dutch colonial government introduced a western irrigation system in the Sidoarjo Delta in the nineteenth century (Booth 1983:3-6). This expanded the cultivated areas and was followed by in-migration.
The name "Java" was derived from the Sanskrit "Java Dwipa" which means "Rice Island", and rice probably was grown by the early inhabitants before the coming of the Hindus in the fifth century. Booth (1983:5-7) noticed that all the residencies in East Java had sawah areas (flooded fields for the cultivation of rice), and these areas expanded from 1888 to 1979 (except for Surabaya residency from 1959-1979). During 1971-1980 rice production in East Java grew steadily, as shown in Tables 1.4 and 1.5.
In Java, more than one crop of rice can be grown in a season in the same field. In areas where irrigation is adequate, 2 or even 3 crops of rice may be grown in a year. In other drier areas, secondary food crops (palawija) alternate with rice, and these include maize, millet, cassava, ground nuts, sweet potatoes, soya beans and green peas. The data in Table 1.5 indicate that the production of maize, cassava, peanuts and soya beans rose during 1971-1980, while the production of sweet potatoes declined because the planted area declined, even though the yield rate per hectare increased.
Table 1.3: Population and average annual growth rate for Regencies and Municipalities: East Java, 1961-1980
Average Annual
Region Total Population Growth Rate
1961 1971 1980 1961-71 1971-80
1. Pacitan 431,022 476,562 478,037 1.02 0.03
2. Ponorogo 699,865 738,756 783,381 0.55 0.65
3. Trenggalek 438,857 521,279 564,542 1.76 0.88
4. Tulungagung 675,349 759,850 833,323 1.20 1.02
5. Blitar 839,952 950,802 1,037,258 1.26 0.96
6. Kediri 918,036 1,080,695 1,235,265 1.66 1.48
7. Malang 1,474,106 1,706,055 2,045,939 1.81 1.63
8. Lumajang 657,487 786,628 874,516 1.83 1.17
9. Jember 1,501,763 1,706,271 1,881,091 1.30 1.08
10. Banyuwangi 1,063,533 1,304,367 1,420,837 2.08 0.95
11. Bondowoso 503,460 554,229 612,160 0.98 1.10
12. Situbondo 432,047 470,107 525,046 0.86 1.22
13. Probolinggo 656,007 756,375 866,318 1.45 1.51
14. Pasuruan 729,367 872,792 1,034,967 1.83 1.89
15. Sidoarj o 541,051 667,639 854,298 2.15 2.75
16. Moj okerto 494,492 596,185 705,596 0.91 1.87
17. Jombang 686,362 812,485 941,988 1.72 1.64
18. Nganjuk 675,906 704,590 882,832 1.39 1.45
19. Madiun 509,428 583,934 640,561 1.39 1.02
20. Magetan 498,435 557,081 608,820 1.13 0.98
21. Ngawi 582,317 694,079 769,286 1.79 1.14
22. Boj onegoro 708,571 862,428 999,418 1.99 1.64
23. Tuban 638,184 748,657 871,898 1.63 1.69
24. Lamongan 772,599 909,038 1,049,956 1.66 1.60
25. Gresik 666,002 610,944 729,039 0.93 1.97
26. Bangkalan 574,346 631,455 688,362 0.96 0.95
27. Sampang 484,886 535,615 604,541 1.01 1.34
28. Pamekasan 396,413 455,362 539,055 1.42 1.86
29. Sumenep 694,547 762,616 854,925 0.95 1.27
30. Kediri 158,918 178,865 221,830 1.20 2.40
31. Blitar 62,972 67,856 78,503 0.76 1.62
32. Malang 341,452 422,428 511,780 2.17 2.14
33. Probolinggo 68,828 82,008 100,296 1.79 2.24
34. Pasuruan 63,408 75,266 95,864 1.75 2.70
35. Moj okerto 51,732 60,013 68,849 1.51 1.52
36. Madiun 123,373 136,147 150,562 1.00 1.11
37. Surabaya 1,007,945 1,556,255 2,027,913 4.48 2.96
Total 21,923,020 25,526,714 29,188,852 1.59 1.49
Notes: Nos. 1-29 are Regencies
Nos. 30-37 are Municipalities.
[image:24.559.58.504.131.738.2]r'»
On
r—I I ON LO CTi
ON O ' —I O CO O CN
O'r O O H O rH H
H r—i H I—I rH t—I
X ■U
5
O
H
O
r-'. <y\
H
I O
CO oo 1—I
on 03 oo n m
rH c cn -<r m c-o o
rH rH rH rH CM rH
03 > 03 l- 3
H
co 03
W
CO
<13
•H
U c
03
-o •H
CO
03
>-i
X
X
u Z o H
00
<H o
X
03
03
C
•H
03
fi
03
03
03 )-i
03
X
03
03
cn
<r
03
rH
X I
03
H
iO O 00 0> O VO N
r^. rH SO VO rH 00
H CN H r—I H CN
ctn o r-« co oo x < r
r~' h x m to c j \ r-»
H CN H H H H
03
C
03
ro
cn o3 oo H oo i t x x c cn lo < r n t r->.
CN H H H H
CN «J ^ CN >J CO -<r
CN G cn o on x
CN H H
NT
03 C
03
CN
CO
03 H
X
03
H
oo
oo <30
U
c 03
03
•H
CO
03
OZ
o
u 03 O
sh oo
03 03 C *H 00 -H 03 X i C 33 )-i C X H 03 O -H -H 03 3 3
J_i •!-) 03 03 H CO 03
D O 03 03 CO 03 03
CO « 2 X S CO 2
X •U
o o
CQ
03
CJ
H 3 O
in West and Central Java. The largest sugar refinery in Java is located in East Java, in Jatiroto Jember residency.
Coffee was one of the main crops introduced by the Dutch in the
seventeenth century (Missen 1972:193). Coffee plantations were a
government monopoly during the colonial period and in 1915 the Dutch Indies was third among countries producing coffee for the world market. In East Java the coffee producing areas are the residencies of Kediri, Malang and Besuki.
Maize is grown as a first crop in dry fields, (tegal) and as a
second crop on sawah after the rice harvest. In East Java, the largest
areas planted in maize are in Pasuruan regency and Madura residency. Dry fields in East Java are also used for tobacco culture and important
areas for this crop are in Pasuruan, Kediri, Besuki, Bojonegoro and
Madura. Tea, indigo, cocoa, coca and kapok are also planted in East
Java. Vegetables and fruit are produced commercially, especially in
Malang residency. Teak forests in East Java are in Madiun and Kediri
residencies.
Booth (1983:6-10) examined the correlation between growth in
population and growth in area of sawah and found it to be very high and
significant. This finding was based on the data from the periods
1888-1928, 1928-1959 and 1959-1979 in Java. The areas where sawah
expanded most rapidly also experienced rapid population growth rates. Especially between 1888-1928, population growth was closely correlated
with expansion of the cultivated area. In this period the amount of
sawah increased rapidly in Java, and more than doubled in East Java.
Geertz (1963:70-77) stated that the 1920 data indicated that the sugar
resources which have attracted population since the Dutch colonial period. The man/land cultivated ratio of 0.1 hectares per inhabitant in 1979 (East Java Statistical Office, 1981:65), is an indication of the density of population.
1.6 GENERAL DEMOGRAPHIC BACKGROUND
According to the 1980 population Census, the total population of East Java was 29,169,004 or about 20 per cent of the total population of Indonesia, while the province comprises only 2.5 per cent of the country's land mass. The population censuses showed that the annual growth rates in East Java were 1.2 per cent during 1930-1961, 1.6 per cent during 1961-1971 and 1.5 during 1971-1980. These annual growth rates were lower than those for other provinces and also lower than the national level (see Table 1.2). The population density of East Java in 1980 was 609 persons per square kilometre, while in the previous census of 1971 the population density was 533. Eighty per cent lived in rural areas and the rest lived in urban areas.
rates, creating the Gerbang kertosusila Regional Development Project, which comprises Gresik, Bangkalan, Mojokerto, Surabaya, Sidoarjo and Lamongan regencies. The industrial region around Surabaya was expected to become a filter for urbanisation of Surabaya as it developed employment opportunities. This Project apparently has been relatively successful as the annual growth rate of Surabaya declined from 4.5 per cent during 1961-1971 to 3.0 per cent during 1971-1980, while Mojokerto and Gresik regencies have both doubled their annual growth rates in the same period (see Table 1.5). Sidoarjo regency increased from 2.2 to 2.8 per cent in the same period.
Growth rates in other parts of the province have also varied. The growth rate of Kediri and Blitar regencies during 1971-1980 was double that of 1961-1971. Kediri is one of the regencies which was prosperous and industrialised before independence and expanded in population size during that time. Pacitan, Banyuwangi and Trenggalek regencies had substantial declines in their annual growth rates in 1971-1980 compared with 1961-1971. The annual growth rate during 1971-1980 was less than 1 per cent and other regencies with annual growth rates of less than 1 per cent were Ponorogo, Blitar, Magetan and Bangkalan. These regions do not have enough arable land and some had successful family planning programmes that caused fertility to decline faster than mortality. They also had high rates of out-migration.
1.7 AGE STRUCTURE
with the same age groups in 1971, while the other age groups increased during 1971-1980.
Tables 1.7, 1.8 and 1.9 show that most five-year cohorts in 1980 had an intercensal survivorship ratio of less than unity, except males aged 25-34 and 60-64 and females aged 20-24, 50-54 and 60-64. The rural population had a similar pattern, because (as mentioned above) it comprises 80 per cent of the population. In urban areas most age groups had an intercensal survival ratio greater than unity. Urbanisation and in-migration from other regions is probably responsible for this.
T a b le 1 . 5 : H a r v e s te d a r e a , p r o d u c ti o n a n d y ie ld p e r h e c ta r e o f fo o d c r o p s : E a s t J a v a 1 9 7 1 -1 9 8 0 o co Os T—I
oo on m
r s o rs.
m m m 'O’ i— I os
SO f— I SO 'O QO
c o c o O '
so O Os 0) •H >-r s o s
CO I • o on o I— (
n o n
on
r--H O N
CO o o
n n c o
Ln on
I—
oo on r— I
CO
CO _C
0)
H XI
co C
CO XI Cfl
a; o
•u O
cn jz <u hi > >-> C c0 -H
X s-'
o CO OS
os un oo c n co on so- o <r
rH rH
rH o cn
s f < r i s
rH on M
M
> OS
-a cn c •
co Ci
on so so c n un m c n I— I <r
rH rH
<T SO CN so on co i— I on
CN •>
• r— I
l-H M M
> >
0) <u
I— I 1— 1
X I rQ co CO H H
on on Hs oo as as rH I— I
o oo as
co c
o o •H O HI o
U r
o o -a o O i-H u
CH C
•H
OS O CN rH O O rH SO OS
rH SO rH so H >J
OS sO sO 00 IS H
is N N
f\ c n rH on
CU QJ a cj •H -H 4-1 4-1 4-1 4-1
O O
sO sO CN c n oo cn oo <r on
O IS CS| o as so rs os O
CO CO
a a •H -H
-U HI
cn cn •H -H
HI HI CO CO HI HI
CO 00
O O on on on
n t rH cn co co> >
CO co
X) X
cn Qu O H CJ cn c
cn co
co a; cn a) > o HI JO >> 0) CO HI HI 3
x j n cn <u co G co o h cn a) h o i s CO cO cO 5 O <3 O
Pi 2 O cn cu cn oo
I— Ic n on -a m so
HI HI cn cn CO co
W W
T a b l e 1. 6 : P o p u l a t i o n a n d c h a n g e s b y a g e g r o u p : E a s t J a v a 1 9 7 1 a n d 1 9 8 0 G 00 G G -G 33
G I P
C < r
d) >— ' o II
P
0) nO PL w
G 2
G II
P X”P
O LO H w
G 00 G 4-1 G 0) o P G PH o 00 ON T— I G Ö0 G P G . G Ü P G PL rH pp ON r—I P G -G 6 3 C
r— I
G P 0 H CL 3 G O 00 P
< 00 CN
I CNI o rH CN o rHI oI o O O o o O O
o n cN
m O ' no I— I LO rH
p ' < r on co cn >h
cN I < r CN ON < r P' c o p~ <3-ON <r LO 00 CN r-. co pp >H CN CO CN
I— I
I t"» CN LO 00 m rH I CN NO m ON m
I— I
o CN CN NO NO CN CN
I— I
<r c o CO CN <r o o O NO CN p' co NO o o CN LO <r ON
O
r--<r rH
CN 00
c o r-p c o < r < r rH
I— I rH CN
O
CN c o rH iH iH c o o p«. 00 rH 00 ON LO CN NO r-p m ON <r c o "3
-00 CN NO CN p f rH CO rH CN tH NO
< r m
rH rH rH ON 00 CO NO 00 pp CN rp pp rp o n m NO 'O NO c o CN CN CN CN O rH ON O NO o 00 pp m NO c o Pp ON ON m c o pp 00 I--. o CN O ON 00 NO pp m <r NO CN pp O rp NO ON m rp ON 00 NO pp ON m oo O -3
-CO 00 NO NO pp m pp ON rH rH m #s o o ON <r o o NO cn oo NO I— I
CN O NO m CN ON pp m <■ pf NO m < r
r— I
Pp NO
m
ON O rH
CN NO O
co pp oo
o NO
CN
CO rH cN i n
CN rH
>3" I o
ON
I
m oI
ON rH m rH <r CN I o CN ON CN I m CN <r CO I o CO ON CO I m c o p3" <f I O <T ON ~3" I m pp < r m I o m ON m I m i n < r NO I o NO ON NO I m NO Lt pp I +
o in
pp pp
o CO c o rH < r < r c o o o rH
-O <r O ON 00 CN rH 00 ON CO 00 <r ON rH <r o 00 00 6 CN m NO NO CN m NO CO rp 00 rH CO 00 p' o rH p' 3 <r o CO o o O' 00 CN O m pp ON pp CN o NO p'
G ^P 0S es es a es es es es es es es r*
co ON ON ON CM rH ON O rp 00 < T ON < T rp < T rH m
rH P-' ON o o i— 1 rH m CO m CN NO O NO NO
G <r 00 CO o CO rp 00 NO pf CN 00 pp co CO rH
p es * es es 0S **
o CO CO CO CO CN CN r—\ rH rH i“H rH ON
H CN o o iH m < r NO o CN 00 rH CN 03 a. 3 O u o G 00
c
rH rH< So
[image:31.559.70.495.66.756.2]T a b l e 1 . 7 : Su rvival R a t i o : popula ti on o f E a s t J a v a , 1 9 71 -1 9 80 21 CM
0)5. M CO MO on CM iH CM CM rH m m
rH •! • m <r o rH m <r m ON CM CM o 00 CM CO i i CO o o m <r 00 co o m <r <r oo
E 00 rH a s 00 00 00 o r^. CM MJ ON
<U '—✓ • • • • • • • . • • . . .
00 Eh II O o i—l o o o o o rH o rH o o
c /^\ •H vO > •H > 3 w C
o /"~N
•H i—H
4J
U CM r-~ CO CO CM sO <r M0 1— ON rH m
o CO m o MO O iH m NO o ON ON
a 0) co i i CO m i—i < r m <T r-'. m 00 MO CM CO
o t—1 00 r-> 00 o o a s 00 ON O vO co
5-1 CO II • • . . • • • • • • . . •
Ph 2 /^N o o o r H iH o o O o O rH O o
m
00 00 00 On m M > r-~ mT o m ON CM m
m MO I— l CO CO 00 O o CJV ON o 00 o r »
CM < r CM CM H f r-~ ON CM m ON ON O N m m
0) A #s #k a r\ * #1
i— 1 CM CM MO MO CM 00 rH CM a s <r ON r H ON ON o
CO CM o n a s CM ON a s 00 <r co i— 1 r H CM
^d-E !-» 00 m m CO i— i 00 a s 00 MO Mt <r CM
a; 'w' ** * * #\
Eh r H r H rH rH r H rH
o
oo VO CM m o CO M3 r H CO s O CM CM CO
ON MO 00 m CO 00 vO vO CO ON <r o ON 1"» <r
r—1 T— 1 m i— i 00 m a s a s o CM ON CO o
A #* * * n A * 9% *
CO MO MO m m 00 o 00 m 00 ON ON CO Mf MO
3 o I— m i—i r- -<r m CM r- r- OO iH iH -cr r- ON
CO r H /*“N r-~ o n 'd- r H r H 00 00 MO MO <r CO iH CM
C CO CO ** A ä rv
CU S r H r H I— l i—l I— 1 rH
CJ
c o
•H
4-1
3 o 00 o CO iH CM iH co ON CO 00 CM o
i—I CM o n iH a s CO CO CO CM o r-» co CM
3 O 00 n* vO m o I—1 ON o MO CO O
a. <u * #\ * * r* r\ * n #N
o i— l o M> < r o n CM r H < r o r^. m 00 CO CO
P-l CO /^S 1 1 CO o n MO m <r o CTi CM O m CO CO m
E CM o 00 CM CM o CM ON ON M0 m CO CO <r
0) 'w' n
Eh CM t— i r H r H r H r H
1—1
r"- 'd- o m 00 o o a s 00 00 <r CO O N CO
o n MO MO <r CM 00 r H a s <r 00 CO CO ON CM
r—1 'd’ CO 00 < r 00 CO a s CM <r CO CO P-» M0
* rs r\ — n #1
00 r-> MO <r o M0 00 m CM
0) 1 1 m < r O o 00 CO 00 ON <r CM CM m
r—1/-N o a s < r r H o n 00 00 MO m CO CM CO
CO r H
S CM r H r H r H
Ö
•H 'd- a s o n a s ON Mf O N < r ON
o a s i— l i—i CM CM co co <r <r m m MO MO
<u00 i I 1 l 1 1 i i I I I l 1 1 +
00 ON o m O m O m o m o m o m o m o
<3r H r H T— 1 CM CM CO CO M T < r m m v£> MO
C
• H o m o m o m o m o m o
r H m I— 1 r H CM CM CO CO <r <r m m MO
0) I 1 1 1 l 1 i i i I I 1 +
OO o n r H MO i— 1 MO r H M) r H vO r H vO i—i MO r H
<3r H i— 1 i H CM CM CO co Md- N3- m m MO S
[image:32.559.58.476.117.752.2]T a b l e 1 . 8 : S u r v i v a l r a t i o : u r b a n E a s t J a v a 1 9 7 1 -1 9 8 0 oo G •H
> 3
•H rH
> 3 U 6 3 <3 in M-i
CM V_✓ •I* — s xr v_/ II
r— \
NO
<r i— I
o co
«d- co
CM LD
N O' N
ON CM rH
00 CO CO
XT rH o
rH r— I I— I I— I i— I
O'* NO CO
rH t— I rH
nO i-1 UO
O rH O
n o o n co <r
O xf CM On
oo uo <r co
CM ON CO CO
ON CM CM
o
rH I— I rH rH O rH O rH
G O •H 4-1 1-4 o Gr <3 O rH 1-4 CO Pu 6
CO
N— ■> II
I . iH CO O rH -xT
CM CO
rH rH
CM NO CO
px px uo
LO rH <•
CO CM CM
iH rH rH
nO ON nO
CO 00 O
n o c m <r
I— I rH O >H rH rH
<r px o n
rH UO ON NO -sf NO rH O I— I rH rH (H
uO CM
uo co
o vO
ON oo
o o
CO r—\ 6 <r OJ '— r Ch o 00 ON rH CO 3 CO G (3 U G O •H 4-4 cO rH 3 a, o G4
cO co
2 w
(3
rH
G /— s g CM (3 '— / Ch rH px ON rH (3 <H CO X ON uo NO o CO CO NO o CM ON <r co CM UO uo CO CO r-nO ON o CM co CO CM CO o CO uo
px uo
<r cm
CO co
ON ON xj-px No co co rH CM ON iH CO 00 ON px CM I— I CO 00 uo <r CO CM CO px co uo <r CM NO o <r 00 CO CM 00 ON rx co p-rH NO NO rH CO CO 00 CO px rH CM U0 ON xr NO rH px o 00 o NO CM o CM NO -d-rH ON NO 00 CO CO rH CM 00 I— nO rH rH rx on NO oo rH rH Px CM CM O i— I
ON UO ON uo p-CM ON NO Px
uo n o rx
00 CM CO <r p^ on
ON NO co <r oo ON uo ON
CO <rPx
oo co
co co
rH UO
I— I CO px -d-uo NO o NO CM
I— I CM 00 NO CM
i— I Ox ON co CM ON rH 00 co CM CO o o rH CM 00 uo 0\ ON o CM 00 uo NO rH CM 00 uo NO ON rH px NO O NO rH rH CO CO CO rH ON NO CO NO rH UO Px rH NO NO <T xT rH O UO r* ON CM
t— I co co rx CM rH p x CM CM rH
i— I 00 NO CM ON xd-uo ON p x NO px rH uo CM CO px xj-NO CM CO Px o ON Xf ON NO U 0 CO rx U0 rH i— I uo 00 CO xr co NO o U0 uo
•H *<r ON xt ON Xf ON xd- ON xr ON xf ON
O XT ON
1 rH1 rHI CM1 CM1 CO■ co1 XT1 ~d-1 uo■ uo■ NO1 NO1 <3 00
00 ON O1
1 m 1 o 1 LO l
O UO1 O1 1 UO
l O uo1
1
o uo■ o
1 uo
<J rH rH rH CM CM co CO xt xd- uo uo NO NO
G
•H o uo O U0 O uo O uo o uo o
rH m rH rH CM CM CO CO xd- xd- uo uo NO
<3 Px i 1 1 1 1 1 1 1 1 1 1 1
00 ON rH vO rH NO r—1 NO rH NO rH NO rH1 NO
< rH rH rH CM CM CO co xd- xd- uo uo
4
+
r H
v£> So
CN
00 •I*
C r-% CN NO m p^ CO m CO CO NS NO 00 00
•H rH stf- p^ C^ co CN O NS o H NO rH <r CN
> 3 1 i H Co CN rH O <r <3‘ H o CN CO oN
•H E II ' NO O Co 00 00 O CN NS Co
> 3 ^ • • • • • • • • • • • • •
S-i fH oN O o I— 1 o o O o O i— 1 o rH o O
3 v— /
CO
3
o /— S
•H 1—H
4-1
S-I •f* CN p- rH o m O O m o O rH CN
o /■■— \ oN o n rH co p^ CO <r CO o NT CN o m
a as oo 1 i p^ CN o rH o CO co CN <r <r CTO CO
o iH o— / p^ oN r-~ o o ao 00 r^ CTi o m 00
S-i 3 || • • • • • • • • • • . • •
cu 2 A O O O rH rH o o O O o rH o o
n
Co NO <r co i— 1 CN cn 00 o m CO NO <r NO 00
ao iH co co NS <r NS ao CN r-~ <r o P- CO
m co 00 p^ N5 00 co co ao CN m P" oN
Q) r rr r ä A * 0k 0k 0k * 0k r\ r 0k
rH rH r^ CO 00 co co 00 00 00 o rH m o Co m
OQ CO m oN m r - m o NS rH rH CN co m 00 oN
E sr co m CN rH O O'! p~ r - r^. NS m CO CO rH co
<D o_^ — 0k
pH rH rH rH rH rH
o
00 o m m r~» m o CO rH <r CN I-'- r-~ Co o
O'* oN rH CN rH CN NO NT 00 r - rH rH O o co rH
rH ON NO oN NO rH m ao o o CN m rH CO ON m
1— 00 Co NO <r CN CN CN CN CO <JO NO 00 CO co
o CO a; CN O 00 m NO rH NO rH CO O CO 00 <r NT
00 3 rH <r NO cn rH CO CO NO NO m m CO CN i— i CN
ON CO 3 co r •» r
rH 3 S w rH rH l— 1 rH
1 3
r—1 CJ
co 3
r— 1 o
•H
«3 4-1 m NO rH iH CO <r CN 00 rH NS O
> 03 oN NO m co rH CO NS CT> <r m rH <d" oN
03 rH on rH O rH 00 CO CN 'd- Co Co P^
■"3 3 3 •> «» »> •» r 0k •» 0> »» •» •o r
a rH 1 1 Co <r co CN p>. ao CN m m N> CO Co
4-) o 3 NO m m <r 00 CO < T OO H 00 Co P->
CO p-> 6 CN r-'. NO o o 00 o 00 I"» m <r CN CN CO
CCS (U s— ' — #* r r **
W pH iH rH rH iH 1— 1
r— 1
03 i— i
S-i
3 ON CN rH o NO 00 m o rH <r rH CO m
S-l rH m NO NO <r NO m ao 00 00 00 rH n
CN rH CN CO m m < T cr> m NS >d- n
• • — r a n * 0k * 0* A r #*
o 1 1 O Co 00 CO rH 00 i— i CO rH NO co p*.
•H 3 ao o Co O m 00 m 00 m m 1^- <r CO
4-1 rH /— v p- p* rH ao NO r^- m NT CN CN CN
03 3 rH — a *
H s w rH r— 1 rH
r— 1 03 >
•H 3
> •H <r Co <r ON NT ao On <r oo NT Co
u O ON rH rH CN CN CO co NT <r m m NS oO
+
3 03 00 i 1 1 1 1 1 1 1 1 I 1 1 1 1
CO 00 On o m o m o m o m O m o m O m O
<3^ rH H rH CN CN CO co NT m m NS oNS P^
co
rH
3
3 •H o m O m o m o m o m o
rH rH m rH rH CN CN co CO <r <r m m oTS
N3 0) p- I 1 1 1 1 l 1 i i 1 i 1 +
03 00 Co rH NO rH NO rH NO H NS rH NO rH ON rH
H <C i— i rH rH CN CN CO CO m m oN S
</> -a
c
CD (/> 3
O
£
_cc
o
Jd
3
a
o
1
.2
F
iv
e
Y
e
a
r
A
g
e
P
y
ra
m
id
o
f
East
Java
,
1
9
8
0
_ .£
17
1
6
1
5
14
13
1
2
1
1
c e n s u s e s c l e a r l y showed a n u pw a rd p r o g r e s s o f t h i s ’ h o l l o w ' , h e n c e t h e
K e y f i t z and W i d j o j o h y p o t h e s i s seem s m ore a c c e p t a b l e .
U r b a n a n d r u r a l a r e a s ( s e e F i g u r e s 1 . 3 and 1 . 4 ) show t h e same
i r r e g u l a r i t i e s , w i t h b u l g e s a n d h o l l o w s a t t h e same a g e s i n b o t h
p y r a m i d s . I n t h e u r b a n a r e a s a g e 0 i s w i d e r t h a n a g e 1 , i n d i c a t i n g t h a t
u r b a n a r e a s may s t i l l h a v e r e l a t i v e l y h i g h b i r t h r a t e s . The a g e s u n d e r
20 a p p e a r t o be r e c t a n g u l a r i n s h a p e , b e c a u s e t h e d i f f e r e n c e s b e t w e e n
th e m a r e r e l a t i v e l y s m a l l .
1 . 8 THE QUALITY OF DATA
Many c e n s u s e s h a v e some e r r o r s , s u c h a s f a i l u r e t o r e c o r d a g e , a n d
m i s r e p o r t i n g o f a g e . T h e s e e r r o r s may h a v e b e e n d u e t o m i s s t a t e m e n t s by
t h e r e s p o n d e n t s , i n c o r r e c t e s t i m a t e s by i n t e r v i e w e r s , o r i n c o r r e c t
a l l o c a t i o n by t h e c e n s u s o f f i c e r s . Most d e m o g r a p h i c a n a l y s e s r e l y
h e a v i l y on a g e d a t a , a n d t h e r e f o r e t h e i r r e l i a b i l i t y and a c c u r a c y m u s t
be c h e c k e d ( S h r y o c k an d S i e g e l 1 9 7 8 : 2 0 1 - 2 0 2 ) . C e r t a i n i r r e g u l a r i t i e s
a r e c o n s p i c u o u s i n t h e c l u s t e r i n g a t a g e s e n d i n g i n d i g i t s 0 and 5 .
I n t h i s s t u d y t h r e e i n d i c e s a r e u s e d t o m e a s u r e t h e q u a l i t y o f a g e
d a t a . The f i r s t i s W h i p p l e s I n d e x , w h i c h m e a s u r e s t h e p r e f e r e n c e f o r
d i g i t s 0 a n d 5 . T he t h e o r e t i c a l v a l u e s o f t h e i n d e x v a r y b e t w e e n
1 0 0 - 5 0 0 . L e s s t h a n 105 r e p r e s e n t s h i g h l y a c c u r a t e d a t a , 1 0 5 - 1 0 9 . 9 i s
f a i r l y a c c u r a t e , 1 1 0 - 1 2 4 . 9 i s a p p r o x i m a t e , 1 2 5 - 1 7 4 . 9 r o u g h , 175 a n d o v e r
v e r y r o u g h . The s e c o n d i s M y ers I n d e x , w h i c h m e a s u r e s t h e o v e r a l l
h e a p i n g i n a l l t e r m i n a l d i g i t s f r o m 0 - 9 . T h e o r e t i c a l l y t h e r a n g e i s
1
.3
S
in
g
le
Ye
a
r
A
g
e
P
yr
a
m
id
o
t
ta
s
o
CD
o
in
o
^ f
o
CO
o
CM
s 1
CO (/> 3 o■B
c o
CO
o Ir- C.
O Q_ O
CM
O
CO
o
o in
1
.4
Si
ng
le
Y
e
a
r
Age
P
y
ra
m
id
o
f
E
as
t
Jav
a,
R
u
ra
l
1
9
8
0
.
|
P
o
p
u
la
ti
o
n
in
th
o
u
sa
n
d