NC
-AJ-13-001-EN-C
AT
Austria
BE
Belgium
BE fr
Belgium –
French Comm.
BE nl
Belgium –
Flemish Comm.
BG
Bulgaria
CY
Cyprus
CZ
Czech Republic
DE
Germany
DK
Denmark
EE
Estonia
EL
Greece
ES
Spain
EU
European
Union
FI
Finland
FR
France
HR
Croatia
HU
Hungary
IE
Ireland
IT
Italy
LT
Lithuania
LU
Luxembourg
LV
Latvia
MT
Malta
NL
Netherlands
PL
Poland
PT
Portugal
RO
Romania
SE
Sweden
SI
Slovenia
SK
Slovakia
UK
United
Kingdom
UK-ENG
England
UK-NIR
Northern
Ireland
UK-SCT
Scotland
UK-WLS
Wales
CH
Switzerland
IS
Iceland
LI
Liechtenstein
MK
The former
Yugoslav
Republic of
Macedonia
NO
Norway
TR
Turkey
AU
Australia
CA
Canada
JP
Japan
KO
South Korea
US
United States
of America
The Education and Training Monitor 2013
is accompanied by
28 individual country reports
ec.europa.eu/education/monitor
AT SE FI NO EE LV LT PL DE NL BELU FR ES UK IE HR EL IT CY CZ SK SI IS HU RO BG TR PT MT DK MK CH LIAES Adult Education Survey (Eurostat)
CEDEFOP European Centre for the Development of Vocational Training
CRELL Centre for Research on Education and Lifelong Learning (co-ordinated by JRC)
COFOG Classification of the Functions of Government
CVT Continuing vocational training
CVTS Continuing Vocational Training Survey (Eurostat)
DG EAC Directorate-General for Education and Culture, European Commission
EACEA Education, Audiovisual and Culture Executive Agen-cy, European Commission
ECEC Early Childhood Education and Care
ECTS European Credit Transfer and Accumulation System
ECVET European Credit System for Vocational Education and Training
EEA European Economic Area (EU28, NO, IS and LI)
EENEE European Expert Network on Economics of Education
ENQA European Quality Assurance Network
in Higher Education
EQAR European Quality Assurance Register for
Higher Education
EQAVET European Quality Assurance for Vocational Education and Training
EQF European Qualifications Framework for
lifelong learning
ESCO European Skills, Competences, Qualifications
and Occupations taxonomy
ESG European Standards and Guidelines for Quality
Assurance in Higher Education (developed by ENQA)
ESLC European Survey on Language Competences
EURYDICE Education Information Network in the European Community
GDP Gross Domestic Product
ICCS International Civic and Citizenship Education
Study (IEA)
ICT Information and Communication Technology
IEA International Association for the Evaluation of
Educational Achievement
ISCED International Standard Classification of Education
ISS Information Society Statistics (Eurostat)
IVET Initial vocational education and training
JAF Joint Assessment Framework
JRC Joint Research Centre (European Commission)
LFS European Union Labour Force Survey (Eurostat)
MOOCs Massive Online Open Courses
NESET Network of Experts on Social Aspects of Education and Training
NESSE Network of Experts in Social Sciences of Education and training
OECD Organisation for Economic Co-operation
and Development
OER Open Educational Resources
OJ Official Journal of the European Union
PIAAC Programme for the International Assessment of Adult Competencies (OECD)
PIRLS Progress in International Reading Literacy Survey (IEA)
PISA Programme for International Student Assessment
(OECD)
PPS Purchasing Power Standards
QFEHEA Qualifications Framework for the European Higher
Education Area
TIMSS Trends in International Mathematics and Science Study (IEA)
UNESCO United Nations Educational, Scientific and Cultural Organization
UOE UNESCO Institute for Statistics/OECD/Eurostat
(common data collection)
VET Vocational education and training
Education and Training
Monitor 2013
Education and Training NC -AJ-13-001-EN-CAT
Austria
BE
Belgium
BE fr
Belgium –
French Comm.
BE nl
Belgium –
Flemish Comm.
BG
Bulgaria
CY
Cyprus
CZ
Czech Republic
DE
Germany
DK
Denmark
EE
Estonia
EL
Greece
ES
Spain
EU
European
Union
FI
Finland
FR
France
HR
Croatia
HU
Hungary
IE
Ireland
IT
Italy
LT
Lithuania
LU
Luxembourg
LV
Latvia
MT
Malta
NL
Netherlands
PL
Poland
PT
Portugal
RO
Romania
SE
Sweden
SI
Slovenia
SK
Slovakia
UK
United
Kingdom
UK-ENG
England
UK-NIR
Northern
Ireland
UK-SCT
Scotland
UK-WLS
Wales
CH
Switzerland
IS
Iceland
LI
Liechtenstein
MK
The former
Yugoslav
Republic of
Macedonia
NO
Norway
TR
Turkey
AU
Australia
CA
Canada
JP
Japan
KO
South Korea
US
United States
of America
The Education and Training Monitor 2013
is accompanied by
28 individual country reports
ec.europa.eu/education/monitor
AT SE FI NO EE LV LT PL DE NL BELU FR ES UK IE HR EL IT CY CZ SK SI IS HU RO BG TR PT MT DK MK CH LIAES Adult Education Survey (Eurostat)
CEDEFOP European Centre for the Development of Vocational Training
CRELL Centre for Research on Education and Lifelong Learning (co-ordinated by JRC)
COFOG Classification of the Functions of Government
CVT Continuing vocational training
CVTS Continuing Vocational Training Survey (Eurostat)
DG EAC Directorate-General for Education and Culture, European Commission
EACEA Education, Audiovisual and Culture Executive Agen-cy, European Commission
ECEC Early Childhood Education and Care
ECTS European Credit Transfer and Accumulation System
ECVET European Credit System for Vocational Education and Training
EEA European Economic Area (EU28, NO, IS and LI)
EENEE European Expert Network on Economics of Education
ENQA European Quality Assurance Network
in Higher Education
EQAR European Quality Assurance Register for
Higher Education
EQAVET European Quality Assurance for Vocational Education and Training
EQF European Qualifications Framework for
lifelong learning
ESCO European Skills, Competences, Qualifications
and Occupations taxonomy
ESG European Standards and Guidelines for Quality
Assurance in Higher Education (developed by ENQA)
ESLC European Survey on Language Competences
EURYDICE Education Information Network in the European Community
GDP Gross Domestic Product
ICCS International Civic and Citizenship Education
Study (IEA)
ICT Information and Communication Technology
IEA International Association for the Evaluation of
Educational Achievement
ISCED International Standard Classification of Education
ISS Information Society Statistics (Eurostat)
IVET Initial vocational education and training
JAF Joint Assessment Framework
JRC Joint Research Centre (European Commission)
LFS European Union Labour Force Survey (Eurostat)
MOOCs Massive Online Open Courses
NESET Network of Experts on Social Aspects of Education and Training
NESSE Network of Experts in Social Sciences of Education and training
OECD Organisation for Economic Co-operation
and Development
OER Open Educational Resources
OJ Official Journal of the European Union
PIAAC Programme for the International Assessment of Adult Competencies (OECD)
PIRLS Progress in International Reading Literacy Survey (IEA)
PISA Programme for International Student Assessment
(OECD)
PPS Purchasing Power Standards
QFEHEA Qualifications Framework for the European Higher
Education Area
TIMSS Trends in International Mathematics and Science Study (IEA)
UNESCO United Nations Educational, Scientific and Cultural Organization
UOE UNESCO Institute for Statistics/OECD/Eurostat
(common data collection)
VET Vocational education and training
Education and Training
Monitor 2013
More information on the European Union is available on the Internet (http://europa.eu). Cataloguing data can be found at the end of this publication.
Luxembourg: Publications Office of the European Union, 2013
ISBN 978-92-79-32945-6 doi: 10.2766/63220
Cover image: © ollyy - Shutterstock.com © European Union, 2013
Reproduction is authorised provided the source is acknowledged.
Printed in Italy
Printed on elemental chlorine-free bleached paper (ecf)
Europe Direct is a service to help you find answers to your questions about the European Union.
Freephone number (*):
00 800 6 7 8 9 10 11
(*) Certain mobile telephone operators do not allow access to 00 800 numbers or these calls may be billed.
European Commission
Luxembourg: Publications Office of the European Union
2013 — pp. 72 — 21 x 29.7cm
ISBN 978-92-79-32945-6 doi 10.2766/63220
More information on the European Union is available on the Internet (http://europa.eu). Cataloguing data can be found at the end of this publication.
Luxembourg: Publications Office of the European Union, 2013
ISBN 978-92-79-32945-6 doi: 10.2766/63220
Cover image: © ollyy - Shutterstock.com © European Union, 2013
Reproduction is authorised provided the source is acknowledged.
Printed in Italy
Printed on elemental chlorine-free bleached paper (ecf)
Europe Direct is a service to help you find answers to your questions about the European Union.
Freephone number (*):
00 800 6 7 8 9 10 11
(*) Certain mobile telephone operators do not allow access to 00 800 numbers or these calls may be billed.
European Commission
Luxembourg: Publications Office of the European Union
2013 — pp. 72 — 21 x 29.7cm
Education and Training Monitor 2013
Foreword
Education and training are a source of future growth and employment and are becoming key success factors for the Europe 2020 Strategy. In times of budget constraints it comes as no surprise that the spotlight is on spending. Yet it is precisely in such times that growth-enhancing policies, such as education, should be a top priority: spending on education is an investment, not a cost. As many EU Member States are forced to cut back, the need to scrutinise the effectiveness and efficiency of our education and training systems becomes all the more relevant as we endeavour to do more with less.
The wealth of data provided by this Education and Training Monitor supports Member States in this effort. It enables countries to compare investments in education and training systems against their outcomes and identifies ways of maximising efficiency. It particularly enables countries to assess their performance compared to other countries, regarding the specific recommendations they received during the last European Semester.
The EU level benchmarks set for 2020 provide standards for comparison, encouraging the exchange of information and stimulating peer learning. Cross-country policy research serves to demonstrate how each Member State performs on the basis of the ET 2020 benchmarks and, more importantly, strives to bring to light the most successful policy measures within education and training across Europe.
This year's Monitor is published on the eve of the launch of a new 7-year programme supporting Europe’s cooperation in education, training, youth and sports. Erasmus+ demonstrates the EU’s commitment to education. Compared to its predecessor, the budget of the new programme will increase by approximately 40%, to more than €14 billion over the 2014-2020 period.
This publication also comes at the point when Member States and the Commission are discussing the European Structural and Investment Funds 2014-2020. The Commission’s task will be to make sure that these funds have real impact on education and training systems in Europe. This will only happen if countries design a strategy for education with clear, concrete and measureable targets; milestones for each education level and age-group; and time-frames for implementation, with tools for monitoring progress.
I believe that the Education and Training Monitor 2013 is a tool that will prove invaluable in facilitating decision-makers across Europe to reform their education systems, guaranteeing high-quality and equitable education and training for all our citizens.
Contents
Key findings 5
Volume I
1.
Introduction
9
2.
Investing in skills and qualifications
13
2.1. Investing in education and training in a context of economic crisis 13
2.2. Opening up education and training through new technologies 17
2.3. Tools for transparency of skills and qualifications 21
3.
Tackling early school leaving and raising the bar in school education
25
3.1. Reducing the share of early leavers from education and training 25
3.2. Improving early childhood education and care 31
3.3. Strengthening the teaching profession 33
3.4. Laying the foundations for skills development 34
4.
Emphasising effectiveness and quality in the modernisation of higher
education
39
4.1. Increasing tertiary education attainment 39
4.2. Meeting the challenge of effective resource allocation in higher education 43
4.3. Promoting learning mobility in higher education 47
5.
Facilitating the transition from education to work through vocational
education and training
52
5.1. Reshaping vocational education and training 52
5.2. Enhancing the employability of young people 55
5.3. Fostering entrepreneurship education 58
6.
Upgrading skills through lifelong learning
62
6.1. Taking a closer look at the Survey of Adult Skills 62
6.2. Raising adult participation in lifelong learning 66
Annex 71
Volume II
Country reportsKey findings
The European Union's Strategy to boost growth and jobs – Europe 2020 – aims to tackle the crisis and build a stronger, more competitive Europe. To meet these objectives, people have to be equipped with the skills and qualifications they need on today's labour market, and even more so on tomorrow's global knowledge-based economy. Skills and qualifications are one of the key factors determining Europe's economic success.
However, the difficult economic context casts its shadow on the financing of education and training. The Commission has called on Member States repeatedly to give priority to growth-friendly expenditure. In July 2013, 17 Member States were given a country-specific recommendation, urging them to pursue growth-friendly fiscal policies. In practice, however, spending on education and training, a growth-enhancing mechanism by design, is decreasing or stagnating. This is particularly worrying as it puts at risk Europe's return to smart, sustainable and inclusive growth. After all, world-class education and training requires investing substantial resources.
Education outcomes can be measured in terms of skills or qualifications. The Europe 2020 Strategy focusses on qualifications by setting out a twofold headline target on early school leaving and tertiary education attainment, to be reached by 2020. First, the share of early school leavers is to be decreased to below 10%. In 2012, Europe stood at 12.7%, down from 13.4% the previous year. The target seems to be within reach, but about 5 and half million citizens is still leaving school prematurely, which makes it hard for them to find employment. Second, the EU is making good progress towards the target to increase tertiary attainment to 40%. The EU now stands at 35.7%, up from 34.5% the year before. However, it will be a challenge to combine the increase in numbers with a solid quality of higher education.
Another way to measure education outcomes is by looking at skills. New findings from the OECD’s Survey of Adult Skills (PIAAC) expose a weakness: the skills of Europe's working-age population are not in line with the needs and requirements of the labour market. Today Europe is facing a serious skills gap that risks hampering growth and employment in the future; and the least skilled workers, who are in the most urgent need of up-skilling to be employable, tend not to take part in training. To close this skills gap and bring adult skills in line with the general expectations and needs of our modern economy will require substantial investment over many years.
To secure the necessary investments for skills and qualifications is not easy. In part, the solution will be to scrutinise spending in light of the various education outcomes. Another approach will be to introduce efficiency measures that have to potential to transform investments into stronger outcomes. Efficiency measures can help to meet the twin challenge of pursuing fiscal consolidation and investing in growth-enhancing policies.
As an example of such efficiency measures, Europe would benefit from overcoming remaining barriers that are due to the myriad of existing diplomas, certificates and qualifications. Despite the existence of a large number of policies and instruments, there still remain obstacles for individuals to move between countries, across different education sub-systems, and from education to work. Europe needs better transparency and recognition of skills and qualifications. Efforts towards a European Area for Skills and Qualifications will enhance the effective recognition of competences and qualifications and support the free movement of learners and workers.
The policy messages set out in the analysis above are supported by 10 key findings that emerge from the second annual Education and Training Monitor.
The consolidation of public finance and youth unemployment challenge European
education and training systems …
1.
Sixteen Member States decreased their education expenditure at some
stage between 2008 and 2011
, with six of them showing further significant budget decreases in 2012 (EL, IT, CY, LV, PT, UK-WLS). Cutbacks in spending per student across Europe started to be most prevalent in tertiary education (12 Member States) between 2008 and 2010. Whereas the majority of Member States decreased spending per student for at least one level of education, BG, ES, HR, IT, LV and RO cut down on all levels from primary to tertiary in this period.2.
The employment rate of recent graduates with at least upper secondary
education stands at 75.7%, down from 82.0% in 2008.
An advantage of tertiary education attainment over upper secondary education attainment is still visible in all Member States. However, across the EU, 21% of people with tertiary qualifications are active in jobs that usually require lower qualifications. This suggests that, in spite of the high levels of unemployment, there is also evidence of skills mismatches.3.
The transition from education to work can be facilitated through quality
traineeships, apprenticeships and dual learning models.
Students from vocational education and training programmes have a better transition from education to work in Member States with developed work-based learning (e.g. DK, DE, NL and AT). Many Member States are working on reforms that build on the experiences of these countries.… while analysis of the twofold Europe 2020 headline target underlines the need
to link the worlds of work and education more closely, …
4.
Early school leavers are struggling to move between the worlds of work
and education.
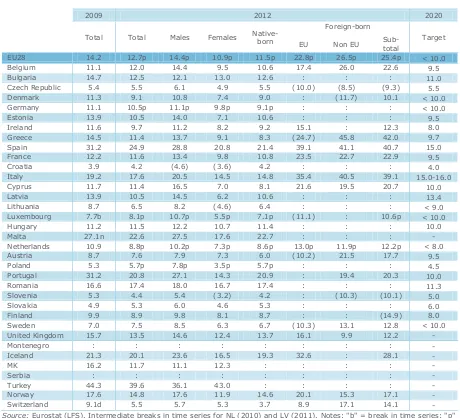
The rate of early leavers from education and training stands at 12.7%. However, between 2009 and 2012, IT, DE, FR and CY have been making little progress and HU, RO and BE have even shown an increase in their early school leaving rates. The biggest challenge lies in the transition from school to work, with the unemployment rate amongst early school leavers at 40.1%, and from work back to learning, with only 0.8% of 18 to 24 year-olds in non-formal learning after having left formal education.… the current skills diagnosis reveals serious underperformance in the basic and
transversal skills that are crucial on the European labour market, …
6.
20% of 16 to 65 year-olds is unable to exceed a basic level of literacy and
24% is unable to do so in numeracy
.
The results from the Survey of Adult Skills underline the need for lifelong learning. However, skills levels and participation in adult learning are strongly connected in many countries, confirming that lifelong learning is still not profited from by those who would benefit from it most. Adult participation in lifelong learning stands at only 9.0% and is most prevalent amongst the young and highly educated.7.
Only half of the EU population aged 15 years and above agree that their
school education helped them to develop entrepreneurial competences.
Virtually all countries that show an above-average performance in entrepreneurial attitude also have above-average percentage participation, at school or university, in courses or activities concerning entrepreneurship. Efforts to develop entrepreneurial skills are needed to support new business creation, employee innovation within existing companies and to improve employability levels of the young. Entrepreneurship education is a tool to drive up the economic benefits of education.
… and important cross-sectorial issues still impede progress of Europe’s
education and training systems.
8.
Inequalities persist in European education and training systems.
Evidence suggests that many education and training systems in Europe are marked by inequalities, reflected by strong disadvantages in the skills and qualifications of social groups such as young people with a migrant background. There is also wide variation between different Member States in their success at addressing the problem. These inequalities have severe consequences for individuals, for economic progress and for social cohesion.9.
Rethinking how we attract, educate and support teachers, school leaders
and teacher educators is a pressing issue
, with the teaching profession across Europe strongly affected by demographic trends. In many Member States, the majority of teachers currently in employment are in the highest age brackets. In IT, DE, EE and NL, for example, more than 45% of the teaching workforce is in the 50+ category and in IT, BG, DE and ES there are very few teachers under the age of 30.10.
Europe is lagging behind in the development of Open Educational
1. Introduction
The challenge of doing more with less
The on-going crisis challenges European education and training systems from two different angles. Firstly, Member States have to consolidate public finance while investing in growth-enhancing policies1. Secondly, the EU is faced with a youth unemployment rate of 23.2%, representing a huge untapped resource and a social crisis that Europe cannot allow to persist2. Education and training, with its impact on productivity and innovation, is a growth-enhancing mechanism by design and contributes to the employability of young and old. Yet more than half of the Member States have decreased their investments in education and training.
These two key challenges require Europe to strengthen the outcomes of its various education and training systems and to adapt them more flexibly to the changing needs of the labour market. In other words, European education and training systems will have to become more relevant and adaptable, while at the same time fighting for sustained investments as the crisis continues. This is the main argument for modernising our education and training systems3 and for Member States to debate efficiency measures in order to enhance returns to education investments. The 2013 Annual Growth Survey recalled the efficiency of education expenditure and pointed towards policy levers that, amongst others, link the worlds of work and education more closely4.
While the primary responsibility for the reform process lies at national level, the EU offers significant support. Starting in 2014, a new generation of programmes will be in place to offer financial support to Member States. Erasmus+, the new single programme for EU cooperation and mobility in education, training, youth and sports for 2014-2020, demonstrates the EU’s commitment to education even in times of severe fiscal constraint: the budget for the new programme will increase by approximately 40%, to more than 14 billion for the seven years. Furthermore, the next generation of European Structural and Investment Funds will assist Member States in addressing shortcomings in the field of education and training and to give precedence to the priority areas that have been pin-pointed in the country-specific recommendations5.
These country-specific recommendations, proposed by the Commission and adopted by the Council, are based on an assessment of each Member State's key challenges and aim at offering tailor-made guidance. Many of these recommendations call on Member States to combat early school leaving, increase tertiary attainment, improve their school or vocational education and training system by making their outcomes more relevant for the labour market, and secure the necessary funding for investments in education. The recommendations are the key EU-level policy tool for driving reforms at the national level. Reporting on the implementation of the country-specific recommendations by the Member States is carried out in the context of the European Semester6. The annual Education and Training Monitor, in turn, contributes to the analytical basis.
Strengthening the evidence-base
The strategic framework for European cooperation in education and training (ET 2020) was re-vamped in 2012 to bring it in line with the EU Strategy for growth and jobs, and to support Member States in their reform efforts7. One objective has been to strengthen the evidence-base and analytical capacity of ET 2020, on which the next country-specific recommendations can draw. This is the aim of the Education and Training Monitor series, the first edition of which was presented in November 20128.
1 Moving Europe beyond the crisis (COM(2013) 350 final). The package was adopted by the Council on 19 June 2013.
2 Working together for Europe’s young people: A call to action on youth unemployment (COM(2013) 447 final).
3 Rethinking Education: Investing in skills for better socio-economic outcomes (COM(2012) 669 final).
4 Annual Growth Survey 2013 (COM(2012) 750 final). Priorities were affirmed in the Council Conclusions on investing in
education and training (OJ 2013/C 64/06).
5 The financial support offered by the European Structural and Investment Funds, in particular the European Social
Fund and the European Regional Development Fund, will help Member States to maintain an appropriate level of growth-friendly investments.
6 See http://ec.europa.eu/europe2020/making-it-happen/country-specific-recommendations/index_en.htm.
7 See the May 2009 Council Conclusions (2009/C 119/02) and the 2012 Joint Report of the Council and the
Commission on the implementation of ET 2020 (2012/C 70/05).
At the request of the Council, the Education and Training Monitor is an annual report presented every autumn by the Commission Services, setting out, in a succinct document, progress on the ET 2020 benchmarks and core indicators, including the Europe 20209 headline target on education and training (see Table 1.1). The Education and Training Monitor illustrates the evolution of education and training systems across Europe, with a particular focus on the country-specific recommendations adopted in the field of education and training. It contributes to the analytical basis for the next European Semester and provides input to national debates.
As such, the annual Education and Training Monitor is an instrument to foster and encourage evidence-based policy making, implementing the methodology of the Joint Assessment Framework (JAF) – the monitoring tool for the Europe 2020 strategy – to help ensure a consistent and transparent assessment of progress across Member States10.
The second edition of the annual Education and Training Monitor consists of comparative analyses on the basis of the twofold Europe 2020 headline target on education and training and the formally adopted ET 2020 benchmarks. These benchmarks and indicators, summarised in Table 1.1, are closely inter-related and contribute directly to the policy debate on youth unemployment. Beyond these benchmarks and indicators, the 2013 Monitor reflects recent progress in the political agenda, linking to the latest policy documents11.
The Education and Training Monitor 2013 is accompanied by an online visualisation tool12. This tool makes it possible to quickly evaluate the performance and progress of Member States in relation to the Europe 2020 and ET 2020 targets. The online visualisation tool complements the Education and Training Monitor and enables readers to compare, for example, particular sub-groups, countries, and their performance at a given point in time.
Outline of the Education and Training Monitor 2013
Chapter 2 assesses the trends in public and private expenditure, and covers two cross-sectorial opportunities to increase efficiency in education and training systems. These opportunities are part of the shift towards open and flexible learning: opening up education and training through digital technologies and implementing tools for transparency of skills and qualifications.
The two subsequent sector-specific chapters cover school education and higher education and above all prioritise the twofold Europe 2020 headline target in education and training. Chapter 3 addresses the headline target on early leavers from education and training, followed by early childhood education and care, the teaching profession and the determinants of basic skills and foreign language skills. Chapter 4 examines the headline target on tertiary education attainment, followed by a closer look at resource allocation and learning mobility in higher education.
The final two chapters have a strong labour market orientation, moving from employability and its most prominent determinants to continued learning. Chapter 5 covers vocational education and training (VET), the transition from education to work and the contribution of entrepreneurship education. Chapter 6 highlights the European dimension of the OECD Survey of Adult Skills (PIAAC) by analysing the skill levels of the European working-age population. It also shows trends in adult learning and continuing vocational training, following the benchmark on adult participation in lifelong learning.
9 Europe 2020: A strategy for smart, sustainable and inclusive growth (COM(2010) 2020 final).
10 In this year’s Education and Training Monitor, the cross-national JAF analysis is of a purely descriptive nature, using
scatterplots to compare Member States’ current performance and recent change, and looking at particular subgroups
in the population. However, the 28 country reports are added as Volume II primarily to shed more light on the
broader context and the determinants underlying Member States’ current performance and recent change as regards particular indicators. Here, the JAF analysis mainly concerns the twofold Europe 2020 headline target, but from next year onwards this standardised approach will be applied to other ET 2020 benchmarks as well. Moreover, DG EAC is working to extent its quantitative JAF approach to incorporate a more qualitative, system-level assessment, which will further strengthen the analytical capacity and deepen the problem analysis in the next edition of the Education and Training Monitor.
11 In particular, the Commission Communications European higher education in the world (COM(2013) 499 final) and
Opening Up Education: Innovative teaching and learning for all through new technologies and open educational resources (COM(2013) 654 final; SWD(2013) 341).
12 The visualisation tool is part of the Online Education and Training Monitor, which can be found here:
Country reports
The 28 individual country reports represent Volume II of the Monitor and summarise the performance of each Member State as regards the main benchmarks and indicators monitored in this report13. At the same time, various examples of key challenges, particularly good outcomes, and reform areas, as mentioned in the country reports, have been taken up in the 2013 Monitor.
The country reports pinpoint the main challenges the different Member States face in education and training and outline the most significant measures adopted to respond to these challenges. Information is provided on trends in financing education and training, with a special focus on investing in skills and qualifications. Furthermore, each country report features a detailed assessment on school education and higher education in line with the twofold Europe 2020 headline target in education and training. The last part of each country report has a strong labour market orientation, as it discusses the transition from education to work, the employment rate of recent graduates, reforms in vocational education and training and trends in adult learning and continuing vocational training.
The specific information used in the country reports provides both quantitative and qualitative evidence, based on a broad range of data sources. The monitoring methodology builds on indicators of the Joint Assessment Framework (JAF). The 28 country reports contribute both to the monitoring of the implementation of country-specific recommendations resulting from the 2013 European Semester and to the strengthening of the analytical basis for the next European Semester.
13 The 28 country reports are part of the Online Education and Training Monitor, which can be found here:
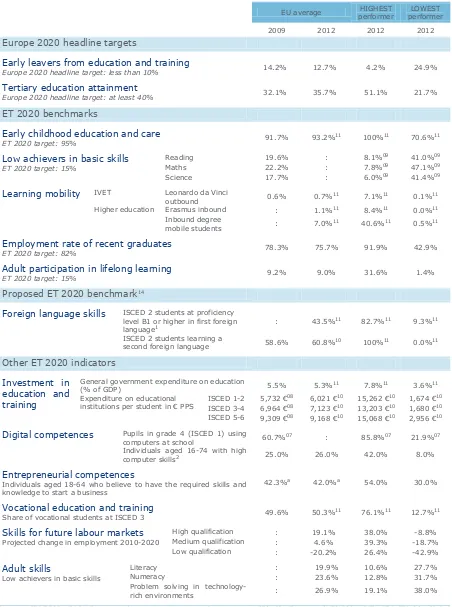
Table 1.1. Performance summary benchmarks and indicators
EU average performer HIGHEST performer LOWEST
2009 2012 2012 2012
Europe 2020 headline targets
Early leavers from education and training
Europe 2020 headline target: less than 10% 14.2% 12.7% 4.2% 24.9%
Tertiary education attainment
Europe 2020 headline target: at least 40% 32.1% 35.7% 51.1% 21.7%
ET 2020 benchmarks
Early childhood education and care
ET 2020 target: 95% 91.7% 93.2%11 100%11 70.6%11
Low achievers in basic skills
ET 2020 target: 15%
Reading 19.6% : 8.1%09 41.0%09
Maths 22.2% : 7.8%09 47.1%09
Science 17.7% : 6.0%09 41.4%09
Learning mobility IVET Leonardo da Vinci
outbound 0.6% 0.7%11 7.1%11 0.1%11
Higher education Erasmus inbound : 1.1%11 8.4%11 0.0%11
Inbound degree
mobile students : 7.0%11 40.6%11 0.5%11
Employment rate of recent graduates
ET 2020 target: 82% 78.3% 75.7% 91.9% 42.9%
Adult participation in lifelong learning
ET 2020 target: 15% 9.2% 9.0% 31.6% 1.4%
Proposed ET 2020 benchmark14
Foreign language skills ISCED 2 students at proficiency level B1 or higher in first foreign
language1 : 43.5%
11 82.7%11 9.3%11
ISCED 2 students learning a
second foreign language 58.6% 60.8%10 100%11 0.0%11
Other ET 2020 indicators Investment in
education and training
General government expenditure on education
(% of GDP) 5.5% 5.3%11 7.8%11 3.6%11
Expenditure on educational
institutions per student in € PPS ISCED 1-2 5,732 €
08 6,021 €10 15,262 €10 1,674 €10
ISCED 3-4 6,964 €08 7,123 €10 13,203 €10 1,680 €10
ISCED 5-6 9,309 €08 9,168 €10 15,068 €10 2,956 €10
Digital competences Pupils in grade 4 (ISCED 1) using
computers at school 60.7%07 : 85.8%07 21.9%07
Individuals aged 16-74 with high
computer skills2 25.0% 26.0% 42.0% 8.0%
Entrepreneurial competences
Individuals aged 18-64 who believe to have the required skills and knowledge to start a business
42.3%a 42.0%a 54.0% 30.0%
Vocational education and training
Share of vocational students at ISCED 3 49.6% 50.3%11 76.1%11 12.7%11
Skills for future labour markets
Projected change in employment 2010-2020
High qualification : 19.1% 38.0% -8.8%
Medium qualification : 4.6% 39.3% -18.7%
Low qualification : -20.2% 26.4% -42.9%
Adult skills
Low achievers in basic skills
Literacy : 19.9% 10.6% 27.7%
Numeracy : 23.6% 12.8% 31.7%
Problem solving in
technology-rich environments : 26.9% 19.1% 38.0%
Source: CEDEFOP, EAC, European Survey on Language Competences (ESLC), Eurostat (LFS-ISS-UOE), IEA TIMSS, Global
Entrepreneurship Monitor, OECD (PISA). Notes: 07=2007; 08=2008; 09=2009; 10=2010; 11=2011; e=estimate; a=unweighted
average; b=break; p=provisional; 1=average of skills tested in reading, listening, writing; 2= having carried out 5-6 specific
computer related activities. See the corresponding sections in the Monitor for the number of countries incorporated in each EU average presented in this table.
2. Investing in skills and qualifications
Sustaining public investment in education is a challenging task within the current economic context. Public spending on education is essential for growth and employment as a more skilled and educated workforce will support further productivity gains, innovation and wealth. Low-skilled workers, conversely, run an increasing risk of becoming unemployed in the face of labour markets that are ever more demanding in terms of skills and qualifications. Member States face different demographic15, economic and social challenges to improve the returns to their investments in education and training. Regardless, combining fiscal consolidation and growth-enhancing investment by definition requires improving the efficiency of public expenditure.
This edition of the Education and Training Monitor looks at the trends in public and private expenditure on education and training (section 2.1) and subsequently provides insights into the main outcomes of education and training in terms of skills and qualifications. Rather than defining efficiency by simply relating these investments and outcomes16, the Education and Training Monitor sheds light on various efficiency measures that have the potential to transform investments into stronger outcomes. Two examples are opening up education through new technologies and removing obstacles to have skills and qualifications recognised across borders.
Section 2.2 evaluates whether Europe is sufficiently reaping the benefits of new technologies in order to open up education to new groups of learners and to make teaching and learning more engaging, innovative and effective. Digital technologies can improve efficiency through economies of scale, expanding access to a wider number of people at lower costs. Section 2.3 addresses how transparency and recognition of skills and qualifications acquired through different learning pathways can be fostered through the implementation and further coordination of European policy instruments such as qualification frameworks, quality assurance frameworks, credit systems and tools for validation on non-formal and informal learning, paving the way for a future European Area of Skills and Qualifications.
2.1. Investing in education and training in a context of economic crisis
Spending on education is an investment in the future. EU Member States need to continue investing in education, research and innovation while pursuing the consolidation of public budgets. Underinvestment in human capital risks undermining Europe's prospect for smart, inclusive and sustainable growth in the future as underlined by the European Commission in the last three Annual Growth Surveys and the country-specific recommendations issued in the context of the European Semester17. The empirical evidence shows that Member States are tackling this challenge in different ways. Growth-friendly public expenditure is a key concern under Europe 202018 but the situation of public finance across the EU requires differentiated approaches.
A key question is how Member States have adapted their public education spending to respond to the crisis. Two kinds of indicators are considered for this purpose: (1) education expenditure in absolute values and as a percentage of GDP as a proxy for the commitment of Member States to invest in human capital and (2) education expenditure per student as a measure of the actual level of spending on educational institutions per study level. The comparison covers three to four years to encompass the 2009 drop in GDP growth and the delays in national processes to adjust public expenditure on education to recent economic trends.
15 See Table A.1 in the Annex and chapter 2 of the 2012 Education and Training Monitor on demographic change and
education spending (http://ec.europa.eu/education/lifelong-learning-policy/monitor12_en.htm).
16 There is a considerable time lag between a change in investment and its first likely effect on a particular cohort of
students; and multiple measures to be considered for such an effect, whether skills, qualifications, or given benchmarks and indicators. In 2014, the JRC’s Centre for Research on Lifelong Learning (CRELL) Joint Research Centre will, on behalf of DG EAC, investigate whether more sophisticated econometric models can bring to light the relationship between investment and outcomes in a more reliable and meaningful way.
17 The 2013 country-specific recommendations, approved by the Council, can be found at:
http://ec.europa.eu/europe2020/making-it-happen/country-specific-recommendations/index_en.htm. The package was adopted by the Council on 19 June 2013. Significant amounts were earmarked in the 2014-2020 European Programme Erasmus+, the European Social Fund (ESF) and the European Regional Development Fund (ERDF) to support investments in education and training and measures to improve efficiency of education spending.
Sixteen Member States
decreased their education
expenditure at some stage
between 2008 and 2011
Firstly, looking at public education expenditure in real terms or as a percentage of GDP19 shows that investment in education tended to shrink overall in many European countries. Evidence shows that budgets decreased further from 2011. BG, IT and RO already had decreasing values over the period 2008-2011; this was also the case for EL and SK from 2009 or 2010 (albeit not yet down to 2008 values). RO reinvested in education in 2011 although keeping to low levels.
While eleven countries have managed to keep their spending on education at a higher or comparable level in absolute terms from 2008 to 2011 (BE, CZ, DE, FR, LU, MT, NL, AT, SI, FI and SE – see table 2.1), cuts in education expenditure were significant during this period in EE, IE, LV and HU as well as in BG, EL, IT and RO where spending levels in relation to the GDP were already low and have been cut further. DK, ES, CY, LT, PL, PT, SK and UK made cuts at some stage between 2008 and 2011 which is reflected in a reduction of education spending as a percentage of GDP in 2011. ES, PT, SK and UK had significant cuts in 2011.
The fall in education spending in recent years in these sixteen Member States represents a worrying trend and calls for strengthening the efficiency of education investment and supporting innovation and competitiveness20. This is of particular relevance in the context of limited GDP growth forecasts for 2014.
Figure 2.1. Public expenditure on education as a percentage of GDP (2010- 2011)21
Source: Eurostat (Government finance statistics; online data code: gov_a_exp). Notes: No comparable data for HR. Countries are ranked in ascending order according to public expenditure on education in % of GDP in 2010.
More recent figures available at national level22 show that the budget continued to decrease by more than 5% between 2011 and 2012 in six of the sixteen Member States mentioned above for all education levels (EL, IT, CY, LV, PT, UK-WLS) as well as in HR and for tertiary education in two other Member States (CZ, IE). Education spending increased by 5% or more only in BE (German speaking Community), LU and MT. These trends, as well as changes in 2013 national budgets, explain why, in the context of the 2013 European Semester, it was recommended pursuing or implementing growth-friendly policies in BG, EE, HU, LT, IT, RO, FI, SE and UK; improving the efficiency of public spending in DE, FR, and SK; and protecting growth-enhancing expenditure in future budgets in MT, NL, PL and SI.
19 Eleven Member States had a level of public education spending below the EU average of 5.3% of GDP in 2011 (BG,
CZ, DE, IE, EL, ES, IT, LU, HU, RO and SK). On the other hand, in some Member States public expenditure on education exceeded the average by a considerable margin. It was between 6% and 7% of GDP in BE, EE, FR, PT, SI, SE, FI and UK. In CY, expenditure even amounted to 7.2% and in DK to 7.8% of GDP.
20 COM(2013) 350 final.
21 Based on breakdowns of expenditure data according to the Classification of the Functions of Government (COFOG).
According to the COFOG, education expenditure covers pre-primary, primary, secondary and tertiary education, education not definable by level, subsidiary services to education and R&D in education.
22 Eurydice (2013), Funding of Education in Europe, 2000-2012 (changes in budgets in constant prices).
-1,0 0,0 1,0 2,0 3,0 4,0 5,0 6,0 7,0 8,0
-1,0 0,0 1,0 2,0 3,0 4,0 5,0 6,0 7,0 8,0
RO BG EL DE SK IT CZ ES LU IE EU HU PL AT MT NL LV LT FR BE FI SI EE UK SE PT CY DK
Decrease between 2010 and 2011 in percentage points Increase between 2010 and 2011 in percentage points
%
of
BG, ES, HR,
IT, LV and RO
cut down on
all levels from
primary to
tertiary
education
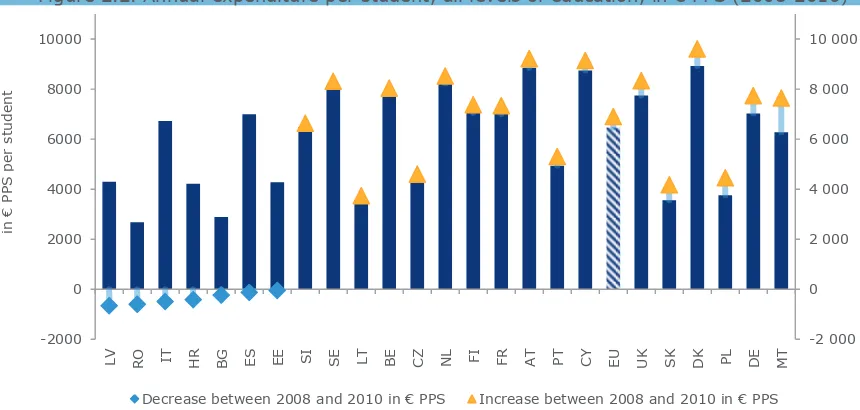
Secondly, when looking at public education expenditure per student and by education level23, data availability allows only for a 2008-2010 analysis. Nevertheless, the concerns expressed above were already visible before the real impact of the crisis on education and training budgets. On average, Member States spent about 6,900 € per student in 2010 (about 9,600 € per student in tertiary education compared to about 5,100 € for primary and 6,100 € for secondary education). Education spending per student was down in seven Member States between 2008 and 2010 when considering averages for all educational levels (Figure 2.2). This was the case in countries with existing low levels like BG, HR, IT, LV and RO as well as in ES for primary, secondary and tertiary education.
[image:17.595.70.531.312.675.2]Overall education spending per student was also down in EE although the decrease concerned primary education. In nine other Member States, spending per student decreased for certain educational levels only. This was the case in BE, CZ, CY, NL, AT and SE for tertiary education (see Table 2.1), in CY, LT, LU and AT for upper secondary education, and in SI for primary and lower secondary education.
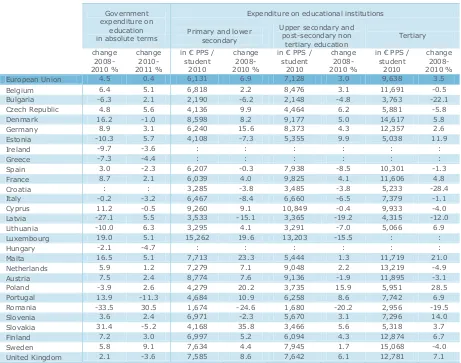
Table 2.1. Government expenditure on education (2008-2011) and annual expenditure per student in € PPS (2010-2008)
Government expenditure on
education in absolute terms
Expenditure on educational institutions
Primary and lower secondary
Upper secondary and post-secondary non
tertiary education Tertiary
change 2008-2010 %
change 2010-2011 %
in € PPS / student
2010
change 2008-2010 %
in € PPS / student
2010
change 2008-2010 %
in € PPS / student
2010
change 2008-2010 %
European Union 4.5 0.4 6,131 6.9 7,128 3.0 9,638 3.5
Belgium 6.4 5.1 6,818 2.2 8,476 3.1 11,691 -0.5
Bulgaria -6.3 2.1 2,190 -6.2 2,148 -4.8 3,763 -22.1
Czech Republic 4.8 5.6 4,136 9.9 4,464 6.2 5,881 -5.8
Denmark 16.2 -1.0 8,598 8.2 9,177 5.0 14,617 5.8
Germany 8.9 3.1 6,240 15.6 8,373 4.3 12,357 2.6
Estonia -10.3 5.7 4,108 -7.3 5,355 9.9 5,038 11.9
Ireland -9.7 -3.6 : : : : : :
Greece -7.3 -4.4 : : : : : :
Spain 3.0 -2.3 6,207 -0.3 7,938 -8.5 10,301 -1.3
France 8.7 2.1 6,039 4.0 9,825 4.1 11,606 4.8
Croatia : : 3,285 -3.8 3,485 -3.8 5,233 -28.4
Italy -0.2 -3.2 6,467 -8.4 6,660 -6.5 7,379 -1.1
Cyprus 11.2 -0.5 9,260 9.1 10,849 -0.4 9,933 -4.0
Latvia -27.1 5.5 3,533 -15.1 3,365 -19.2 4,315 -12.0
Lithuania -10.0 6.3 3,295 4.1 3,291 -7.0 5,066 6.9
Luxembourg 19.0 5.1 15,262 19.6 13,203 -15.5 : :
Hungary -2.1 -4.7 : : : : : :
Malta 16.5 5.1 7,713 23.3 5,444 1.3 11,719 21.0
Netherlands 5.9 1.2 7,279 7.1 9,048 2.2 13,219 -4.9
Austria 7.5 2.4 8,774 7.6 9,136 -1.9 11,895 -3.1
Poland -3.9 2.6 4,279 20.2 3,735 15.9 5,951 28.5
Portugal 13.9 -11.3 4,684 10.9 6,258 8.6 7,742 6.9
Romania -33.5 30.5 1,674 -24.6 1,680 -20.2 2,956 -19.5
Slovenia 3.6 2.4 6,971 -2.3 5,670 3.1 7,296 14.0
Slovakia 31.4 -5.2 4,168 35.8 3,466 5.6 5,318 3.7
Finland 7.2 3.0 6,997 5.2 6,094 4.3 12,874 6.7
Sweden 5.8 9.1 7,634 4.4 7,945 1.7 15,068 -4.0
United Kingdom 2.1 -3.6 7,585 8.6 7,642 6.1 12,781 7.1
Source: Eurostat (Government finance statistics; online data code: gov_a_exp and UOE; online data code: educ_fitotin). Notes: See Eurostat on line metadata for a precise definition of education expenditure in each source. No comparable data for HR on Government expenditure on education. PT 2009 data are used for expenditure on educational institutions in primary and secondary education. For IT, data on expenditure on educational institutions cover public institutions only (except in tertiary education) and data excludes post-secondary non-tertiary education. EU aggregate are calculated without IE, EL, LU and HU.
23 Expenditure on educational institutions per student provides complementary information on trends across education
Tuition fees and
enterprise sponsorship
accounted for 14% of
total spending on
educational institutions
There is a need for
national debates on
the funding of
education and training
[image:18.595.76.506.243.448.2]In the other Member States, education expenditure per student increased or remained stable between 2008 and 201024. However, the cuts in education spending in 2011 and 2012 are likely to impact expenditure per student particularly in tertiary education in the view of upward enrolment trends across Europe (+4.3% in the period 2008-2010, with more than 10% in BE, CZ, DE, CY, MT and AT). In 2013, efficiency gains are expected in a number of Member States as national budget priorities focussed on e.g. improving the efficiency of education administration in BG, CZ, AT, SI and UK-NIR and the employability of graduates and/or the provision of apprenticeship in BG, CZ, ES and UK-SCT25. Nevertheless, there is still a need for national debates on the funding of education and training.
Figure 2.2. Annual expenditure per student, all levels of education, in € PPS (2008-2010)
Source: Eurostat (UOE; online data code: educ_fitotin). Notes: For the EU28, DE and PT 2009 data are used instead of 2010 data. EU aggregate calculated without IE, EL, LU, HR and HU. Countries are ranked in ascending order according to the growth in annual expenditure per student between 2008 and 2010.
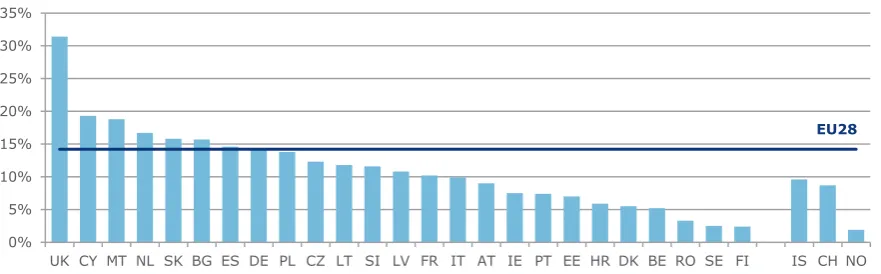
Private spending on educational institutions
Financing educational institutions has always been largely the role of public actors across the EU. For all educational levels, public funding accounted for about 86% of investments in educational institutions in 2010. Over the last decade, the share of private funding (tuition fees paid by households/students, sponsorship by enterprises) of educational institutions increased from 11.5% of total spending on institutions in 2000 to close to 14% in 2009 for the EU as a whole.
In 2010, private spending on educational institutions accounted for less than 5% of total spending in FI, SE and RO as well as in NO, but between 15% and 20% in BG, CY, MT, NL and SK. The share of private spending was as high as 31.4% in UK, close to values reached in non EU countries like the United States and Japan, which reflects the specific UK-ENG funding model for higher education. Tuition fees paid by households/students for tertiary education largely reflect the diversity and evolution of education financing models across Europe26 (see chapter 4).
24 See also a forthcoming JRC-CRELL report on public financing of education in EU countries (to be published at:
https://crell.jrc.ec.europa.eu).
25 Eurydice (2013), Funding of Education in Europe, 2000-2012.
26 See also Eurydice (2013), Funding of Education in Europe, 2000-2012 (chapter 5 on financial support to students).
The figures do not take into account private spending of households on non-formal education to supplement formal
education with a private tutor. See NESSE (2011), The challenge of shadow education for further information at
http://www.nesse.fr/nesse. Furthermore, when examining the differences in funding of educational systems across
Member States, this chapter does not address local and regional disparities. See NESSE (2012),Mind the Gap for
-2 000 0 2 000 4 000 6 000 8 000 10 000
-2000 0 2000 4000 6000 8000 10000
LV RO IT HR BG ES EE SI SE LT BE CZ NL FI FR AT PT CY EU UK SK DK PL DE MT
Decrease between 2008 and 2010 in € PPS Increase between 2008 and 2010 in € PPS
in
€
PP
S pe
r
A more advanced use of computers
during lessons is still not
[image:19.595.84.525.97.234.2]commonplace in many countries
Figure 2.3. Share of private expenditure on educational institutions (2010)
Source: Eurostat (UOE). Notes: Private expenditure corresponds to transfers from private sources to educational institutions. This includes private fees for educational services as well as public funding via subsidies to households.
In relation to further use of a mix of private and public sources, the European Commission underlined the need for strengthening the knowledge triangle between education, research and business in the European Union in its Communication on European Higher Education in the World27. This was already the aim of recommendations made to BG, EE and SK within the context of the 2013 European Semester in order to foster effective knowledge transfer.
Private spending on educational institutions stands to face significant changes in coming years with the development of new relationships between educational institutions, households and enterprises. Significant efficiency gains can be expected with the increasing role of ICT in education and training and Open Educational Resources (see section 2.2) and with a better transferability between educational institutions, companies and sectors of skills acquired across different learning platforms and pathways (see section 2.3).
2.2. Opening up education and training through new technologies
Today new technologies offer unprecedented opportunities to make learning more effective, inclusive and engaging. Digital technologies can improve effectiveness of resources through economies of scale, expanding access to a wider number of people (e.g. through MOOCs28 and other Open Educational Resources (OER)) at lower costs or allowing teachers to focus on what they do best by automating or offloading more routine tasks. ICT can be used to foster more creative and innovative methods of learning (including personalised and collaborative learning)29, and it has the potential to facilitate collaboration, exchange and access to learning resources.
A huge potential for the modernisation of education and training
As highlighted in the Communication on Opening Up Education30, Europe is not fully exploiting the potential offered by new technologies and the upsurge across the globe of digital content in order to better fulfil learners' needs, cater for more individualised learning paths and offer high quality education.
Even if data from TIMSS 201131 show that the use of computers at school (in grade 4) has increased, the differences across countries remain significant. In UK-ENG nearly all grade 4 students use ICT at school, whereas in AT, LT, SI and RO less than half of the students do so. To fully benefit from the
further information at http://www.nesse.fr/nesse.
27 European higher education in the world (COM(2013) 499 final).
28 Massive Online Open Courses.
29 See e.g. JRC-IPTS (2012) Innovating Learning: Key Elements for Developing Creative Classrooms in Europe
(http://ftp.jrc.es/EURdoc/JRC72278.pdf).
30 Opening Up Education: Innovative teaching and learning for all through new technologies and open educational
resources (COM(2013) 654 final).
31 Trends in International Mathematics and Science Study by the IEA (http://timss.bc.edu/). See also Section 3.4.
0% 5% 10% 15% 20% 25% 30% 35%
UK CY MT NL SK BG ES DE PL CZ LT SI LV FR IT AT IE PT EE HR DK BE RO SE FI IS CH NO
Only 1 in 5 are
taught by
digitally
confident and
supportive
teachers
potential of new technology, the question of how ICT is used in learning is even more pertinent than asking if ICT is used. With respect to science teaching, data from TIMSS 2011 show certain limitations to the level of integration of new technologies in lessons. More advanced use of computers to conduct experiments or simulations of natural phenomena is far less commonplace than other types of use during lessons32.
Results from the 2011-12 Survey of Schools: ICT in Education33 show that students’ frequency of ICT-based activities for learning in the classroom increase when schools have specific formal policies to use ICT in their teaching and learning and, even more importantly, implement concrete support measures at school level (such as facilitating teachers' participation in training, availability of an ICT coordinator, etc.). However, in the EU only around 30% of students at grade 4 and around 25% at the other grades (grade 8 and 11) are in such digitally supportive schools and as much as 35% of students are in schools characterised by both weak policy and weak support.
[image:20.595.74.526.320.598.2]As mentioned in relation to the results from TIMSS 2011, the key issue is to really integrate ICT as a teaching and learning tool in mainstream practices, which does not simply mean more electronic devices or more broadband connections. The combination of innovative pedagogies with an effective use of digital tools and content can boost education and training in terms of quality, equity and efficiency.
Table 2.2. Use of computers in school and during science lessons (%)
% of grade 4 students who use
computers at school % of grade 4 students using computers at least monthly during science lessons (TIMSS 2011)
TIMSS 2007 TIMSS 2011
To Look Up Ideas
and Information
To Do Scientific Procedures or
Experiments
To Study Natural Phenomena
Through Simulations
To Practice Skills and Procedures
Belgium (Flemish) : 68.8 78 (3.3) 21 (3.3) 26 (3.4) 56 (3.8)
Czech Republic 51.1 69.6 45 (4.1) 22 (3.4) 16 (3.0) 37 (4.2)
Denmark 78.8 79.8 71 (3.4) 25 (3.7) 37 (4.5) 45 (3.9)
Germany 37.5 51.0 54 (3.2) 14 (2.4) 15 (2.4) 23 (2.9)
Ireland : 69.8 55 (3.9) 29 (3.5) 35 (3.4) 30 (3.5)
Spain : 60.7 33 (3.5) 21 (3.2) 20 (3.3) 29 (3.5)
Croatia : 26.8 13 (2.2) 7 (1.5) 5 (1.4) 12 (2.3)
Italy 63.2 60.0 28 (3.1) 21 (2.8) 18 (2.7) 23 (2.9)
Lithuania 21.9 37.9 45 (4.1) 30 (3.3) 21 (2.8) 41 (3.8)
Hungary 42.9 78.1 34 (3.5) 14 (2.5) 15 (2.6) 27 (3.2)
Malta : 80.3 65 (0.1) 50 (0.1) 39 (0.1) 59 (0.1)
Netherlands 83.2 85.6 58 (5.0) 13 (3.4) 16 (3.4) 27 (4.5)
Austria 37.4 42.8 60 (3.5) 20 (2.6) 20 (2.8) 32 (3.3)
Poland : 56.9 16 (2.8) 7 (2.0) 11 (2.5) 13 (2.8)
Portugal : 59.9 46 (5.3) 29 (3.9) 30 (4.2) 39 (4.3)
Romania : 37.8 23 (3.5) 21 (3.2) 21 (3.3) 23 (3.5)
Slovenia 33.3 45.3 37 (3.6) 12 (2.1) 20 (2.7) 21 (3.0)
Slovakia 46.7 70.0 42 (3.2) 17 (2.3) 24 (2.7) 43 (3.2)
Finland : 80.6 59 (3.7) 17 (2.7) 15 (2.2) 42 (3.5)
Sweden 58.5 66.8 49 (4.6) 11 (3.1) 10 (2.5) 21 (3.5)
UK (England) 85.8 96.6 68 (5.0) 40 (4.8) 51 (5.1) 43 (4.8)
UK (Northern Ireland) : 97.3 73 (3.9) 47 (4.0) 42 (4.3) 53 (4.4)
Source: IEA (TIMMS 2007 and 2011).
The Communication on Opening Up Education stresses the role of teachers as key agents for such change. The results from the 2011-12 Survey of Schools underpin this. While 70% of teachers in the EU recognise the importance of training in ICT-supported pedagogies, only around 20% of students are taught by digitally confident and supportive teachers having high access to ICT and facing low obstacles to their use at school. However, the survey also shows that teachers who are highly confident and positive about the use of ICT can overcome low access to equipment and other obstacles affecting the provision of ICT use in teaching and learning.
32 Similar findings from TIMSS (2007) are analysed in Eurydice report (2011), Key data on Learning and Innovation
through ICT at School in Europe 2011.
33 European Commission (2013), Survey of Schools: ICT in Education. Benchmarking Access, Use and Attitudes to
Teacher training
on the
pedagogical use
of ICT is rarely
compulsory
Current experiences show that sharing and collaborating are proven to be successful in changing attitudes and introducing new innovate ways of teaching and learning34. This is demonstrated by the strong engagement of teachers in the communities of practices of the e-Learning Portal35 or of the e-Twinning36, with more than 200,000 registered users and 100,000 schools. An Electronic Platform for Adult Learning in Europe is also in development. The 2011-12 Survey of Schools found that around 30% of students at grade 4, 8 and 11 are taught by teachers having participated in online communities for professional exchange amongst other teachers, there is thus scope for further strengthening teachers’ participation in these collaborative practices.
The 2011-12 Survey of Schools shows that teacher training on the pedagogical use of ICT is rarely compulsory (only for 25-30% of teachers depending on the grade). Teachers’ participation in courses on the pedagogical use of ICT in teaching and learning also varies considerably between countries. In LT, around 70% of students or more across all grades are taught by teachers who have undertaken such courses (with similarly high figures for one or more grades in ES, EE, SI and LV). By contrast, only around one third of students across all grades in BE are taught by teachers who have participated in these types of courses (figures of less than 30% can also be found for one or more grade in AT, LU, FR, EL and IT).
The impact and new possibilities offered by technological advances is also felt in higher education and in adult learning. As underlined in the two Communications on European Higher Education in the World and Opening Up Education, the appearance of phenomena like MOOCs is pushing for a globalisation of educational markets. In the US, the three main MOOC providers offer around 400 courses, with 3 million users worldwide, and Europe is currently lagging behind. Few European universities are providing MOOCs (e.g. only 9 are involved in Coursera37) and a recent EUA survey38 shows that many European universities are not even aware of what a MOOC is. To strengthen the evidence-base in the area of technological advances in higher education and adult learning, the Commission is launching various studies this year to strengthen the evidence-base in the area of technological advances in higher education and adult learning. In order for society and individuals to make full use of the competences acquired through online learning and OER, recognition of such learning will be considered in the development of the European policy instruments (see chapter 2.3).
Digital competences
If learners of all ages are to benefit fully from the opportunities for more engaging, effective and inclusive learning offered by new technologies, digital competences are a prerequisite. The 2012 Communication on Rethinking Education39 emphasised the importance of building the right skills for the 21st century, and developing digital competence is part and parcel of this set of skills, knowledge and attitudes.
Recent results on 8th and 11th grade pupils' confidence in their ICT skills are available from the 2011-12 Survey of Schools: ICT in Education40. As can be seen in Figure 2.4, the results show that pupils express higher confidence in their ability to use the internet safely and lower confidence in their social media skills than in the other ICT skills they were asked about.
The analysis of the survey results finds a positive link between confidence in these ICT skills and the use of ICT at home and at school. Students with high access/use of ICT both at home and at school are more confident in their ICT skills than those who only report high access/use at home and not at school, or low access/use both at home and at school. These students are not only
34 See e.g. chapter 4 of European Commission (2013): Study of the impact of eTwinning on participating pupils,
teachers and schools.
35 See http://www.elearningeuropa.info.
36 See http://www.etwinning.net.
37
http://www.eua.be/news/13-02-25/Massive_Open_Online_Courses_MOOCs_EUA_to_look_at_development_of_MOOCs_and_trends_in_innovative_lear ning.aspx.
38 Ibid.
39 COM (2012) 669 final.
40 European Commission (2013), Survey of Schools: ICT in Education. Benchmarking Access, Use and Attitudes to