ζ
o
Û ILI
en en en
Insurance
in Europe
Data 199597
E U R O P E A N
η
eurostat
o
Q LU en
&
en
Insurance
in Europe
Data 199597
.4;
¡':> '
E U R O P E A N
C O M M I S S I O N
'Δ
W&
eurostat
e u r o s t a t STATISTICAL O F F I C E O F T H E E U R O P E A N C O M M U N I T I E S
L-2920 Luxembourg — Tel. 43 01-1 — Telex COMEUR LU 3423 B-1049 Brussels, rue de la Loi/Wetstraat 200 — Tel. 29-91 111
A great deal of additional information on the European Union is available on the Internet. It can be accessed through the Europa server (http://europa.eu.int).
Cataloguing data can be found at the end of this publication.
Luxembourg: Office for Official Publications of the European Communities, 1999 ISBN 92-828-7719-1
© European Communities, 1999
Printed in Luxembourg
Insurance in Europe
EDITION 1999
Data 1997
Unit D2 of Eurostat, responsible for structural business statistics has managed this publication. The opinions expressed are those of the individual author alone and do not necessarily reflect the position of the European Commission.
Head of unit: Bernard Langevin Eurostat D2
Editors: August Götzfried Eurostat D-2
Statistical Office of the European Communities Bâtiment Joseph Bech
5. rue Alphonse Weicker L-2721 Luxembourg
Production:
data processing, statistical analysis, economic analysis, desk top publishing World Systems (Europe) Limited, general @wsel.lu
Christiane Gengler, Nicole Muller-Nei, Laurent Parisse, Anne-Elisabeth Petit
Enquiries regarding the purchase of data should be addressed to: Eurostat Datashop
4, rue Alphonse Weicker L-2014 Luxembourg tel: (+352) 4335 22 51 fax: (+352) 4335 22221 [email protected]
A great deal of additional information on the European Union is available on the Internet. It can be accessed through the Europa server at
http://europa.eu.int
ACKNOWLEDGEMENTS
Eurostat and Directorate-General XV acknowledge the valuable contributions of all participants. This second comprehensive reference document on Insurance in Europe would not have been possible without the Member States' data collection, analysis and advice. Likewise, the input of DG XV has been of great assistance.
ca
ca
ω
Contributors:
Financial and Insurance Supervisory National Statistical Institutes: Authorities:
Β Office de Contrôle des Assurances Institut National de Statistique
D K Finanstilsynet Danmarks Statistik
D Bundesaufsichtsamt für das Versicherungswesen Statistisches Bundesamt
E L Ministry of Development - Direction of Insurance National Statistical Service of Greece (NSSG) Undertaking
E Dirreción General de Seguros Instituto Nacional de Estadística (INE) F Commission de Contrôle des Assurances Institut National de la Statistique et des Etudes
Economiques (INSEE) I R L Department of Enterprise and Employment Central Statistics Office (CSO) I Istituto per la vigilanza sulle assicurazioni private e Istituto Nazionale di Statistica (ISTAT)
di interesse collettivo / Commissione di Vigilanza sui Fondi Pensione
L Commissariat aux Assurances Service Central de la Statistique et des Etudes Economiques (STATEC)
Centraal Bureau voor de Statistiek (CBS)
Österreichisches Statistisches Zentralamt (ÖSTAT) Instituto Nacional de Estatistica (INE)
Statistics Finland Statistics Sweden
Office for National Statistics (ONS) Statistical Bureau of Iceland Statistik Sentralbyrå Bundesamt für Statistik
NL
A
Ρ
FIN
S UK
IS
Ν
CH
Verzekeringskamer
Bundesministerium für Finanzen Instituto de Seguros de Portugal Ministry of Social Affairs and Health Finansinspektionen
H.M. Treasury
Financial Supervisory Authority Kredittilsynet
FOREWORD
Work on Insurance Services Statistics is carried out on the initiative of the European Commission, in particular of the Statistical Office of the European Communities (Eurostat) and of Directorate-General XV (responsible for the Internal Market and Financial Services).
Based on the principal aim of the European Single Act, the European single market in insurance was built progressively. With the coming into force of the third generation of EU insurance directives in July 1994, considerable deregulation and harmonisation was achieved. In order to take advantage thereof, it is more and more important to get sufficient information on the EEA insurance markets. Eurostat has therefore introduced a new annex to the Regulation on Structural Business Statistics in February 1998, which is a specific module for Insurance Services Statistics. Now for the first time, Eurostat can offer a harmonised set of data on a wide range of services activities, including insurance services. Information on the sector is increasingly requested from all kinds of users, in order to measure the impact of the single market on insurance and to assess the changes the introduction of the Euro will lead to, such as globalisation, rationalisation, structural changes in the markets, increased competition, etc. The information produced will help policymakers to assess the effectiveness of EU legislation, i.e. the Third Generation Directives as well as to prepare new measures for the completion of the single insurance market.
As the insurance services statistics is largely based on existing directives in the insurance area (especially Directive 91/674/EEC on the annual accounts and consolidated accounts of insurance undertakings), both data quality and availability are very good. The present publication is already the second comprehensive report by Eurostat on insurance services. The previous one was published during the summer 1996 and contained mainly data on the reference years 1992 and 1993, still on a non-harmonised basis. The present volume covers information up to the reference year 1997. It reviews first the situation of the European insurance market among the world's leading insurance markets and then studies all the contributing countries (European Economic Area and Switzerland) in a comprehensive comparative analysis. National markets are also presented in individual chapters with data only.
We sincerely hope that this report on EEA Insurance Services Statistics will become a reference publication for all producers and users working in the insurance area and that it will also serve as a basic reference document for the general public interested in insurance data.
Ma
GENERAL REMARKS
Throughout the publication, data with financial values are expressed in European currency units (ECU).
The sign - stand for not applicable throughout the publication while the sign: stands for not available.
When no data was provided for 1997, 1996 or even 1995 data were used instead whenever these were available.
Throughout the publication aggregates are given when possible for the European Union (EU-15= Belgium, Denmark, Germany, Greece, Spain, France, Ireland, Italy, Luxembourg, the Netherlands, Austria, Portugal, Finland, Sweden, the United Kingdom), the Euro-zone (EUR-11= Belgium, Germany, Spain, France, Ireland, Italy, Luxembourg, the Netherlands, Austria, Portugal, Finland) and the European Economic Area (EEA = EU-15, Island and Norway) Data from Liechtenstein are not yet covered.
Comparability of data is not yet perfect for some items of the profit and loss account as Member States have been using sometimes different options offered by Commission Regulation (EC) No 1225/99 concerning the definition of characteristics for insurance services statistics.
ECU exchange rates as well as country, currency codes and harmonised inflation rates are given for information in the tables below.
ECU exchange rates, annual average (1993-97):
Country
Β DK D
EL E
F IRL
I
L NL A Ρ FIN
S
UK
IS
Ν CH US JP
Currency code
BEF DKK DEM GRD ESP FRF IEP ITL LUF NLG ATS PTE FIM SEK GBP ISK NOK CHF USD JPY
ECU
1993
40.4713 7.59359 1.93639 268.568 149.124 6.63368 0.79995 1841.23 40.4713 2.17521 13.6238 188.370 6.69628 9.12151 0.77998 79.2528 8.30954 1.73019 1.17100 130.148
1994
39.6565 7.54328 1.92453 288.026 158.918 6.58262 0.79361 1915.60 39.6565 2.15827 13.5396 196.896 6.19077 9.16308 0.77590 83.1063 8.37420 1.62128 1.18952 121.322
1995
38.5519 7.32804 1.87375 302.989 163.000 6.52506 0.81552 2130.14 38.5519 2.09891 13.1824 196.105 5.70855 9.33192 0.82878 84.6853 8.28575 1.54574 1.30801 123.012
1996
39.2986 7.35934 1.90954 305.546 160.748 6.49300 0.79344 1958.96 39.2986 2.13973 13.4345 195.761 5.82817 8.51472 0.81379 84.6558 8.19659 1.56790 1.26975 134.084
1997
40.5332 7.48361 1.96438 309.355 165.887 6.61260 0.74751 1929.30 40.5332 2.21081 13.8240 198.589 5.88064 8.65117 0.69230 80.4391 8.01861 1.64400 1.13404 137.077
Harmonised inflation rates (1993-97):
Country Variation in % in relation with the previous year
1993 1994 1995 1996 1997
Β DK D EL E F IRL I L NL A
Ρ
FIN S UK IS Ν CH
US JP
2.75 1.26 3.58 14.42 4.60 2.06 1.40 4.45 3.59 2.60 3.63 6.43 2.18 4.65 1.56 4.08 2.27 3.30 2.95 1.26
2.38 1.98 2.73 10.92 4.70 1.76 2.33 4.00 2.19 2.80 2.96 5.24 1.09 2.20 2.48 1.55 1.40 0.86 2.61 0.70
1.47 2.09 1.84 9.28 4.69 1.68 2.56 5.18 1.92 1.92 2.24 4.14 0.98 2.53 3.41 1.65 2.46 1.79 2.81 -0.09
2.10 2.10 1.50 8.50 3.60 2.10 1.70 3.90 1.40 2.10 1.90 3.10 0.60 0.50 2.40 2.30 1.30 0.80 2.90 0.20
1.60 2.20 1.80 5.50 2.00 1.20 1.50 2.00 1.40 2.30 1.30 1.80 1.20 0.50 3.10
CONTENTS
FIRST PART: Paneuropean trends
1. European insurance within world's insurance industry 3
2. European insurance in the economy 7
3. General trends in the European insurance markets 9
3.1. Number of enterprises on the decline 9
Special feature: Towards consolidation of insurance markets 11
3.2. Trends in the volume of premiums 12
4. Structure of the European insurance markets 14
4.1. Structure of the insurance enterprises 14
4.2. The legal status of direct insurance enterprises 16
Special feature: Towards demutualisation 20
4.3. Relation of premiums volume to the legal status of enterprises 21
4.4. The average size of insurance enterprises 23
4.5. Structure of the insurance premiums 27
4.5.1. The dominating markets 27 4.5.2. Shares of life and non-life business on total premiums 29
Special feature: gross direct premiums of life insurance enterprises
according to the type of contract 31 4.5.3. Shares of life and non-life premiums per capita 32
o. Main financial indicators oí insurance enterprises 35
5.1. Profit and loss account of insurance enterprises 35
5.2. Balance sheet of insurance enterprises 41
5.2.1. Investments 41 5.2.2. Gross technical provisions 47
5.2.3. Capital and reserves 50
6. Main insurance products 52
6.1. Life insurance products 52
6.2. Non-life insurance products 53
Special feature: Road transport and safety 58
7. The internationalisation of insurance enterprises 61
7.1. Number of branches abroad of life and non-life insurance enterprises. 61
7.2. Cross border activities via branches 63
SECOND PART: Country Analysis
1. Belgium 69 2. Denmark 73 3. Germany 77 4. Greece 81 5. Spain : 83
6. France 87 7. Ireland 91
8. Italy 95
9. Luxembourg 9910. The Netherlands 103
11. Austria 105 12. Portugal 107 13. Finland 111 14. Sweden 115 15. The United Kingdom 119
16. Iceland 121 17. Norway 125 18. Switzerland 129
Glossary
FIRST PART
Paneuropean Trends
1. EUROPEAN INSURANCE WITHIN THE WORLD'S
INSURANCE INDUSTRY
Despite the generally good economic situation across the countries under consideration in the late 1990's - with the notable exception of Japan suffering from the Asian crisis - the insurance industry does not generally show a striking growth. The benefits of the economic growth have indeed been offset in most markets by the race to competition.
In the non-life sector, growing competition is amongst other reasons due to deregulation, which leads to free pricing instead of government fixed rates. Liberalisation has resulted in a stabilisation of growth if not a decrease in premiums. Still enterprises are endeavouring to increase their performances by saving for example on administrative costs. Mergers and acquisitions are also used to increase synergy and foster good results. Fewer natural catastrophes in 1997 and lower claims in certain branches - e . g . motor vehicle- also helped obtain overall good results.
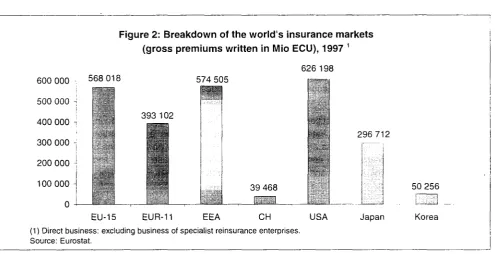
In 1997, shares of gross premiums written in direct business (excluding business of specialist reinsurance enterprises) in the countries under consideration were of 39.5% in the USA, followed by 35.8% in the European Union (UE), 18.7% in Japan, 3.2% in Korea, and 2.5% and 0.4% respectively in Switzerland and the other European Economic Area (EEA) countries.
Figure 1 : Breakdown of the world's largest insurance markets (in % of gross premiums written), 1997 1
S Korea I Japan 3 2°/0
18.7% - ^ — n- DEU-15
35.8%
C USA π CH
39.5% 2.5% (1) Direct business: excluding business of specialist reinsurance enterprises.
Source: Eurostat.
Other EEA 0.4%
Paneuropean Trends
Figure 2: Breakdown of the world's insurance markets (gross premiums written in Mio ECU), 1997 1
600 000 500 000 ; 400 000 π 300 000 -J 200 000 ·] 100 000
0
568 018
EU-15
626 198 574 505
393 102
39 468
:■
296 712
50 256
EUR-11 EEA CH USA Japan Korea
(1) Direct business: excluding business of specialist reinsurance enterprises. Source: Eurostat.
Considering the number of enterprises active in the different markets, the concentration phenomenon is more evident in the EEA, whilst in Switzerland, the USA and Japan, the number of enterprises has still been increasing. Indeed, between 1993 and 1997, EEA, EU-15 and EUR-11 have experienced a drop in the number of enterprises respectively of 20.2%, 20.4% and 27.6%. On the contrary, in Japan, the growth has been of 25.8% during the period.
Table 1 : Evolution of number of insurance enterprises and of gross premiums written in Europe 1
Number of enterprises Gross premiums written (Mio ECU)
EU-15 EUR-11
EEA CH USA Japan Korea
1993 4 840 3 446 5 000
123
4 809
93
50
1995 3 801 2 521 3 936
127
4 700
98
50
1997 3 852 2 494 3 991
132
5 162
117
50
1993
274 776 297 623 30 394 602 056 318 481 37 406
1995 458 709 334 701 463 951 34 470 583 817 342 872
44 723
1997 564 378 389 296 570 866 39 468 626 198 296 712 50 256 (1) Excluding specialist reinsurance enterprises.
Source: Eurostat.
[image:18.595.37.533.80.334.2]Paneuropean Trends
Looking at premiums written per capita, in 1993 European countries' and USA populations were still spending more on non-life premiums than on life insurance. In Japan and in Korea, life insurance was already the predominant expenditure.
Table 2: Life and non-life gross premiums written per capita (in ECU), 1993 and 1997
Lite insurance premiums
1993 1997
Non-life insurance premiums
1993 1997
EUR-11 CH USA Japan Korea
441 2 152 884 1 878 641
690 3 242
933 1 686
799
515 2 248 1 450 683 211
651 2 332 1 417 667 301
[image:19.595.70.564.270.632.2]Source: Eurostat.
Figure 3: Breakdown of gross direct premiums written in life and non-life insurance in the world (share on the total gross direct premiums), 19971
100%
50%
0%
U Non-life insurance premiums
π Life insurance premiums
EU-15 EUR-11 EEA CH USA Japan Korea
(1) Direct business: excluding business of specialist reinsurance enterprises. Data for I and UK are estimations.
Source: Eurostat.
Speaking in terms of gross direct premiums, in 1997, the USA is the only country that still spends more on non-life than in non-life insurance: 60.3% against 39.7%. EU countries reach 55.5% of total gross direct premiums spent on life, Switzerland 58.2%, while Japan and Korea make more than 70%.
As in 1993, average gross direct premiums written per capita in the EEA remain in 1997 well below the American and Japanese levels, leaving in theory large scope for growth in European Member States.
m
Paneuropean Trends
2.
EUROPEAN INSURANCE IN THE ECONOMY
[image:21.595.66.556.203.662.2]In 1997, the 4 212 EU insurance enterprises active in the European Union are made up of 948 life insurance enterprises, 2 626 non-life insurance enterprises, 278 composite insurance enterprises and 360 specialist reinsurance enterprises. Composite insurance enterprises, enterprises allowed to carry out both life and non-life insurance business, do only exist in a few Member States: Belgium, Greece, Spain, France, Italy, Austria, Portugal and United-Kingdom.
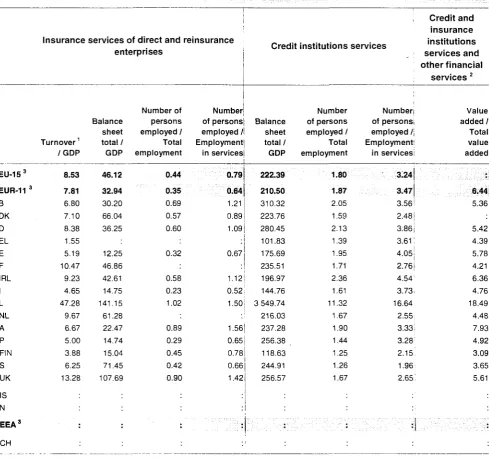
Table 3: Insurance in the economy (%), 1997
EU-153 EUR-11 3 Β DK D EL E F IRL I L NL A Ρ FIN S UK IS Ν Insurance Turnover1 /GDP 8.53 7.81 6.80 7.10 8.38 1.55 5.19 10.47 9.23 4.65 47.28 9.67 6.67 5.00 3.88 6.25 13.28
services of direct and reinsurance enterprises Balance sheet total / GDP 46.12 32.94 30.20 66.04 36.25 12.25 46.86 42.61 14.75 141.15 61.28 22.47 14.74 15.04 71.45 107.69 Number of persons employed / Total employment 0.44 0.35 0.69 0.57 0.60 0.32 0.58 0.23 1.02 0.89 0.29 0.45 0.42 0.90 Number of persons employed / Employment in services 0.79 0.64 1.21 0.89 1.09 0.67 ■ 1.12 0.52 1.50 1.56 0.65 0.78 0.66 1.42
Credit institutions services
Balance sheet total/ GDP 222.39 210.50 310.32 223.76 280.45 101.83 175.69 235.51 196.97 144.76 3 549.74 216.03 237.28 256.38 118.63 244.91 256.57 Number of persons employed / Total employment 1.80 1.87 2.05 1.59 2.13 1.39 1.95 1.71 2.36 1.61 11.32 1.67 1.90 1.44 1.25 1.26 1.67 Number of persons employed / Employment in services 3.24 3.47 3.56 2.48 3:86 3.61 4.05 2.76 4.54 3.73 16.64 2.55 3.33 3.28 2.15 1.96 2.65
Credit and insurance institutions services and other financial
services 2
Value added / Total value added : 6.44 5.36 5.42 4.39 5.78 4.21 6.36 4.76 18.49 4.48 7.93 4.92 3.09 3.65 5.61 EEA CH
(1) Gross premiums written.
(2) Source: National Accounts. Encompasses financial intermediation services such as those offered by credit institutions, investment firms, leasing enterprises, but also insurance and pension funding services provided by life, non-life insurance, reinsurance enterprises and pension funds. Also covers a third group, made up of entities providing services auxiliary to financial intermediation such as agents or brokers.
(3) For available data only.
Source: Eurostat.
Ξ 3
Paneuropean Trends
Table 3 shows the contribution of insurance services to the European economy in terms of economic weight and employment. Table 3 also offers a comparison with credit institutions, which are the other major player in the financial services sector for which harmonised and comparable statistical data is available at an international level.
Employment in the insurance sector in the EU accounts for less than 0.5% of total employment and only 0.8% of employment in services. The figures of insurance employment do not consider brokers, agents or other intermediaries as these are covered by another NACE class (67.2) for which reliable statistics do not exist yet. Employment in banking is comparatively higher, accounting for 1.8% of total employment and 3.2% of employment in services across the EU.
At country level, the ratio on total employment shows little differences, insurance services range from 0.23% in Italy to 1% in Luxembourg.
To highlight the importance of the insurance industry within the whole economy, gross premiums written are compared to the gross domestic product (gross premiums written are indeed considered as an equivalent to turnover for insurance enterprises). The turnover for all insurance enterprises (including specialist reinsurance enterprises) range from 3.9% of the GDP in Finland to 47.3% in Luxembourg, while the EU average contribution to GDP is of 8.5%. Contribution of the insurance industry to the gross domestic product has generally been strengthening and for one country, Luxembourg, it has been booming.
Paneuropean Trends
3.
GENERAL TRENDS IN THE EUROPEAN INSURANCE
MARKETS
3.1.
Number of enterprises on the decline
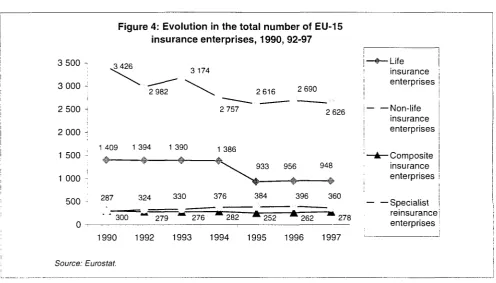
Figure 4: Evolution in the total number of EU-15 insurance enterprises, 1990, 92-97
3 500 -3 000 2 500 -2 000 H
1 500 -j 1 000
-500 · 0
-^3 426
3 174
2 982
1 409 1 394 1 390
2 616 2 690
2 757
1 386
2 626
933 956 948
279 276 282 252
396 360
262 278
1990 1992 1993 1994 1995 1996 1997
Source: Eurostat.
■Life insurance enterprises
■Non-life insurance enterprises
•Composite insurance enterprises
■ Specialist reinsurance enterprises
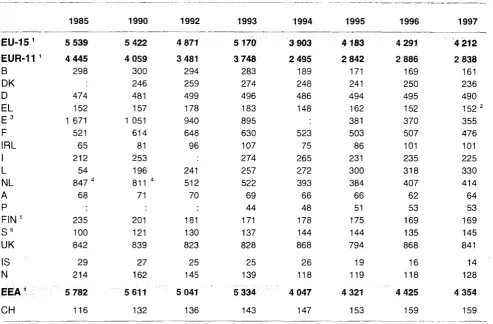
The number of insurance enterprises in the European Union - considering the total of direct insurance and specialist reinsurance enterprises - has followed a decreasing trend in the last 7 years; it has fallen from 5 422 in 1990 to 4 212 in 1997. In the EEA, the figure has fallen from 5 611 in 1990 to 4 354 in 1997. On a country by country basis however, all markets have not always experienced a drop in the number of market players between 1990 and 1997. The following countries all saw the total number of insurance enterprises decline: Belgium (-139), Denmark (-10), Greece (-5), Spain (-696), France (-138), Italy (-28), Netherlands (-397), Austria (-7), Finland (-32), Iceland (-13), and Norway (-34). In other countries like Germany (+9), Ireland (+20), Luxembourg (+134), Sweden (+24), United Kingdom (+2) and Switzerland (+27), the number of enterprises has increased.
In terms of average annual change, the most dramatic changes have taken place on the increase side in Luxembourg with a 7.7% growth and Ireland with 3.2% and, on the decrease side, in Belgium (-8.5%) and Iceland (-9%). The considerable changes in Ireland and Luxembourg are explained by the increasing importance of these countries as Financial Places. Their notoriety as Financial Places is explained by the attractiveness through favourable treatment (national taxation, but also in general) of the enterprises and the customers. The drop in the total number of enterprises in Spain is mainly due to a change of data coverage; since 1995, Spanish data have ceased to include some 400 social benefit institutions which are non-profit making mutuais providing cover complementary to social security schemes. Similarly, some enterprises in the Netherlands include up to 1990 a number of local mutuais, which are not covered any more after this date.
m
[image:23.595.65.562.150.433.2]Paneuropean Trends
Table 4: Evolution in the total number of insurance enterprises, 1985-1997
EU-15 1
EUR-11 1
Β
DK
D
EL
E
3F
IRL
I
L
NL
A
Ρ
FIN5S
6UK
IS
Ν
EEA1CH
1985 5 539 4 445 298 474 152 1 671521 65 212 54
847 4
68 235 100 842 29 214 5 782 116 1990 5 422 4 059 300 246 481 157 1 051
614 81 253 196
811 4
71 201 121 839 27 162 5 611 132 1992 4 871 3 481 294 259 499 178 940 648 96 241 512 70 181 130 823 25 145 5 041 136 1993 5 170 3 748 283 274 496 183 895 630 107 274 257 522 69 44 171 137 828 25 139 5 334 143 1994 3 903 2 495 189 248 486 148 523 75 265 272 393 66 48 178 144 868 26 118 4 047 147 1995 4183 2 842 171 241 494 162 381 503 86 231 300 384 66 51 175 144 794 19 119 4 321 153 1996 4 291 2 886 169 250 495 152 370 507 101 235 318 407 62 53 169 135 868 16 118 4 425 159 1997 4 212 2 838 161 236 490
152 2
355 476 101 225 330 414 64 53 169 145 841 14 128 4 354 159
(1) For available data only. (2) 1996 data.
(3) From 1995 onwards, excluding social benefit institutions. (4) Including about 270 local mutuals.
(5) Including about 120 local mutuals. (6) Excluding 330 minor local companies.
Source: Eurostat.
The number of composite insurance enterprises in the EU has decreased by 7.3% between 1990 and 1997, from 300 to 278; no further setting up of composite insurance enterprises is likely to take place. Therefore, their number will continue to follow a decreasing trend. EU specialist reinsurance enterprises on the contrary increased by 25.4% or from 287 entities in 1990 to 360 in 1997. This result is mostly due to the growing importance of Luxembourg as a reinsurance centre; the number of specialist reinsurance enterprises in Luxembourg increased from 184 entities in 1993 to 255 in 1997. They represent 77.3% of insurance enterprises in Luxembourg.
Generally, the figures confirm the current tendency to concentration of the markets following the tougher competition brought up by the single insurance market. In order to survive, maintain their market share or improve it, in an increasingly competitive market, insurance enterprises have to find a new situation as multinationals or in niches, as specialists in specific products or clients, thereby cutting down costs, increasing the geographical scope of their business, etc.
Paneuropean Trends
SPECIAL FEATURE: TOWARDS CONSOLIDATION OF INSURANCE MARKETS:
The phenomenon of concentration continues these days; lately, some already large enterprises are facing competition through mergers or acquisitions.
In 1998 and early 1999 a wave of mergers and acquisitions has been flooding Europe. They are taking place in all fields of industries and services: ranging from telecommunication services, to the fashion industry. The financial services are not spared, as the evolution in the number of enterprises well shows. Both the banking and the insurance industry have seen such activities develop inside each industry but also combined with one another to create a new sector: bancassurance (e.g. Toro Assicurazioni and Banca di Roma). Although most merger activities remain within national boundaries, in some cases they are paneuropean. In the insurance sector, famous mergers at national level are Commercial Union and General Accident (UK), Generali and AMB (I). Considering cross-border mergers, AXA second non-life insurer in the French market took over the British company Guardian Royal Exchange (number six of the UK market), in early 1990 and, before that, in 1998, Allianz acquired AGF. This globalisation process in the financial area is not only taking place in Europe but also overseas as is confirmed by the largest merger of all, which took place in the United States: Travellers and Citicorp.
The race toward globalisation also takes place through transatlantic transactions. The Dutch group Aegon, for instance, set a new record in the spring 1999 when they bought Transamerica Corp for over ECU 9 billion. Aegon has become the US' third-largest life insurer and the world's third-largest insurance firm through capitalisation, behind American International Group and Allianz. The latter has recently agreed to take a controlling stake in First Life Insurance, South Korea's fourth-largest life insurer, and bought two companies in Taiwan.
The concentration process is likely to continue over the next years and the number of insurance enterprises will continue on a downward curve. The increase of the concentration and globalisation process raises the anti-trust problem. To avoid this, the European Commission assesses the level dominance of potential operations, considering both the positions on products and the geographical areas of activities. If dominance is proven, then arrangements are sought and if not found the operation is aborted. This control of the concentration and globalisation process is all the more important since European policies are increasingly fostering competition.
m
Paneuropean Trends
[image:26.595.39.537.133.472.2]3.2.
Trends in the volume of premiums
Table 5: Evolution in gross premiums written1, 1993-1997 (Mio ECU)
EU-153 EUR-11 Β DK D EL E F IRL
L NL A Ρ FIN S UK
IS Ν
E E A3 CH
1993
312 314
300 632
10917
113 023
19 428 87 836 3 969 29 329
22 751 8 408 2 570 2 401 11 682
196
5 095
317 605
37 638
1994 1995
11 61E 8 07£ 139 904
24 80Ê
2 97Ê 2 56E 11 082
5 382
509 914
385 370
12 988 8 595 151 710
21 128 114 262 3 693 30 072 5 352 27 917 11 111 3713 3 423 11 014 104 934
5 263
515177
41 107
1996
567 086
412 979
13814 9 637 153 455 1 640 23 776 122 853
4 511 39 105 5 505 29 215 12 161 4 393
4 191
12 532 130 298
184
5 353
572 624
47 431
1997
609 606
433 886
14 544 10 232 154 578 1 6 4 0 " 25 037 127 957 6 287 47 035 6 847 30 869 12 124 5
4 499 4 109 12 561 151 288
192
6 309
616 107
46 468
Growth rate, 1997/93 (%)2
:
\ 33.4 21.6 38.7
43.4 45.2 48.0 68.0 34.5 37.9 33.9 84.5 50.3
2.0
-0.8
19.5
17.3
(1) Including specialist reinsurance enterprises. (2) Calculated on national currencies.
(3) For available data only. (4) 1996 data.
(5) Estimate, including 1996 data for life insurance and life business of composite insurance. Source: Eurostat.
The business written by all insurance enterprises, direct insurance and specialist reinsurance enterprises has been increasing steadily over the period 1995-1997. Total gross premiums written in the EU increased in the period from ECU 509 914 Mio to ECU 609 606 Mio (19.6%). Considering the EEA, the volume rose from ECU 515 177 Mio to ECU 616 107 Mio (19.6%). All EU countries have individually seen the volume of premiums written increase between 1995 and 1997, ranging from 4.7% in Austria and 5.7% in Sweden to 56% in Ireland.
Table 5 also gives a picture of the breakdown of the total gross premiums written by all insurance enterprises in the European Union: Germany comes first with a 25.4% market share, then with a nearly equal share comes the United Kingdom (24.9%). France is ranking third with almost 21%. There is a large gap between the 3 leaders, which hold over 70% of the EUR-15 market share, and the following countries: Italy 7.7% and the Netherlands and Spain, with respectively 5.1% and 4.1% market share only. All other countries have a market share smaller than 2.5%.
Paneuropean Trends
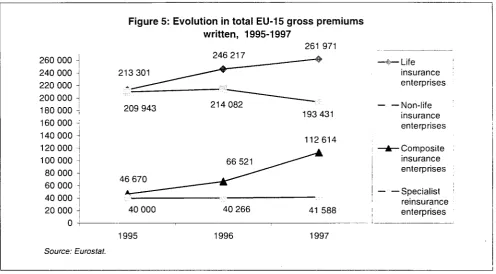
260 000 240 000 220 000 200 000 180 000
-160 000 j
140 000
-120 000 100 000
80 000 -60 000 40 000 ι 20 000 -I
Figure 5: Evolution in total EU-15 gross premiums
213 301
209 943
46 670
40 000
1995
Source: Eurostat.
written, 1995-1997
246 217
214 082
66 521
40 266
1996
261 971
193 431
112614
41 588
1997
■Life insurance enterprises
■Non-life insurance enterprises
-Composite insurance enterprises
-Specialist reinsurance enterprises
Business of life insurance enterprises has increased between 1995 and 1997 across Europe; the growth they recorded in the EU-15 Member States is of 22.8%. On the contrary, non-life insurance enterprises only recorded a drop of 7.9%.
Concerning life insurance enterprises, all Member States have registered an increase of the amount of gross premiums written: Italy (103.4%), Ireland (91.0%), Spain (57.9%), Finland (54.2%), and Belgium (44.9%). The only exception being France which recorded decrease of 13.2%.
Four markets recorded high growth in the activities of non-life insurance enterprises; these are Ireland (47.8%), Austria (22.8%), Italy (19.7%), Portugal (18.6%) and Luxembourg (15.5%) and the United Kingdom has experienced the strongest drop with - 4 1 % . (Data for the United Kingdom has to be analysed carefully).
Even if for several countries the data are unavailable, composite insurance enterprises show an increase of more than 140%, while the amount of the gross premiums written by specialist reinsurance enterprises has risen of only 4%.
m
[image:27.595.63.560.73.347.2]Paneuropean Trends
4. STRUCTURE OF THE EUROPEAN INSURANCE MARKETS
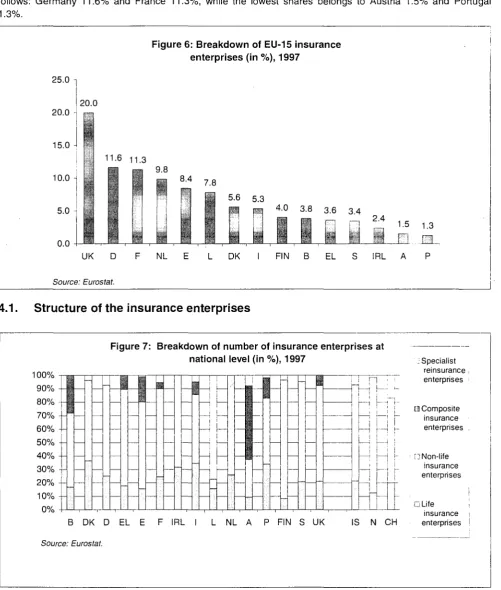
[image:28.595.41.543.146.737.2]UK registers around 20% of active insurance enterprises in EU-15 Member States The Euro-zone represents 67.5% of the total EU-15 insurance enterprises. The weight of the other major countries on the EU total is as follows: Germany 11.6% and France 11.3%, while the lowest shares belongs to Austria 1.5% and Portugal 1.3%.
Figure 6: Breakdown of EU-15 insurance enterprises (in %), 1997
25.0 Ί
20.0
15.0 π
10.0
5.0 H
20.0
0.0
11-6 11.3 9.8
8.4 7.8
5.6 5.3
pa 4.0 3.8 3.6 3.4 2 4
Π 1.5 1.3
Source: Eurostat.
HLS_
UK D F NL E L DK I FIN Β EL S IRL A Ρ4.1. Structure of the insurance enterprises
Figure 7: Breakdown of number of insurance enterprises at national level (in %), 1997
100% 90% 80% 70% 60% 50% 40% 30% 20% 10% 0%
Β DK D EL E F IRL I L NL A Ρ FIN S UK
Source: Eurostat.
Π
1 h
IS Ν CH
] Specialist reinsurance enterprises
α Composite
enterprises
: Non-life insurance enterprises
G Life insurance enterprises
Paneuropean Trends
The United Kingdom has the most insurance enterprises (841), followed by Germany (490), France (476), the Netherlands (414), Spain (355) and Luxembourg (330).
In all countries, life enterprises are outnumbering the other types of enterprises. The average share of non-life insurance enterprises is 62.3% at EU level, ranging from 49.1% in Portugal to 88.2% in Finland. The notable exception is Luxembourg, where 77.3% of enterprises are specialist reinsurance (mostly captives). In Austria, non-life enterprises account for only 28.1% of the total, since the 35 composite enterprises account for 54.7% of the total.
Life insurance enterprises at EU level account for a 22.5% share on the total number of enterprises, with shares ranging from 8.3% in Finland to 34% in Portugal and 36.4% in Denmark.
Table 6: Number of insurance enterprises, 1997
EU-151 EUR-11 1
Β DK D EL2
E F IRL I L NL A Ρ FIN S UK IS Ν
EEA1
CH
Total insurance enterprises 4 212
2 838 161 236 490 152 355 476 101 225 330 414 64 53 169 145 841 14 128 4 354
159
Share on EU-15 total (%)
100.0 67.4 3.8 5.6
11.6
3.6 8.4
11.3
2.4 5.3 7.8 9.8 1.5 1.3 4.0 3.4 20.0
:
Life insurance enterprises 948 628 27 86 123 27 55
116
32 78 52 107 6 18 14 30 177 3 16
967
32
Non-life insurance enterprises 2 626 1 669 89
141
331 109 230 312 69
115
23 307 18 26 149 108 599 10 110 2 746
100
Composite Insurance enterprises 278 213 45 -16 66 22 -21
0 -35
8 -65
-278
-Specialist reinsurance enterprises 360 359 9 36 0 4 26 11 3
255 5 1 6 7
1 2 363 27 (1 ) For available data only.
(2) 1996 data.
(3) Including 4 reinsurance enterprises with head office in an EU country.
Source: Eurostat.
m
Paneuropean Trends
4.2. The legal status of direct insurance enterprises
Table 7: Number of insurance enterprises according to the legal status, 1997
Total 1996 Total 1997 Incorporated enterprises limited by shares
Mutual enterprises
Branches of non-EEA
enterprises Others
EU-15 1 954 948
Life insurance enterprises
612 69 19 44
EUR-11 Β DK D EL2 E F IRL I L NL A Ρ FIN S UK IS Ν E E A1
CH 634 30 86 125 27 58 132 28 76 51 98 6 16 14 30 177 3 9 966 32 628 27 86 123 27 55 116 32 78 52 107 6 18 14 30 177 3 16 967 32 .34 18 53 84 54 94 30 77 50 93 6 17 11 25 63 7 1 25 0 17 0 0 0 11 0 0 3 5 18 0 1 4 1 5 2 1 1 3 0 1 0 0 13 2 31 10 0 0 0 0 1 0 0 0 0 0 615 28 69 3 19 1 44 0
EU-151 2 687
Non-life insurance enterprises
2 626 1121 712 62 23
EUR-11 Β DK D E L2 E F IRL I L NL A Ρ FIN S UK IS Ν
E E A1
CH 1 736 95 159 334 109 240 343 73 127 23 309 20 24 148 105 578 12 107 2 806 100
(1) For available data only. (2) 1996 data.
Paneuropean Trends
Table 7: Number of insurance enterprises according to the legal status, 1997 (Continued)
Total 1996
Total 1997
Incorporated enterprises limited by shares
Mutual enterprises
Branches of non-EEA
enterprises Others
EU-151
EUR-11 Β EL2
E F I L A Ρ UK
262
187 44 16 67 10 22 0 36 8 59
Composite insurance enterprises
278 170 21
197 45 16 66 22 21 0 35 8 65
170 40
54 19 19 0 31 7
21 2
11 3 1 0 4 0
4 2
1 0 0 0 0 1
2 1
0 0 1 0 0 0
EU-15 1
EUR-11 1
Β DK D EL2
E F IRL I L NL A Ρ FIN S
UK
IS Ν
EEA1
CH
387
328
5 36 0 5 22
10 244
54
1 2
390
27
(1 ) For available data only. (2) 1996 data.
Source: Eurostat.
Specialist reinsurance enterprises
360 348 3
344 332 3
9 36 0 4 26
11 255
5 1 6 7
1 2
363
27
9
31 0 4 25
6
255 5 1 5 7
1
349
27
0 1 0 0 1
0 0
0 0 1 0
3
0
9
9
0 4 0 0 0
5 0
0 0 0 0
9
0
m
Paneuropean Trends
Life insurance enterprises
There are 948 life insurance enterprises in EU-15 Member States, most of them are incorporated enterprises limited by shares (82%). Less than 10% of life insurance enterprises are mutuals. The breakdown of life insurance enterprises by legal status is not available for Greece and the United Kingdom.
The 628 Euro-zone life insurance enterprises are made up of 534 incorporated enterprises limited by shares (85%), 63 mutual enterprises (10%), 18 branches of non-EEA enterprises (2.9%) and 13 other enterprises (2.1%) such as public enterprises.
Figure 8a: Life insurance enterprises broken down by legal status, total EU-151, 1997
Mutual enterprises
9%
Branches of non-EEA enterprises
3%
Others 6%
Incorporated enterprises limited by shares
82%
(1) Excluding Greece and the United Kingdom.
Source: Eurostat.
The most common legal status of life insurance enterprises in all countries is that of 'incorporated enterprises limited by shares', whose market shares range from 61.6% in Denmark to 100% in Austria and Iceland. Mutuals represent 25.9% of total life insurance enterprises in Belgium, Finland 21.4%, Germany 20.3%, Sweden 16.7%, France 14.7% and the Netherlands 11.7%.
The number of branches of non-EEA countries is rather low; they are 5 in France and 4 in Germany. Their share in the number of life insurance enterprises reaches 5.6% in Portugal and 6.3% in Ireland.
Non-life insurance enterprises
As shown in figure 8b, the majority of the 2 626 EU-15 non-life insurance enterprises are incorporated enterprises limited by shares (1 121). The remaining is composed by 712 mutuals (37.1%), 62 branches of non-EEA companies (3.2%) and by 23 enterprises classified in 'others' (1.2%). The breakdown of non-life insurance enterprises by legal status for Greece and the United Kingdom is not available.
Incorporated enterprises limited by shares represent almost 60% of the total number of non-life insurance enterprises in the Euro-zone. Mutuals come next with a 35.4% share.
The 60 branches of non-EEA enterprises account for a 3.6% share and the other types of legal status for the remaining 1.4%.
Paneuropean Trends '■■;.. y::::::..::,:--.
The most frequent legal status is clearly that of mutuals in Denmark (57.4%), and Finland (90.6%). In these countries however, mutuals are mostly small businesses, locally active, which do not represent high market shares at national level. The high number of smaller mutuals in some countries has a distorting impact on the share of enterprises by legal status. If they were not considered, incorporated enterprises limited by shares would have an even larger share on the total number of enterprises. The highest share of branches of non-EEA countries is of 1 1 . 1 % in Austria, of 8.7% in Luxembourg and of 6.7% in Belgium. A number of Member States favour the latter countries to set up branches within the EEA.
Figure 8b: Non-life insurance enterprises broken down by legal status, total EU-151,1997
Branches of non-EEA enterprises
Mutual enterprises^
37% L
Incorporated enterprises limited by shares
59%
(1) Excluding Greece and the United Kingdom.
Source: Eurostat.
Composite insurance enterprises
The breakdown of composite insurance enterprises by legal status for Greece and the United Kingdom is not available.
The 262 Euro-zone composite insurance enterprises are mostly incorporated enterprises limited by shares, reaching over 8 0 % in all countries. Mutuals range from a 4.4% share of the total national composite enterprises in Belgium to 16.7% in Spain, while they represent an average 10.7% of the Euro-zone total.
Figure 8c: Composite insurance enterprises broken down by
legal status, total EU-15 \ 1997
Mutual enterprises
-11%
Branches of non-EEA
enterprises 2%
Others
(1) Excluding Greece and the United Kingdom
Source: Eurostat.
Incorporated enterprises imited by shares
86%
m
Paneuropean Trends
Specialist reinsurance enterprises
In EU-15 Member States, 96.7% of specialist reinsurance enterprises are incorporated enterprises limited by shares. Mutuals represent less than 1% of the European insurance enterprises, while 2.5% of these latter have for legal status Others'.
The breakdown of specialist reinsurance enterprises by legal status for Greece and the United Kingdom is not available.
Incorporated enterprises limited by shares represent over 95% of the total Euro-zone reinsurers; the remaining enterprises are 3 mutuals and 9 other entities.
Figure 8d: Specialist reinsurance enterprises broken down by legal status, total EU-15 \ 1997
Mutual
enterprises-\ Others
1%
\
Γ
3%
Incorporated enterprises imited by shares
96% (1) Excluding Belgium, Ireland, the Netherlands and the United Kingdom.
Source: Eurostat.
Looking at the global picture of insurance enterprises, some types of legal status are decreasing at a rate above average. Looking at the 1996-97 period, the number of mutuals and of branches of non-EEA countries has undeniably been declining. The establishment of new mutuals and branches is decreasing despite the often-advantageous tax facilities they offer. Some mutuals have problems in situating themselves in a more competitive environment, which leads to some decreasing figures hereon. In contrast, other mutuals find their way rather well along this more competitive environment and find new business opportunities if necessary.
SPECIAL FEATURE: TOWARDS DEMUTUALISATION:
Demutualisation has been steady lately in most insurance markets. The European Union has not been spared by the phenomenon. Mutuals as well as co-operatives are based on three main principles: collective ownership of their own funds, 'one man one vote' standard for the members and non-profit making. These principles however become more and more difficult to maintain, as they are hardly compatible with the increasingly competitive markets in which they are active where growth and profitability are the leading ideologies. The question is: will mutuals and co-operatives be able to remain efficient competitors without losing their 'raison d'être'? In order to stay on the market, they should be able to build up groups or holdings but they would also need to raise their own or foreign funds more easily. Both issues often call for changes in legislation.
In Canada, the four leading mutual life insurers opted for demutualisation, hoping to finally be able to make new acquisitions, partnerships and alliances. They will be protected by law from take-over for two years after going public. In Europe, some mutuals found different ways of growing, such as creating subsidiaries with legal status of incorporated enterprise limited by share or merging with other mutuals. The future will certainly confirm the trend towards demutualisation, but in the short term, no new mutuals, or at best, fewer of them, are likely to be set up.
Paneuropean Trends
4.3. Relation of premiums volume to the legal status of enterprises
Figure 9a: Gross premiums written by EU-15 1 insurance enterprises
broken down by legal status (Mio ECU), 1997 147 639
120 000 -, 110 000 -j 100 000 \
90 000 -j 80 000 -j 70 000 }
60 000 Ί 50 000 -j 40 000 -j 30 000 -j 20 000 -j 10 000 -I
oí
115 353
15 639
3 231 3 884
76 055
40 620
4 909
2 647
40 572
4 060
269 729 60 950 Life insurance Non-life insurance Composite insurance Specialist reinsurance
Figure 9b: Gross premiums written per EU-15 1 insurance enterprise
broken down by legal status (Mio ECU), 1997 447
213
193
67 365
117
i
20
Τ 0
106
¡ ι
I !
' I
: ι
Life insurance Non-life insurance Composite insurance Specialist reinsurance D Incorporated
enterprises limited by shares
D Mutual enterprises
¡Branches of non-EEA
enterprises
ι Others
(1) Excluding Greece and the United Kingdom.
Source: Eurostat.
m
Paneuropean Trends
Life insurance enterprises
Considering the business of life insurance enterprises, most of it is written by incorporated enterprises limited by shares, which also dominate the market in terms of number of enterprises. For example: in Spain 99% of life insurance premiums are written by incorporated enterprises by shares, which represent 98.2% of total life insurance enterprises. The only exception is Belgium where most premiums are written by mutual enterprises (52.3%) which only account for 25.9% of the total number of life insurance enterprises.
Average premiums per life insurance enterprises are in all countries larger in incorporated enterprises limited by shares. They reach ECU 554 Mio in France, ECU 443 Mio in Germany and ECU 223 Mio in Sweden and as much as ECU 808 Mio in Switzerland. Average premiums under ECU 100 Mio are found in Belgium (ECU 42 Mio), Denmark (ECU 90 Mio), Luxembourg (ECU 75 Mio) and Portugal (ECU 74 Mio). Average premiums per life mutual enterprises are far smaller, ranging from ECU 2 Mio in Denmark and ECU 9 Mio in the Netherlands to ECU 361 Mio in Germany.
Non-life insurance enterprises
As already stated above, Euro-zone non-life insurance enterprises are distributed as follows: 60% incorporated enterprises limited by shares and 35% mutuals. Looking at the volume of premiums in the Euro-zone, incorporated enterprises write 70% of the total volume of non-life enterprises and mutuals 25%. Even in the markets such as Denmark or Finland, where mutuals outnumber incorporated enterprises, their share of premiums is comparatively low: respectively 22.4% and 39.7%. Again this is explained by the fact that most of these mutuals are of only local importance and that their contribution to the total volume of premiums is very limited.
In all Member States, life enterprises enjoy a higher average volume of premiums than non-life enterprises, as premiums per contract are much higher in life insurance due to saving elements. When it comes to the legal status of enterprises, life incorporated enterprises in the Euro-zone reach, as an average, ECU 257 Mio against ECU 109 Mio for non-life. The difference is more striking for mutuals, with an average of ECU 224 Mio for life mutuals and of ECU 65 Mio for non-life mutuals.
Composite insurance enterprises
Composite enterprises are dominated by incorporated enterprises, which write 82.5% of premiums in Spain, 94.7% in Belgium, and up to 97.4% in France. The average volume of premiums per composite enterprise is also higher in incorporated enterprises than in mutuals, reaching an average of ECU 447 Mio in the Euro-zone against ECU 187 Mio for mutuals and ECU 67 Mio for branches of non-EEA enterprises. In France, premiums per composite insurer reach summits, with ECU 1 356 Mio average turnover.
Specialist reinsurance enterprises
In EU-15 Member States, incorporated enterprises limited by shares account for 97.6% of total premiums by specialist reinsurers with an average of 117 Mio ECU premiums written per enterprises against 20 Mio for mutuals.
■ ν■-;'.. ■ι.γ.:;: ■■■ .■■:.■::■:■:::■:::.:::■■: :: :·:-. :: :.-.:. :.■■■;■
Paneuropean Trends
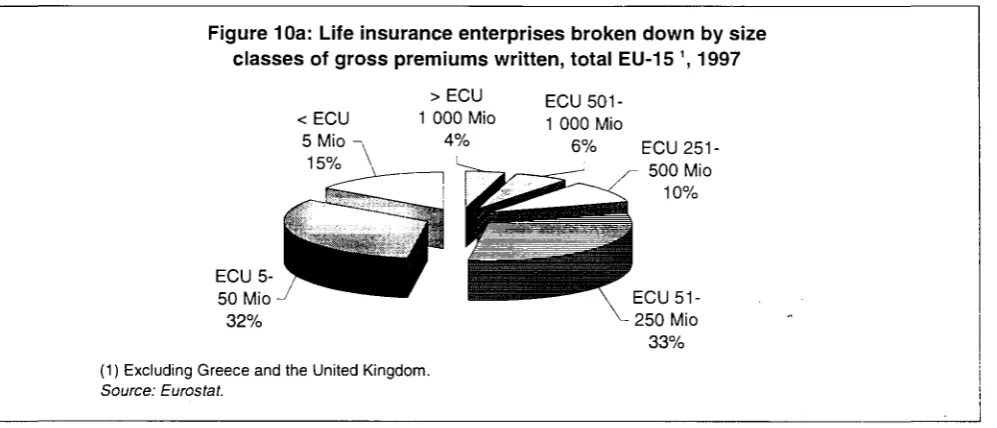
4.4.
The average size of insurance enterprises
Life insurance enterprises
In EU-15 Member States, where the breakdown of life insurance enterprises by size classes of gross premiums written is not available for Greece and the United Kingdom, 47.8% of enterprises have a business inferior to ECU 50 Mio, while 4.3% realise more than ECU 1 000 Mio turnover.
Almost 80% of life insurance enterprises in the Euro-zone have a turnover inferior to ECU 250 Mio and less than 5% have a turnover superior to ECU 1 Mrd.
Figure 10a: Life insurance enterprises classes of gross premiums written,
>ECU < ECU 1 000 Mio
5 Mio -, 4% 15% \ _ _ _ _ ^ L ^
c^^i
Æ*&E C U 5 . ^ ^ B f ~
Γ"
50 Mio -J ^ ^ ^ ^ ^ " --=-32%
(1) Excluding Greece and the United Kingdom.
Source: Eurostat.
broken down by size total EU151, 1997
ECU 501-1 000 Mio
6% ECU 251- 500 Mio
10%
ECU 51 250 Mio 33%
Looking at individual countries, the share of enterprises with a turnover under ECU 250 Mio is above 90% in some of them: Belgium, Denmark, Ireland and Finland. Countries having a greater concentration of larger enterprises (over ECU 251 Mio) are Germany with 40.7%, France with 30.2%, Austria with 50%, and Sweden with 33.3%. Switzerland has share of 48.4%. The largest population of enterprises with turnover above ECU 1 Mrd are in Germany (9.8%), France (12.1%) and Austria (16.7%).
[image:37.595.60.559.225.439.2]Paneuropean Trends
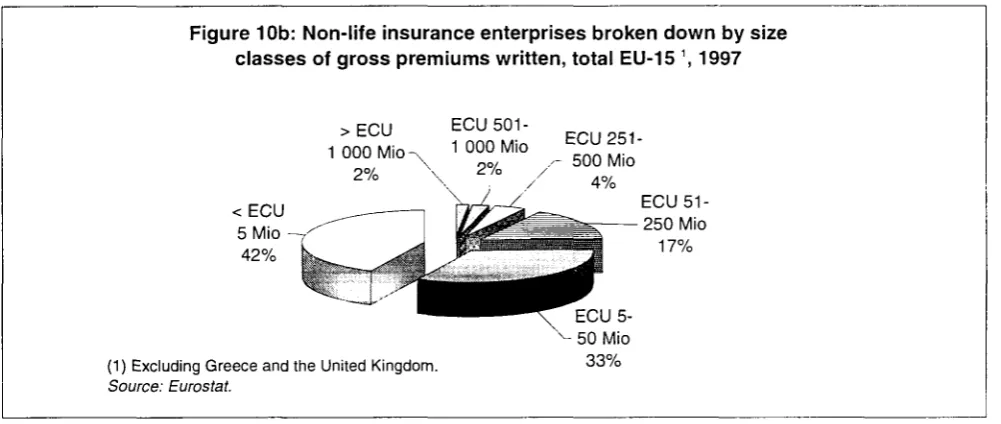
[image:38.595.47.548.97.309.2]Non-life insurance enterprises
Figure 10b: Nonlife insurance enterprises broken down by size classes of gross premiums written, total EU15 \ 1997
>ECU 1 000 Mio
2%
ECU
501-1 000 Mio ECU 251 500 Mio
4%
ECU 51 250 Mio
17%
(1) Excluding Greece and the United Kingdom.
Source: Eurostat.
ECU 5-50 Mio 33%
As for life insurance, most non-life enterprises are in the size classes under ECU 250 Mio: 92.1% of EU-15 enterprises and 91.5% of all Euro-zone enterprises. The concentration of smaller enterprises is however greater than that of life enterprises: 4 1 % of all Euro-zone non-life enterprises have turnover under ECU 5 Mio. This is again mainly due to the counting of numerous smaller mutuals in some countries. Most insurance enterprises whose turnover is higher than ECU 1 Mrd are found in Germany, France, and Austria but their share in number does not reach much more than 5%.
Composite insurance enterprises
Figure 10c: Composite insurance enterprises broken down by size classes of gross premiums written, total EU15 1, 1997
<ECU 5 MÌO η
6% ECU 5 ^ ^ ¡r>—ι
50 Mio -r--' ' O a J
27% L ■iiiiifflMf"1 ] ^^^1=^— ^^Ê
(1) Excluding Greece and the United Kingdom.
Source: Eurostat.
> E C U 1 000 Mio
10% ι,.-.-.- ^^^gi — ' JBBifctew
jäiiaaBKwsii&v&jSO
-i ■■ 3P
ECU 5 1-^- 250 Mio 27%
ECU 5 0 1
-r 1 000 Mio 10%
,é
■HS ECU 2 5 1 -WK 500 Mio
20%
Composite insurance enterprises show a greater average premium volume; with almost 40% of the Euro-zone enterprises having a turnover over ECU 250 Mio and only 6.1% being below the ECU 5 Mio turnover threshold. France and Italy register the largest enterprises with both 8 entities out of 22 (or 36.4%) being in the largest size class.
Following the process of concentration of insurance enterprises, when studying time series on the number of enterprises according to the size of turnover, a shift towards a greater number of enterprises in the larger size classes of turnover might be expected in the future. This would be explained by the tendency of enterprises to grow larger to better face competition. However, this effect is likely to be counterbalanced by the general decline in the total number of enterprises.
[image:38.595.49.547.423.638.2]Paneuropean Trends
Table 8: Number of insurance enterprises according to the size class of gross premiums written, 1997
Total 1996 Total 1997 >ECU 1 000 Mio ECU 501-1 000 Mio
ECU 251-500 Mio ECU 51-250 Mio ECU 5-50 Mio <ECU 5 Mio EU-151 EUR-11 Β DK D EL2 E F IRL I L NL A Ρ FIN S UK IS Ν EEA1 CH
952 947
Life insurance enterprises
32 46 72 632 28 86 125 27 58 132 28 76 51 96 6 18 14 30 177 3 9 964 32 627 26 86 123 27 55 116 32 78 52 107 6 18 14 30 177 3 16 966 31 31 0 0 12 0 14 0 1 0 3 1 0 0 1 32 2 42 1 1 15 2 12 1 6 0 4 1 0 0 3 46 6 62 0 4 23 5 9 1 5 6 9 1 2 1 6 72 7 238 205 5 24 33 24 36 15 28 17 32 2 3 10 9 238 4 241 196 14 37 30 20 32 9 28 16 34 1 12 0 8 241 7 114 91 6 20 10 4 13 6 10 13 25 0 1 3 3 117 5
EU-15 2 673 2 624
Non-life insurance enterprises
32 44 76 319 627 818
EUR-11 Β DK D EL2 E F IRL L NL A Ρ FIN S UK IS Ν EEA1 CH
1 722 93 159 334 109 240 343 73 127 23 294 20 27 148 105 578 12 107
2 792 93
(1) For available data only. (2) 1996 data.
Source: Eurostat.
1 667 87 141 331 109 230 312 69 115 23 307 18 26 149 108 599 10 110
2 744 97 32 0 0 18 0 12 0 1 0 0 1 0 0 0 0 32 3 39 1 1 22 1 11 0 1 0 3 0 0 0 4 0 44 3 71 2 3 32 3 13 1 5 0 11 0 1 3 2 0 76 5 297 14 13 72 19 63 10 35 4 59 10 6 5 9 2 321 11 544 37 31 115 103 109 25 41 9 74 7 13 11 52 3 630 37 684 33 93 72 104 104 33 32 10 160 0 6 130 41 5 823 38
Paneuropean Trends
Table 8: Number of insurance enterprises according to the size class of gross premiums written, 1997 (Continued)
Total 1996
Total 1997
>ECU
1 000
Mio
ECU
501-1 000 Mio
ECU
251-500 Mio
ECU 51-250 Mio
ECU
5-50 Mio
<ECU 5 Mio
EU-151 261 278
Composite insurance enterprises
20 19 39 54 53 12
EUR-11 Β E L2 E F I L A Ρ UK
186 43 16 67 10 22 0 36 8 59
(1 ) For available data only. (2) 1996 data.
Source: Eurostat.
197 45 16 66 22 21 0 35 8 65
20 3
0 8 8 0 1 0
19 2
5 3 3 0 4 2
39 6
14 5 4 0 9 1
54 16
23 3 5 0 4 3
53 15
22 3 1 0 10 2
12 3
2 0 0 0 7 0
Paneuropean Trends
4.5. Structure of the insurance premiums
Figure 11: Breakdown of EU-15 gross premiums written (in %), 1997
30.0
25.0
-20.0
15.0
10.0
5.0
0.0
25.4 24.8
21.0
7.7
5·1 4.1
Π π
2 4 2.1 2.0 υΠ Π Π Π
11 1 0 0.7 0.7 0.3D UK NL DK L IRL FIN EL
Source: Eurostat.
4.5.1. The dominating markets
As far as volume of business by life insurance enterprises is concerned, dominating markets are the United Kingdom (ECU 91 441 Mio), France (ECU 56 515 Mio), Germany (ECU 50 298). They respectively represent 34.9%, 21.6% and 19.2% of EU-15 life insurance enterprises business.
As far as volume of business by non-life insurance enterprises is concerned, main markets are Germany (ECU 72 707 Mio), France (ECU 41 504 Mio), and the United Kingdom (ECU 29 104 Mio). They correspondingly stand for 37.6%, 21.5% and 15% of the business of all EU-15 non-life insurance enterprises. In France and the United Kingdom an important amount of non-life business is written by composite insurance enterprises.
The most important market considering the premiums volume of specialist reinsurance enterprises is Germany (ECU 31 572 Mio), followed by France almost ten times smaller (ECU 3 482) and Luxembourg (ECU 2 455 Mio). In Switzerland, premiums volume of specialist reinsurance enterprises reaches ECU 7 001 Mio.
Paneuropean Trends
Table 9: Gross premiums written of insurance enterprises, 1997 (Mio ECU)
E U - 1 51
EUR-11 Β DK D E L2 E F IRL I L NL A Ρ FIN S UK IS Ν E E A1 CH
Total insurance enterprises
609 606
1 433 886 14 544 10 232 154 578 1 640 25 037 127 957 6 287 47 035 6 847 30 869 1 2 1 2 43
4 499 4 109 12 561 151 288
192 6 309
6 1 6 1 0 7
46 468
(1 ) For available data only. (2) 1996 data.
%of EU-15 total 100.0 71.2 2.4 1.7 25.4 0.3 4.1 21.0 1.0 7.7 1.1 5.1 2.0 0.7 0.7 2.1 24.8
(3) Estimate, including 1996 data.
Source: Eurostat.
Life Insurance enterprises
261 971
156 825 1 690 5 827 50 298 791 7 173 56 515 3 659 12 362 3 735 17 267 924 2 1 265 1 937 7 088 91 441 7 3 147 2 6 5 1 2 6
22 955
%of EU-15 total 100.0 59.9 0.6 2.2 19.2 0.3 2.7 21.6 1.4 4.7 1.4 6.6 0.4 0.5 0.7 2.7 34.9 : Non-life insurance enterprises
193 431
154 238 3 469 3 786 72 707 849 5 313 41 504 2 629 9 632 656 13 602 1 296 1 262 2 168 5 454 29 104 171 3 162 196 765
1 6 5 1 3
%of EU-15 total 100.0 79.7 1.8 2.0 37.6 0.4 2.7 21.5 1.4 5.0 0.3 7.0 0.7 0.7 1.1 2.8 15.0 : Composite insurance enterprises
112 614
81 872 9 385 -0 12 022 26 457 -23 306
0 -8 7 3 73 1 965
-30 742
-112 614
-%of EU-15 total 100.0 72.7 8.3 -0.0 10.7 23.5 -20.7 0.0 -7.8 1.7 -27.3 :■■'■' . Specialist reinsurance enterprises
41 588
40 784
619 31 572 0 529 3 482 1 735 2 455
1 167 7 4 18
13
41 601
7 001