Management Working Papers
School of Management
Revisiting the ‘paperless office’: A case of values, power and
(in)action
Ian Harwood
Number M-06-03
Revisiting the ‘paperless office’: A case of values, power and (in)action
Ian A. Harwood
School of Management, University of Southampton, Highfield, Southampton, SO17 1BJ. Email: [email protected], Tel. 0044 (0)2380 597789, Fax. 0044 (0)2380 593844
Abstract
The advent of the ‘digital revolution’ in the 1970s was forecast to make paper all but redundant. Recent figures suggest though that paper consumption continues to increase unabatedly, with a correspondingly adverse environmental impact. This research uses a single exploratory case study in the School of Management, University of Southampton to explore the environmental impact of current A4 paper usage, followed by recommendations for reducing consumption. Whilst some changes have occurred to make more documents available electronically, the research finds that ‘the paperless office’ within the School remains a fictional concept.
Keywords
Paperless office, Corporate Environmental Responsibility, environmental impacts
Introduction
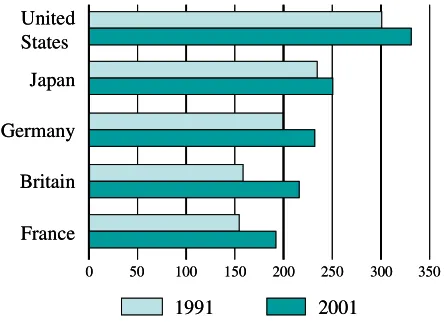
Just over thirty years ago, an article in Business Week suggested that the digital age would bring about the ‘paperless office’ (Anon., 1975). By contrast, actual paper usage between 1988 and 1998 in Britain alone rose by 65% per head (Anon., 1998). Figure 1 shows increasing consumption across the developed world.
Figure 1 about here.
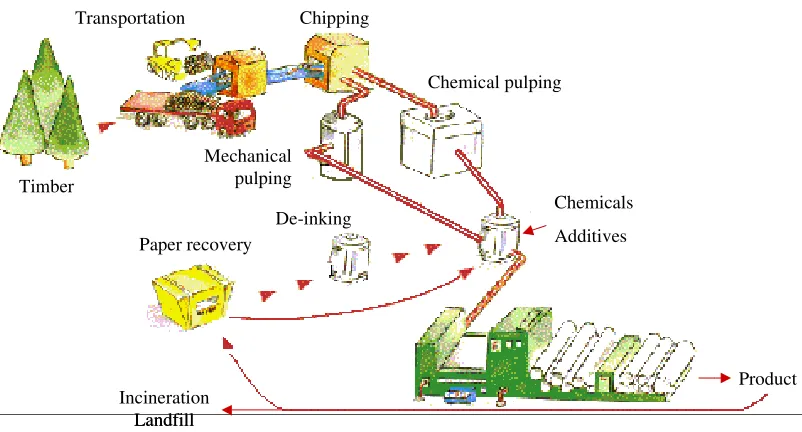
Sellen and Harper (2001) also highlight that e-mail has actually increased paper usage by some 40% in offices. The environmental impact of the paper lifecycle (see Figure 2) is significant, ranging from land usage for forests (managed or otherwise), impacts to ecosystems on ‘harvesting’, energy consumption and chemical usage during processing (including recycled stock) and the printing process. Finally, the paper is used and potentially stored before eventual disposal via recycling, incineration or landfill. Robinson (2006, p.1) states that “[UK] businesses throw away about five million tonnes of printing and writing paper every year”. The paperless office appears then to remain a myth (Sellen and Harper, 2001).
Figure 2 about here.
The underlying assumption for this research is that A4 paper usage (especially from virgin pulp) has a negative environmental impact and that reducing consumption would be a responsible action for an organisation to take. On this basis, the project revisits the concept of the ‘paperless office’ (Anon., 1975) and investigates A4 paper usage within the School of Management (SoM) at the University of Southampton (http://www.management.soton.ac.uk/). Over recent years, a number of changes have been implemented in the SoM in order to move many resources over to electronic systems (most notably the 'Blackboard' Virtual Learning Environment but also an intranet and documents such as minutes of meetings being placed on a shared drive). However, paper still appears to feature in many of the School's activities which has led to the following research questions:
• What is the annual consumption of A4 paper within the SoM?
• What would be the environmental impact of reducing the consumption of paper and changing the pulp content?
• How could this change be implemented within the SoM?
This research looks at the instrumental values placed on paper (over and above alternatives), the various sources (and contests) of power amongst different stakeholders that maintains the current inertia, and possible actions required to reduce the environmental impact.
Methodology
The above questions have been addressed through a single exploratory case study (Yin, 2003). Existing A4 usage data for the latest available full academic year (Oct 2004 to Sep 2005) have been calculated by combining historical copy ‘chits’ to the central printroom together with purchase orders for A4 paper reams within the SoM. The environmental impacts of this usage and a plausible change scenario are then estimated using a web-based calculator.
Insights into the existing demand for A4 paper were collected through participant observations and discussions with staff and students within the School. Through Force Field Analysis (Lewin, 1951), a combination of this primary data and extant literature is then used to identify some driving and restraining forces (values and power) that maintain the current demand for paper within the SoM, as well as identifying various ‘levers’ to bring about the change scenario.
Analysis
Table 1 about here.
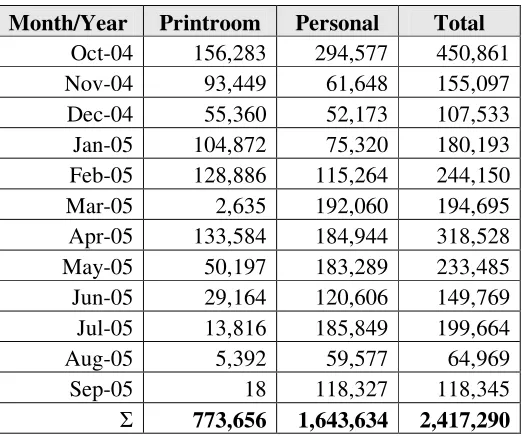
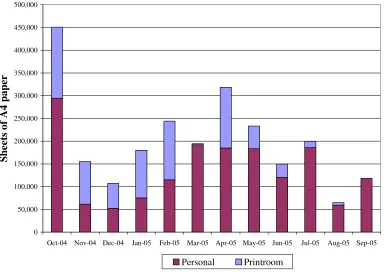
This usage equates to an average of 201,441 sheets per month, with 68% of the volume arising from personal usage and the remaining 32% from the printroom. Representing this data graphically (see Figure 3), we can see that the highest demand is in October which relates to the start of the new academic year and August being the lowest usage due to the holiday period.
Figure 3 about here.
Calculating the environmental impact of this consumption is not straightforward, not least because it has not been possible to ascertain factors such as the sources of energy used in the paper mill. However, an estimated environmental impact has been established based on a web-based calculator using peer-reviewed data of average paper usage in America (see
http://www.environmentaldefense.org/).
The first stage to estimating the environmental impact is to convert the annual usage from sheets of paper into weight. Firstly, the A4 paper in question is specified as 80 grams per square metre and with 16 sheets of A4 paper per square metre, each sheet of A4 weighs 80/16 = 5 grams. Multiplying the weight per sheet by the annual usage of 2,417,290 sheets gives an annual weight of 12,086,450 grams, or 12.09 tonnes.
The current supply of paper (see http://www.image-paper.com/product_universal.html) does not appear to contain any recycled pulp, and is therefore 100% virgin pulp (which is not even sourced from a Forest Stewardship Council (FSC) organisation). Armed with these two pieces of data, the environmental impact can be estimated as shown in Table 2, with some ‘headline’ variables shown in bold.
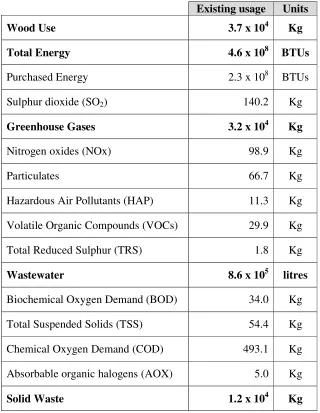
Table 2 about here.
and having established the environmental impact of the current annual usage of A4 paper within the SoM, the following section will explore a potential abatement strategy (Annand, 2003). There are many potential scenarios available, but the scope of this paper allows for only one as an example: i.e. change to a recycled pulp source using 100% recycled office paper (de-inked kraft) and reduce consumption to a plausible 75% of current usage in the first instance. The annual weight of paper would therefore be reduced to 12.09 x 0.75 = 9.07 tonnes, with the following estimated environmental impact (see Table 3).
Table 3 about here.
We can see from Table 3 that the proposed change would annually reduce the use of wood by 37 tonnes, energy by 2.7 x 10⁸ BTUs, greenhouse gases by 16 tonnes, waste water by 5.1 x 10⁵ litres and solid waste by 7.3 tonnes (together with the other reductions shown). Along with these environmental savings, a reduction in consumption may also result in some economic savings. One problem here though is that prices for A4 paper reams are constantly adjusted through promotions or volume discounts, making direct comparisons difficult. As an example, a ream of A4 80gsm 100% post consumer recycled paper costs £1.99 without a volume discount (http://purelypaper.co.uk/), compared with the current SoM supply at £1.42 per ream. It may be possible, through negotiations with the current supplier, that a switch to recycled stock paper could be achieved with little or no price differential. Based on this assumption, a 25% reduction in printroom activities and ‘personal’ A4 paper usage in the SoM (during 2004/5) could equate to £7,842 in potential savings.
Discussion
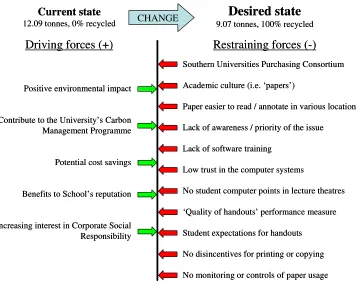
The above analysis has shown how a relatively straightforward change could yield some improvements to the environmental and economic impact of paper use in the SoM. It is important though to assess the various values and sources of power (i.e. forces) that maintain the current demand for paper, thereby resisting any actions for change. Key insights gained from participant observations and discussions within the School have been divided into driving and restraining forces in order to conduct a force field analysis of the current ‘quasi-stationary equilibrium’ (Lewin, 1951).
Figure 4 about here.
In order to bring about the change to the desired state (i.e. 25% reduction in usage and use 100% recycled stock), the current situation has to be ‘unfrozen’ (Lewin, 1951) thereby shifting the balance of forces. To do this, Rosenfeld and Wilson (1999) suggest that the restraining forces have to be attended to first and selectively removed.
The change to 100% recycled stock paper appears to be a straightforward sourcing and procurement decision. However, this may be complicated by the University belonging to the Southern Universities Procurement Consortium (SUPC) who have the power resources (Hinchliffe and Belshaw, 2003) to make collective procurement decisions and contracts for universities in the south of England. In order to remove this restraining force and action such a change, the SUPC would first need to be lobbied with the facts and environmental benefits presented in this research. The University of Southampton is currently involved in a carbon management programme (CMP) in order to reduce its overall carbon footprint across all activities (see http://www.carbontrust.co.uk/about/presscentre/060503_universities.htm). The procurement group are represented on the CMP taskforce which should ease the lobbying activities.
of trust in computer systems being able to reliably store documentation. Students also have a ‘use value’ (Burgess, 2003, p.261) in having hardcopy lecture handouts distributed at the start of a lecture. The end of unit student assessment questionnaire also asks students to rate the ‘quality of handouts’, thereby reinforcing the instrumental value in providing paper copies for staff and students alike.
To reduce these restraining forces, an education and awareness campaign is required amongst both staff and students. For instance, research that finds that reading from a computer screen can be equivalent in speed and comprehension to reading from a book (e.g. Muter and Maurutto, 1991) should be disseminated (by electronic means). Currently, many copies are scrapped or inefficiently printed due to a lack of awareness of printing options in software packages (such as setting duplex to the default setting or printing more than one page on each side) which could be improved through training. The creative process of research and writing academic articles appears to create numerous printouts of draft copies which is potentially a behavioural activity that could be addressed through an awareness campaign. At the very least, the environmental impact of paper usage should be (electronically) published within the School and any documents available online should not be duplicated in hardcopy (except in perhaps exceptional circumstances).
Summary and conclusions
This paper has explored aspects of A4 paper use within a single exploratory case study (Yin, 2003) in the School of Management, University of Southampton. Using data from the 2004/5 academic year, 68% of the consumption (1,643,634 sheets) arose from personal usage and the remaining 32% (773,656 sheets)from the printroom. This combines to give an annual total of 2,417,290 sheets, or 12.09 tonnes of virgin pulp (non-FSC sourced) paper. In terms of ‘headline’ environmental impact, this usage consumes 3.7 x 10⁴ Kg of wood and 4.6 x 10⁸ BTUs of energy whilst producing 3.2 x 10⁴ Kg of greenhouse gases, 8.6 x 10⁵ litres of wastewater and 1.2 x 10⁴ Kg of solid waste.
The research has considered one plausible change scenario to reduce consumption to 75% of current demand in the first instance and switch to a 100% recycled stock paper. By doing so, the proposed change would indicatively reduce the annual use of wood by 37 tonnes, energy by 2.7 x 10⁸ BTUs, greenhouse gases by 16 tonnes, waste water by 5.1 x 10⁵ litres and solid waste by 7.3 tonnes. Annual cost savings of £7,842 may also be possible.
Force field analysis (Lewin, 1951) has been used to identify some driving and restraining forces (i.e. values and power) behind the proposed changes (i.e. actions), which are discussed in detail above. The main thrust of changing values and power sources comes from an education and awareness campaign within the School, supplemented by the subsequent potential for monitoring and controlling paper usage.
References
Annand, P. (2003) Economic analysis and environmental responses, Chapter 3 in Blowers, A. and Hinchliffe, S. (eds.) (2003). Environmental Responses, John Wiley & Sons Ltd./The Open University: Chichester.
Anonymous (1975). The Office of the Future, Business Week, No. 2397, 30th June 1975, pp.48-70.
Anonymous (1998). Replacing paper, The Economist, 17th December 1998, [Online], Available: http://www.economist.com/surveys/displaystory.cfm?story_id=E1_TSJJPG, Accessed 23rd February 2006.
Anonymous (2002). In praise of clutter, The Economist, 19th December 2002, [Online], Available: http://www.economist.com/business/displayStory.cfm?story_id=1489224, Accessed 23rd February 2006.
Burgess, J. (2003) Environmental values in environmental decision making, Chapter 7 in Bingham, N.; Blowers, A. and Belshaw, C. (eds.) (2003). Contested Environments, John Wiley & Sons Ltd./The Open University: Chichester.
Candy, J. (2006). Presentation on procurement during a Carbon Management Programme workshop, University of Southampton, 22nd February 2006.
Fischer, C. (2004). Research and Writing a Dissertation for Business Students, Pearson Education Ltd., Harlow.
Hinchliffe, S. and Belshaw, C. (2003) Who cares? Values, power and action in environmental contests, Chapter 3 in Hinchliffe, S.; Blowers, A. and Freeland, J. (eds.) (2003).
Understanding Environmental Issues, John Wiley & Sons Ltd./The Open University: Chichester.
Muter, P., & Maurutto, P.(1991). Reading and skimming from computer screens and books: The paperless office revisited? Behaviour & Information Technology, Vol. 10, No.4, pp.257-266, [Online], Available: http://www.psych.utoronto.ca/~muter/pmuter2.htm , Accessed 13th August 2006.
Robinson, C. (2006). Modern Life is Rubbish, Mid Hampshire Observer, Issue 261, 22nd February 2006.
Rosenfeld, R.H. and Wilson, D.C. (1999). Managing Organizations: Text, Readings & Cases, McGraw Hill : Maidenhead.
Sellen, A.J. and Harper, R.H.R. (2001) The Myth of the Paperless Office, MIT Press.
Yin, R.K. (2003). Case Study Research: Design and Methods, 3rd edition, Sage Publications
Figure 1: Paper consumption per head, Kg year-1
Source: Paper Federation of Great Britain via Anon. (2002)
0 50 100 150 200 250 300 350
United States
Japan
Germany
Britain
France
1991 2001
0 50 100 150 200 250 300 350
United States
Japan
Germany
Britain
France
Figure 2: The paper lifecycle
Source: adapted from http://www.paperonline.org/cycle/paperboard/paperboard_frame.html
Incineration Landfill
Chipping
Chemical pulping
Mechanical pulping Transportation
Timber
De-inking Paper recovery
Chemicals Additives
Product Incineration
Landfill
Chipping
Chemical pulping
Mechanical pulping Transportation
Timber
De-inking Paper recovery
Chemicals Additives
Table 1: Volume data for A4 paper usage (sheets) in the SoM for the 2004/5 academic year.
Month/Year Printroom Personal Total
Oct-04 156,283 294,577 450,861 Nov-04 93,449 61,648 155,097 Dec-04 55,360 52,173 107,533 Jan-05 104,872 75,320 180,193 Feb-05 128,886 115,264 244,150 Mar-05 2,635 192,060 194,695 Apr-05 133,584 184,944 318,528 May-05 50,197 183,289 233,485 Jun-05 29,164 120,606 149,769 Jul-05 13,816 185,849 199,664
Aug-05 5,392 59,577 64,969
Sep-05 18 118,327 118,345
Figure 3: Frequency distribution of A4 paper usage in the SoM (2004/5)
0 50,000 100,000 150,000 200,000 250,000 300,000 350,000 400,000 450,000 500,000
Oct-04 Nov-04 Dec-04 Jan-05 Feb-05 Mar-05 Apr-05 May-05 Jun-05 Jul-05 Aug-05 Sep-05
Sh
ee
ts
o
f A
4
pa
pe
r
Table 2: Estimated environmental impact of 12.09 tonnes of 0% recycled content paper
Existing usage Units
Wood Use 3.7 x 10⁴ Kg
Total Energy 4.6 x 10⁸ BTUs
Purchased Energy 2.3 x 10⁸ BTUs
Sulphur dioxide (SO2) 140.2 Kg
Greenhouse Gases 3.2 x 10⁴ Kg
Nitrogen oxides (NOx) 98.9 Kg
Particulates 66.7 Kg
Hazardous Air Pollutants (HAP) 11.3 Kg
Volatile Organic Compounds (VOCs) 29.9 Kg
Total Reduced Sulphur (TRS) 1.8 Kg
Wastewater 8.6 x 10⁵ litres
Biochemical Oxygen Demand (BOD) 34.0 Kg
Total Suspended Solids (TSS) 54.4 Kg
Chemical Oxygen Demand (COD) 493.1 Kg
Absorbable organic halogens (AOX) 5.0 Kg
Solid Waste 1.2 x 10⁴ Kg
Table 3: Estimate of the annual impact of using 100% recycled stock paper and changing to 75% of current usage (i.e. 9.07 tonnes).
Environ. impact of existing
usage
Environ. impact of change scenario
Annual
reductions Units
Wood Use 3.7 x 10⁴ 0.0 -3.7 x 10⁴ Kg
Total Energy 4.6 x 10⁸ 1.9 x 10⁸ -2.7 x 10⁸ BTUs
Purchased Energy 2.3 x 10⁸ 1.9 x 10⁸ -4.0 x 10⁷ BTUs
Sulphur dioxide (SO2) 140.2 103.0 -37.2 Kg
Greenhouse Gases 3.2 x 10⁴ 1.4 x 10⁴ -1.6 x 10⁴ Kg
Nitrogen oxides (NOx) 98.9 58.1 -40.8 Kg
Particulates 66.7 29.5 -37.2 Kg
Hazardous Air Pollutants (HAP) 11.3 0.5 -10.8 Kg
Volatile Organic Compounds (VOCs) 29.9 7.3 -22.6 Kg
Total Reduced Sulphur (TRS) 1.8 0.0 -1.8 Kg
Wastewater 8.6 x 10⁵ 3.5 x 10⁵ -5.1 x 10⁵ litres
Biochemical Oxygen Demand (BOD) 34.0 24.5 -9.5 Kg
Total Suspended Solids (TSS) 54.4 27.7 -26.7 Kg
Chemical Oxygen Demand (COD) 493.1 111.1 -382.0 Kg
Absorbable organic halogens (AOX) 5.0 0.0 -5.0 Kg
Solid Waste 1.2 x 10⁴ 4.7 x 10³ -7.3 x 10³ Kg
Figure 4: Force Field Analysis of paper usage in the SoM
Driving forces (+)
Restraining forces (-)
Current state
12.09 tonnes, 0% recycled 9.07 tonnes, 100% recycled
Desired state
Positive environmental impact
Contribute to the University’s Carbon Management Programme
Potential cost savings
Benefits to School’s reputation
Increasing interest in Corporate Social Responsibility
Southern Universities Purchasing Consortium Academic culture (i.e. ‘papers’)
Paper easier to read / annotate in various locations Lack of awareness / priority of the issue
Lack of software training Low trust in the computer systems
No student computer points in lecture theatres ‘Quality of handouts’ performance measure Student expectations for handouts
No disincentives for printing or copying No monitoring or controls of paper usage
CHANGE
‘Quasi-stationary equilibrium’
Driving forces (+)
Restraining forces (-)
Current state
12.09 tonnes, 0% recycled 9.07 tonnes, 100% recycled
Desired state
Positive environmental impact
Contribute to the University’s Carbon Management Programme
Potential cost savings
Benefits to School’s reputation
Increasing interest in Corporate Social Responsibility
Southern Universities Purchasing Consortium Academic culture (i.e. ‘papers’)
Paper easier to read / annotate in various locations Lack of awareness / priority of the issue
Lack of software training Low trust in the computer systems
No student computer points in lecture theatres ‘Quality of handouts’ performance measure Student expectations for handouts
No disincentives for printing or copying No monitoring or controls of paper usage
CHANGE