1
A study of Non-Contact Knife
Sharpness Analysis.
A thesis presented in partial fulfilment of the
requirements for the degree of
Master of Engineering
In
Product Development Engineering
At Massey University, Albany, New Zealand.
Stefan van Woerden
B.E. (Hons)
2
T
ABLE OF
C
ONTENTS
Table of Figures ... 4
1 Introduction ... 5
1.1 Background and Motivation ... 5
1.2 Research Objectives ... 6
1.3 Main Contributions ... 7
1.4 Thesis Organization ... 8
2 Review of Current Knife Sharpness Testing Technologies ... 9
2.1 Definition of Sharpness ... 9
2.2 Factors affecting Performance of Knives ... 10
2.3 Patent research ... 15
3 Vision System for Knife Edge Imaging ... 18
3.1 Edge Imaging – how it works ... 18
3.2 Single image, proof of concept ... 19
3.2.1 Research questions ... 19
3.2.2 Aim... 19
3.2.3 Method ... 19
3.3 Continuous Knife Edge Imaging ... 20
4 Capacitance probe measurement system ... 22
4.1 Research questions ... 22
4.2 Aim ... 22
4.3 Equipment ... 22
4.4 Method ... 22
5 Laser reflection and light intensity test ... 24
5.1 Research questions ... 24
5.2 Aim ... 24
5.3 Method ... 24
6 Results and discussions ... 27
6.1 Vision detection edge analysis results ... 27
6.2 Laser light reflection results... 29
7 Conclusions ... 35
7.1 Vision detection edge analysis conclusions ... 35
3
7.3 Capacitive measuring experiment conclusions ... 36
7.4 Acknowledgements ... 38
8 Appendix ... 39
8.1 Appendix 1: Sketches of testing setup concepts ... 39
8.2 Matlab code – Laser light reflection creating the plots ... 42
8.3 Microscope edge detection code ... 43
8.4 KST comparison test data of knives ... 49
4
T
ABLE OF
F
IGURES
Figure 1: Illustration of BSI calculation. McCarthy (2010) ... 9
Figure 2: Blades used in McCarthy (2007) experiments. ... 10
Figure 3: McGorry (2005), grip force knife handle, (a) boning knife, (b) skinning blade. ... 11
Figure 4: Grip force sensor knife handle (A & B), McGorry (2003). ... 12
Figure 5: CATRA knife sharpness tester ... 14
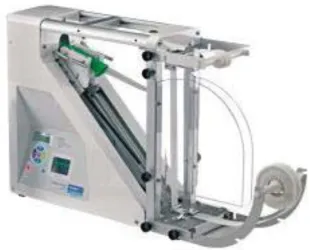
Figure 6: Anago KST machine. ... 15
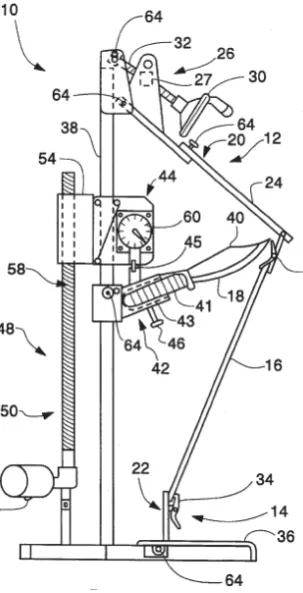
Figure 7: US5571956 (1996) knife sharpness testing machine, 60 – load cell, 16 – test material, 50 – drive motor, 30 – material tensioner. ... 16
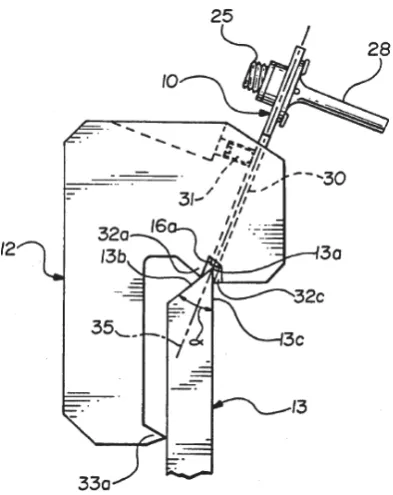
Figure 8: US5196800 (1993) Capacitance sensor probe, 13 - knife blade, 16 – capacitance probe point, 25 – probe body, 12 – sensor mount, 33a - knife guide. ... 17
Figure 9: The knives used in the testing. Top to bottom, orange knife, box cutter razor, 900 grit, 600 grit, and 400 grit. ... 18
Figure 10: Edge detection test rig with the controller. 1, the USB microscope, 2, the test rig frame, 3, the knife, 4, stepper motor to move the knife, 5, the stepper motor controller and 6, the Arduino controller. ... 20
Figure 11: Edge detection in operation. 1 USB microscope, 2 test rig frame, 3 knife, 4 stepper motor, 5 lead screw. ... 21
Figure 12: First concept of Capacitance probe test rig. 1 – Roller guides, 2 – Capacitance probe sensor, 3 – test rig frame. ... 23
Figure 13: 5mW laser module ... 24
Figure 14: Laser in test rig top view. ... 25
Figure 15: Test rig for laser reflection experiment. (Top) ... 25
Figure 16: Test rig for laser reflection experiment. (Side) ... 26
Figure 17: 900 grit – 11.2 is the standard deviation of the distribution of the data points. Top left: direct input from the edge detection. Top right: Is the direct input without the lines between the points removed. Bottom Left: graph shows the distribution around the mean position. Bottom right: is the normalised distribution points around the mean. ... 27
Figure 18: 400 grit – 32.6 is the standard deviation of the distribution of the data points. The four graphs are the same graphs as figure 17, but with the 900 grit honed knife. ... 28
Figure 19:Standard deviation of the sum of the columns of pixels in the edge image, ... 29
Figure 20: sum of the brightness of all the pixels in the image. ... 30
Figure 21: Normal distribution of pixel values of the columns summed. ... 30
Figure 22: Standard deviation of the brightness of laser, grouped by knife type ... 31
Figure 23: Standard deviation of the brightness of laser, grouped by laser angle ... 32
Figure 24: Total sum of the brightness of the reflected laser light. ... 33
Figure 25: Laser light reflecting concept. ... 41
Figure 26: razor edge ... 49
Figure 27: orange handle... 49
Figure 28: green 900 ... 49
Figure 29: green 400 grit ... 49
5
1
I
NTRODUCTION
1.1
BACKGROUND AND MOTIVATION
In meat process industries, the primary operations involved in extracting meat from an animal carcass are manual. They require the use of hand held knives. This reliance on human operators means that accidents are common-place and it contributes to increased medical costs for the employer. In an attempt to reduce these costs, McGorry, Dowd and Dempsy (2003) investigated knife sharpness and the forces required in cutting operations which are factors that must be continually improved. Marsot, Claudon and Jacqmin (2007) also looked at the effect that knife sharpness has on cutting force to prevent musculoskeletal disorders (MSD) in meat process workers. These researchers put forward an effective argument towards the use of properly sharpened knives to reduce stress on butchers and therefore reduce injuries to employees in the meat processing industry.
Currently, the most common knife sharpness testing machines measure the cutting force as the knife cuts a test material. This process uses the knife after it has been sharpened and the cutting edge is blunted a little. In some situations, the knife needs to be sterilised a second time before it can be used in the plant. Also the test material type and consistency controls the detail of the knife edge analysis. The test material must be very consistent to ensure that knife sharpness results from the tests can be compared and contrasted and able to be improved on. The test material must be a grid as to reduce tear propagation through the material, therefore the maximum density of strands the knife cuts through is 1 strand per millimetre of blade. Improving the density of the measurement points to a requirement of the new technologies.
6
1.2
R
ESEARCHO
BJECTIVESThis project aims to study the feasibility of several potential techniques that could be used for a new contactless knife sharpness testing method. It is supported by Company X which is a Hamilton based business that provides solutions to optimise knife sharpness. Their current products include the Knife Sharpness Tester (KST) and the KST software package. The literature review and study of current patents of technologies used in knife sharpness testing the following research questions were developed:
- Can the use of edge detection vision systems find nicks or burs in an image of the edge of a knife?
- Does measuring the capacitance between a sensor probe and a blade edge determine the surface area of the edge?
- Will measuring the intensity of reflected laser light focused on the edge of the knife determine the radius of the edge of the knife?
The three technologies researched in the literature review are listed below. Having three methods is to provide not just one solution for Company X but multiple solutions for Company X to continue to develop and turn into a fully working product.
1. Capacitance probe sensor system.
a. The measured capacitance is directly proportional to the blade edge surface area.
b. The measured surface area of the edge is proportional to the blade edge tip radius.
2. Laser reflection and light intensity sensor.
a. Using a 635nm red laser the reflected light of the tip is able be correlated to the blade geometry.
b. Light intensity of the reflected light is proportional to the surface area of the blade tip.
3. Camera vision system with edge detection.
a. A camera microscope will be able to provide a detailed image to see microscopic defects in the blade edge.
b. Open CV image processing software will be able to analyse image to detect the location and intensity of the defects in the edge of the knife.
7
1.3
M
AINC
ONTRIBUTIONSResearch of the different technologies in knife sharpness testing lead to the development of three methods of non-contact knife sharpness analysis. These three methods are Capacitance probe sensor, Laser Light reflecting imaging and vision edge detection. Each of these methods were tested and each approach focused on different aspects of knife sharpness analysis. The vision edge detection concept was to analyse the side profile of the edge of the knife. Knowing the roughness of the blade was a factor in knowing if the blade needs to be sharpened, also this method is able to provide an exact profile of the edge of the knife. The laser light reflection technology is a technology that has been described in a patent already published but has expired. This technology is used to analyse the radius of the edge of the knife by correlating the amount and intensity of laser light reflected of the edge. The final technology is the capacitance probe sensor which uses the capacitance between the edge of the knife and the sensor probe. The research shows that the measured capacitance is correlated to the surface area of the knife edge, and is therefore a measure of the effective sharpness of the knife.
The experimentation stage of the project focused on the laser light reflection imaging and the vision edge detection. This was due to the scope of the project and requirements of the company. The test rigs were developed to test the vision edge detection first, with the use of a Digital Single Lens Reflex (DSLR) camera to prove the concept. A program was developed to run analysis on the images coming from the DSLR camera after a photo of the edge was taken. This proved we could accurately create an edge profile on the knife and plot it out in MatLab software. The second test rig has a built in USB microscope on moving axis and the knife also on a moving axis to create a full profile of the blade, and also integrates the camera input in the program.
8
1.4
T
HESISO
RGANIZATION9
2
R
EVIEW OF
C
URRENT
K
NIFE
S
HARPNESS
T
ESTING
T
ECHNOLOGIES
2.1
Definition of Sharpness
Knowing the sharpness of the blade gives the user feedback to be able to improve his or her cutting operations, in which cutting force and cutting quality can be improved. McCarthy (2006) first brought up the issue that there is no standard for measuring “knife sharpness” that takes into consideration blade angle, edge straightness and the blade radius. In the process of defining a blade sharpness index (BSI). McCarthy (2007) says that it should not be dependent on the test material used. This means that blade cutting force alone is not a sufficient measure as different test media would produce different cutting forces for a similar blade. This was verified using a test rig with a sensitive load cell with a knife attached to it. This knife then penetrated a number of different test materials and sensor values were recorded.
Based on this understanding, a BSI is defined in McCarthy (2007) as follows,
Where F is the cutting force, dy is the distance the blade moves to cut the material, δ is the blade displacement or the amount the blade travels into the substrate material, t is the thickness of the substrate material and JIc is the Mode I fracture toughness of the substrate. This index relates the energy required to initiate a cut in a substrate to the fracture
toughness and thickness of the particular substrate and to the indentation depth required to penetrate the substrate. The particular mechanism of cutting for which this metric has been developed is termed ‘‘indentation cutting” in which a blade is pushed perpendicularly through a substrate akin to creating a Mode I fracture surface. McCarthy (2010).
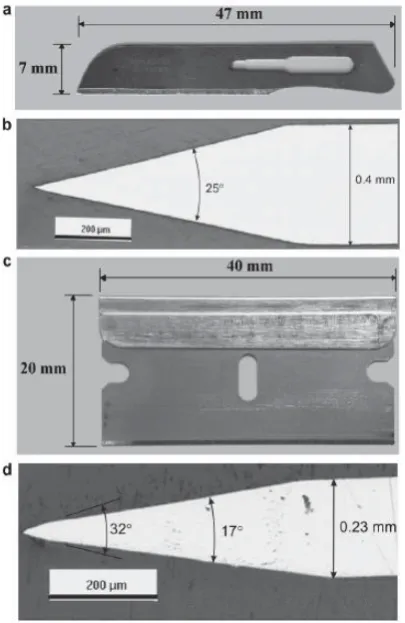
[image:10.595.280.453.380.506.2]Since the force required is normalised by the energy required to cut through the test material, this BSI can be used for comparing different knives and their sharpness, independent of the test material. McCarthy verified that this is indeed the case by using a number of different blades and test materials of different hardness. Figure 2 shows some of the blades being used in his experiments.
10
Figure 2: Blades used in McCarthy (2007) experiments.
A) scalpel blade, B) scalpel blade cross section, C) razor blade, D) Razor blade cross section.
2.2
F
ACTORS AFFECTINGP
ERFORMANCE OFK
NIVESUsing the BSI defined above, McCarthy (2010) studied the effects of different knife shapes and geometries on sharpness. Knives with different tip radii, with single or double grind edge, and different blade grind angles were tested using both computer simulations and physical experiments. The results showed that a small tip radius is the most significant contributing factor to increased blade sharpness. On the other hand, the blade angle is not a significant contributing factor. However, a larger blade angle would have the effect of prolonging the life of the blade. At the same time, double edge sharpened blades have a longer life compared with single edge blades with the same edge angle.
11
[image:12.595.74.386.195.399.2]is not significantly affected. They conclude that there are advantages to measure the sharpness of blades for both skinning and y-cutting operations. Knives sharpened with a 900 grit stone (most polished blade surface finish) and steeling the edge with a sharpening compound to increase the polish of the edge surface give the best cutting results. The blade angle grind was not significant in any of the tests and showed that the sharpness of the knife is fully dependent on how smooth the edge is. The best blade angle will depend on the cutting action of the individual butcher.
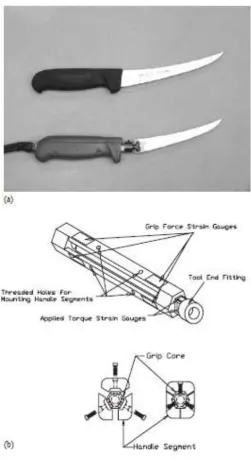
Figure 3: McGorry (2005), grip force knife handle, (a) boning knife, (b) skinning blade.
12
Figure 4: Grip force sensor knife handle (A & B), McGorry (2003).
Marsot Claudon and Jacqmin (2007) looked at musculoskeletal disorders (MSD) in butchers working in meat process plants. Using their own design knife sharpness testing machine they were able to test the force it took knives to cut a test material. The study was to reducing cutting force to reduce the stress in the meat process works which decreases MSD. Their study included knife sharpness levels, knife wear over time, blade inclination and also looking at different hand grips options for cutting operations. They also ran a validation trial using 10 butchers to check the results from the quantitative study.
13
in the direction of the cut. This study also came to the conclusion that blade angle is not significant to blade sharpness although blade angle is significant to the knife edge retention. The blade angle is the angle between the two honed surfaces of the sharp edge, the larger this angle the sturdier the tip of the blade will be and therefore increases the life of the edge. Edge angle should be specified by the operation required and the operator’s inter-individual variations of butchering techniques.
Reilly, McCormack and Taylor’s (2004) literature review on knife sharpness testing devices and methods included patent lists of current technologies used for knife sharpness testing and some of the theories around the factors of knife sharpness. Their data looks at edge straightness, edge angles and tip radius using qualitative measures such as using a microscope and also the Catra knife testing machine. The article lists a number of future research directions such as force measurement, imaging of knife edges, cutting material (test material) analysis and combining the edge geometry measurements with cutting force measurement to decide the sharpness of a knife.
As light can act differently either as a particle or as waves there is a term for the amount of light that will bend around a barrier and it is called diffraction. In the online tutorial created by Willis (Willis, 2007), the concept has been well laid out. The concept is used in a number of ways including radio communications where there is no line of sight between antenna and receiver.
The Harvard Natural Science Lecture demonstrates that there is a detailed description of a test to see the effect of diffraction of laser and white light around the edges of a razor blade. The light is projected on a flat surface, with the razor casting a shadow in the light. The edges of the blade are not sharp in the projection and the colour fringes are clear.
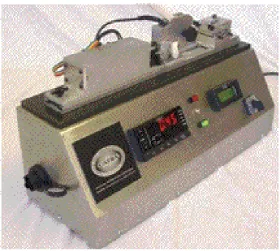
Current knife sharpness testing machines include the Cutlery and Allied Trades Association (CATRA) knife sharpness testing machine and the Anago KST range of knife sharpness testing machines. The CATRA machine, shown in
14
[image:15.595.72.353.69.320.2]Figure 5: CATRA knife sharpness tester
The Anago KST, machine shown in Figure 6, is the other commercially available machine on the market. The actuator is mounted at 45°, on the Anago machine, rather than at 90°, for the CATRA machine, which means the whole length on the blade cuts the test material. The Anago KST machine provides a knife sharpness profile along the full length of the blade to ensure optimum sharpness at the tip through to the handle of the blade. The computer software bundled with the machine is able to analyse the test data, which is recorded for ease of comparison, and provides a final knife sharpness score.
15
Figure 6: Anago KST machine.
Figure 6 shows the current KST in production. The green knife is held in the mount, with the tip toward the test material. The motor will drive the knife towards and through the test material. As it cuts the test material the load cell measures the force required to cut the material. The data is transferred to the computer software for the analysis and to output the plots of the blade profile.
The main weakness for both of these machines is in the way they test knife sharpness. Both use a form of cutting through a test material to find the cutting force of the knife. Cutting though a test material actually blunts the knife in the process of testing it, and while this is minimised using specialised test material it can be an issue. The main problem with this method is the lack of resolution, in the case of the Catra system you can only test one section of the blade at a time and the size of the sections are determined by the width of the rubber test material. The Anago KST has a grid material of 1mm x 1.5mm and with the 45mm degree angle; it means the knife only cuts at 1mm spacing.
2.3
P
ATENT RESEARCH16
[image:17.595.77.229.211.508.2]The second patent, US5571956, is based on a test material strip that the knife cuts through. With a load sensor on the knife mount, the cutting force required to cut the test strip is recorded to calculate the edge sharpness. This method has its flaws such as tearing propagation of the test material, and, as the knife travels through the test material the force reading will be relative to the point in which it is cutting, due to torque. Both of these patents use cutting force measure which requires the knife to cut some material. When we look at non-contact knife sharpness testing apparatus there is only one patent that came up in the search, US5196800.
Figure 7: US5571956 (1996) knife sharpness testing machine, 60 – load cell, 16 – test material, 50 – drive motor, 30 – material tensioner.
17
Figure 8: US5196800 (1993) Capacitance sensor probe, 13 - knife blade, 16 – capacitance probe point, 25 – probe body, 12 – sensor mount, 33a - knife guide.
Figure 8 illustrates the design for the capacitance probe sensor experiment. This design requires the knife blade to be earthed to the probe body, while keeping the tip of the blades at a specific distance from the probe sensor. This design focuses on measuring the
18
3
V
ISION
S
YSTEM FOR
K
NIFE
E
DGE
I
MAGING
3.1
EDGE IMAGING – HOW IT WORKS
The first idea for new ways of testing knife sharpness is to find the roughness of the knife edge. The initial idea is to take a side profile of the knife edge using a DSLR camera, and then input the file into Matlab software. Appendix 1 shows the initial concepts for the test rigs to test the idea of side profile knife sharpness testing. The camera used is a Canon 600D with a macro lens with 4x magnification. The vision toolbox in Matlab has Canny edge detection image analysis, which can extract the edge profile of knife. The Canny edge detection is an algorithm used by the software to detect the edges in an image. Each image creates a plot of the edge with can be compared against other knife edge profiles. The first testing is to test whether there is a significant difference in the plots of the knives. The initial testing will also provide information as to the methods for measuring the significance of the images and the data produced from the edge analysis.
[image:19.595.73.454.358.629.2]The experimentation will be using knives from this collection:
Figure 9: The knives used in the testing. Top to bottom, orange knife, box cutter razor, 900 grit, 600 grit, and 400 grit.
19
3.2
S
INGLE IMAGE,
PROOF OF CONCEPTThis experiment examines the knife edge by measuring the roughness of the plot that Matlab produces from the image analysis. In the process of analysing the edge profile of a knife, a method was developed and experimental test rig built in order to be able to take images of the knife.
Design question one: Can we find the edge profile from a single image?
Experiment 1: Using a vision system to determine the straightness of the edge of the blade. This will detect any nicks or badly sharpened parts of the blade.
3.2.1 Research questions
Can the use of edge detection vision systems find nicks or burrs in an image of the edge of a knife?
3.2.2 Aim
Using a macro camera lens and taking images of a knife blade, use the images taken and put them through a piece of software to analyze the images to find the blunt sections of blade.
3.2.3 Method
Develop the software required to analyze the image.
Have a test image that can simulate the process and find the designed “bluntness” in that image.
Simulation Set-up:
The following test setup was used to get a high resolution image, 18megapixels, of the edge on the knife. The camera used is a Canon 600D DSLR camera, with a lens extension tube of 65mm length, then having a reversal adapter that holds the EFS 18-55mm canon lens in reverse. This set up is to create the maximum magnification of the knife edge. The calculated magnification is between 5-6x. With an APS-C sized sensor of 22.3 x 14.9mm the image will be around 4mm length of the blade edge. An 18 megapixel size image is 5184 x 3456 pixels, gives 1296 points per millimeter.
20
3.3
C
ONTINUOUSK
NIFEE
DGEI
MAGINGFigure 10: Edge detection test rig with the controller. 1, the USB microscope, 2, the test rig frame, 3, the knife, 4, stepper motor to move the knife, 5, the stepper motor controller and 6, the Arduino controller.
The Arduino with LCD panel controls the motors and outputs the motor positions; the controller is connected to the motor driver connected to the stepper motor. This is then connected to the stepper motor which drives the knife mount back and forth. The Arduino is a prototyping micro controller board with a small computer processor to run a simple program. The Arduino has a number of electrical input and output pins to connect to the motors and LCD and operate these devices in the manner required.
21
Figure 11: Edge detection in operation. 1 USB microscope, 2 test rig frame, 3 knife, 4 stepper motor, 5 lead screw.
The second iteration of the knife edge detection microscope system is used not only take a single image but take images at approximately 3.5mm intervals of the full length of the knife edge using the USB microscope. These are put through the software. The results are compared to the knife sharpness tests from the KST knife sharpness testing machine and software.
22
4
C
APACITANCE PROBE MEASUREMENT SYSTEM
Determine the radius of the knife edge using a capacitance probe. This will measure the capacitance between the edge and the probe, which is relative to the surface of the edge, and therefore the tip radius.
4.1
R
ESEARCH QUESTIONSDoes measuring the capacitance between a sensor probe and a blade edge determine the surface area of the edge?
4.2
A
IMTo find out if the radius of the tip on a knife can be measured to determine its effective sharpness. The use of a capacitance sensor will be used to measure the flux capacitance between the knife edge and the probe which should give a reading that is relative to the surface area of the point it is testing.
4.3
E
QUIPMENTCompany Contact Model Sensitivity Min
measure
Price
Capacitec Jeffrey Peduzzi
210-SC-4kHz-MLX HPS-4
0.5 μm 0.1 um US$3200
Lion Precision Jerry Mueller [email protected] 5mm probe
0.06 nm 10 um US$4350
PI Brett Delahunty
[email protected] D-510.021 E-852.10 0.04
μm 20 um AU$885
AU$3545
4.4
METHOD
Once the sensor equipment is chosen the dimensions of the probe will be known and the test rig can be designed. This will involve some rollers that will keep the knife at a consistent distance from the sensor. This distance will be between 0.5 – 1 mm depending on which probe sensor is selected to use for the experiment.
23
other knives tested and compared to the effective sharpness measure from a KST knife sharpness testing machine.
[image:24.595.73.489.201.569.2]Each knife will have a number of samples taken along the full length of the blade to prove its repeatability. This is to insure you have statistical significance between the capacitance test data and cutting force. The experiments will measure three boning knives each with different degrees of sharpness. Their sharpness variation is due to their different edge surface finish, produced through differing grit polishing stones used to sharpen them.
Figure 12: First concept of Capacitance probe test rig. 1 – Roller guides, 2 – Capacitance probe sensor, 3 – test rig frame.
24
5
L
ASER REFLECTION AND LIGHT INTENSITY TEST
To determine the surface area of the edge of the blade by measuring the reflected light of a laser pointed at the edge of the blade.
5.1
R
ESEARCH QUESTIONSWill measuring the intensity of reflected laser light focused on the edge of the knife determine the radius of the edge of the knife?
5.2
A
IMTo find out whether using reflected laser light on the edge of a knife can determine the surface area of the tip.
5.3
M
ETHODThe experiment test rig will have the laser pointed at an angle to the center of the blade, as in appendix 1, with the sensor at an equal and opposite angle. With the laser and the sensor at the same angle the light reflected should be only the light reflected from the surface of the tip at 90° and therefore the intensity of the light should be proportional to the surface area at the point the laser is pointing at.
[image:25.595.71.295.569.733.2]The next test we will do is point the laser directly at the tip of the blade through the centre line. Then take a sample of light intensity levels at different angles around the blade. This should show the diffraction of the laser hitting the edge. The laser used for this testing is a red diode laser with a power rating of 5mw. This is a class 1 laser and does not require any specialized safety equipment other than standard lab gear. These diode lasers, shown in figure 13, can be easily sourced from electrical stores or online.
25
Figure 14: Laser in test rig top view.
The test rig follows the design in appendix 1 with the laser light shining up from underneath, with the knife at normal angles to the camera lens axis. The laser light is focused on the edge of the knife; the camera lens is focused on the edge also. The light that enters the camera should be the light that is reflected in the normal plane. The surface area of the edge of the knife should be able to be calculated by measuring the intensity and size of the red dot on the image taken by the camera.
[image:26.595.72.360.419.637.2]26
Figure 16: Test rig for laser reflection experiment. (Side)
Figure 16 is an image of the test rig taken from the side; it shows the laser module cables on the left side, the red laser beam shines up onto the knife edge, the orange handled knife in Figure 16, which is picked up by the DLSR camera with the macro lens attached to it. The camera is the 600D canon DLSR camera, using a lens extension with the 18-55mm zoom lens in reverse to gain the maximum magnification along with a short focus distance. Using this camera and lens configuration the depth of focus is very shallow which makes it difficult to keep the knife edge in sharp focus. It is important the test rig is firmly placed on the desk and is not moved during the testing. In the figure you can see the test rig is on top a large piece of wood to ensure it is kept stable.
27
6
R
ESULTS AND DISCUSSIONS
6.1
VISION DETECTION EDGE ANALYSIS RESULTS
The first stage of the testing with the DSLR camera and the simple test rig an edge profile was to find out if the equipment was able to prove the concept and test the viability of developing the next test rig.
[image:28.595.85.516.298.552.2]In the following graphs the same two knives were compared with a large section of the blade tested. This was tested using 10 steps with an estimate size of 2.5mm per step. The total length of this test was of 25mm of the blade in both cases.
Figure 17: 900 grit – 11.2 is the standard deviation of the distribution of the data points. Top left: direct input from the edge detection. Top right: Is the direct input without the lines between the points removed. Bottom Left: graph shows the distribution around the mean position. Bottom right: is the normalised distribution points around the mean.
28
of the image. The bottom graphs show the normalised graph, which takes the center of each step and sets it to zero and links the end of one image to the beginning of the next.
[image:29.595.119.495.241.456.2]Those graphs show the points of the knife edge away from the center, the further away the peaks from the center is where the knife edge is nicked, and shows the roughness of the blade. The lines of the graph on the left show the outliers at three standard deviations away from the center. The points outside this line show where the roughness of the knife is the most. Also comparing the standard deviation between knives can show the distribution of the size of the roughness of the blades, the larger the standard deviation is a blade edge with a higher roughness factor.
Figure 18: 400 grit – 32.6 is the standard deviation of the distribution of the data points. The four graphs are the same graphs as figure 17, but with the 900 grit honed knife.
29
6.2
L
ASER LIGHT REFLECTION RESULTSHere is the test data from the images created in the dark room of the light reflecting off the knife edge at 40⁰ from the normal plane.
There does not appear to be any major trends of the edge, as the razor has a machined edge makes it a very distinct point of reflection. A Canon 600d with ISO400 - 4 second shutter speed and auto white balance, with a setting for large JPEG compression was used. Each image size is 5184 x 3456 pixels.
The images were converted to Black and White; with each pixel having intensity between 0-255 values.
The sum of total intensity is just a sum of all the pixels in the image. The bar graph plots the comparison of values.
The standard deviation sum of columns was created by creating a sum of each column in an array, which are plotted in the normal distribution in the lower figure, then calculating the standard deviation from the sum values. The bar graph shows the standard deviation of each of the different blades.
[image:30.595.71.462.399.635.2]
Figure 19:Standard deviation of the sum of the columns of pixels in the edge image,
0.00E+00 2.00E+03 4.00E+03 6.00E+03 oran1 =
oran2 = raz1 = raz2 = gritt4 = gritt42 = gritt6 = gritt62 = gritt9 = gritt92 =
Number of Pixels
Knife type
Standard deviation of sum of columns
30
[image:31.595.113.471.302.532.2]Figure 20: sum of the brightness of all the pixels in the image.
Figure 21: Normal distribution of pixel values of the columns summed.
Figure 21 shows the distribution of the sum of all the pixels in each column; each pixel has an intensity from 0 -255. The brightest and largest part of the image is the point where the laser beam is reflected in the center of the image. These graphs illustrate the different blades, and the standard deviation of the normal distribution is evaluating the spread of the laser beam as it is reflected off the edge of the blade.
This testing confirmed that the concept works, while leaving a number of variables untested. Further experimentation is required to gather proof of concept for this knife sharpness testing technique. The first experiment used a constant angle test rig set to 90 degrees between the laser beam and the center axis of the camera and its lens. The second experiment considered whether the angle of incident would affect the result significantly. The expanded experiment included other test rigs are 70⁰, 90⁰, and 100⁰. The results are in the next figures 20-22.
0.00E+00 1.00E+07 2.00E+07 3.00E+07 oran1 =
oran2 = raz1 = raz2 = gritt4 = gritt42 = gritt6 = gritt62 = gritt9 = gritt92 =
Pixel intesity
Knife
type
Sum of total intensity
31
Figure 22: Standard deviation of the brightness of laser, grouped by knife type
0 1000 2000 3000 4000 5000
s7green4001 s7green4002 s7green4003 s8green4001 s8green4002 s8green4003 s9green4001 s9green4002 s9green4003 s1green4001 s1green4002 s1green4003 s7green9001 s7green9002 s7green9003 s8green9001 s8green9002 s8green9003 s9green9001 s9green9002 s9green9003 s1green9001 s1green9002 s1green9003 s7orange1 s7orange2 S7orange3 s8orange1 s8orange2 s8orange3 s9orange1 s9orange2 s9orange3 s1orange1 s1orange2 s1orange3 s7razor1 s7razor2 s7razor3 s8razor1 s8razor2 s8razor3 s9razor1 s9razor2 s9razor3 s1razor1 s1razor2 s1razor3
Number of pixels
Knife
type and r
e
fe
re
nce
32
Figure 23: Standard deviation of the brightness of laser, grouped by laser angle
0.00E+00 1.00E+03 2.00E+03 3.00E+03 4.00E+03 5.00E+03
s1green4001 s1green4002 s1green4003 s1green9001 s1green9002 s1green9003 s1orange1 s1orange2 s1orange3 s1razor1 s1razor2 s1razor3 s7green4001 s7green4002 s7green4003 s7green9001 s7green9002 s7green9003 s7orange1 s7orange2 S7orange3 s7razor1 s7razor2 s7razor3 s8green4001 s8green4002 s8green4003 s8green9001 s8green9002 s8green9003 s8orange1 s8orange2 s8orange3 s8razor1 s8razor2 s8razor3 s9green4001 s9green4002 s9green4003 s9green9001 s9green9002 s9green9003 s9orange1 s9orange2 s9orange3 s9razor1 s9razor2 s9razor3
Number of pixels
Knife
type and r
e
fe
re
nce
33
Figure 24: Total sum of the brightness of the reflected laser light.
0 10000000 20000000 30000000 40000000
s1green4001 s1green4002 s1green4003 s1green9001 s1green9002 s1green9003 s1orange1 s1orange2 s1orange3 s1razor1 s1razor2 s1razor3 s7green4001 s7green4002 s7green4003 s7green9001 s7green9002 s7green9003 s7orange1 s7orange2 S7orange3 s7razor1 s7razor2 s7razor3 s8green4001 s8green4002 s8green4003 s8green9001 s8green9002 s8green9003 s8orange1 s8orange2 s8orange3 s8razor1 s8razor2 s8razor3 s9green4001 s9green4002 s9green4003 s9green9001 s9green9002 s9green9003 s9orange1 s9orange2 s9orange3 s9razor1 s9razor2 s9razor3 Pixel Intesity Knife
type and r
e
fe
re
nce
34
The standard deviation of the knife tests are the standard deviation of the normal distribution of the total sum of the pixels in each column. The input is the edge detected array, this has pixels between 0-255 in intensity. Each column of the array is then summed to create the single array, statistical analysis on this array can estimate the standard deviation to be able to compare the distribution of the intensity of the laser beam in the image.
35
7
C
ONCLUSIONS
In conclusion, the research in chapter 2 shows the usefulness of knife sharpness; in quality and cost savings it is a very useful tool for meat process industries. Finding effective techniques for measuring sharpness is quite difficult as the only quantitative methods require the knife to cut some test material. While this can provide an effective measure of sharpness it causes wear on the knife requiring re-sharpening or even disposal of this blade and that knife is then not used.
In the process of finding the knife sharpness without contact with the blade, is the next generation of knife sharpness testing. While this would seem as simple as measuring the geometry of the knife blade and giving it a score, this is difficult due to the very small size of the tip of the blade right down to tens of nanometres in very sharp blades.
7.1
V
ISION DETECTION EDGE ANALYSIS CONCLUSIONSThe vision detection edge analysis experimentation was successful to prove that the edge of the knife can be photographed to create a detailed edge profile through specific software. While this is the most effective experiment in the study, the usefulness of this tool will be in analyzing the edge profile, which is useful for the knife sharpener, while not directly proportional to the sharpness of the knife. The literature states that the sharpness of the knife comes from the radius of the tip rather than the roughness of the edge.
The main focus of this portion of the project was the research into the edge detection algorithm, with an in-depth study of the different edge analysis tools available in both the open CV library and the MatLab software packages. The final solution was to use an effective image input, using a highly contrasting and sharp image. This was created by using a bright light to shine into the camera, and the knife blade edge would become a dark shadow on the image. This would be input into the software which looked for the highest change in pixel intensity in the image, along with the morphology transformations and the conversion from colour to grayscale to create the highly detailed profile graphs.
The final resolution of the edge detail was all the way down to 1296 points per mm in the final configuration of the test equipment. While this will not be the final resolution of a ready-to-market product, this experiment proves that this technology will be able to produce a suitable replacement for the current knife sharpness testing machinery on the market that utilize cutting force measures as the measurement variable.
36
technology is also able to output a distance to the edge from a center axis, which may be usefully implemented in the laser and capacitance probe technologies, as both those require a very accurate position and distance from probe and focus axis respectively, to ensure high precision.
7.2
L
ASER LIGHT REFLECTION EXPERIMENT CONCLUSIONSThe laser light reflection testing experiment was practical for measuring the surface area at a point on the knife edge. This testing technique proved to be a little difficult to determine the difference between sharp and blunt blades, even taking into account considerations for different angles of reflected light on the edge of the knife. While this is true we did record different results from blades sharpened using different measures, and also could measure the width of the reflected spot of laser light to distinguish different blades, the determination of correlation to the blades cutting force testing will require further testing.
The test rigs developed used a small 5mw laser, and had a fairly broad beam which could be optimized with higher quality lasers and focusing lenses, and creating a test rig where you can move the blade along its axis so as to measure different sections of the blade will be further developments for the technology. The test rigs had the laser light shining across the edge and reflect into camera lens, further testing this technology should use the laser and camera in line with the blade to gather more information on the edge of the knife.
Laser light reflection technology is the cheapest of the three methods of edge detection analysis, while more research will be required to get this technology ready for industry. It may also be useful to combine this technology with the edge detection to gain the full spectrum of the edge. The main limiting factor of the experiment is the magnification and therefore, depth of focus of the images. Ensuring the edge of the knife stays at the correct distance from the edge will ensure better testing and more precision results.
7.3
C
APACITIVE MEASURING EXPERIMENT CONCLUSIONSThe capacitive measuring experiment was not included in this project as it currently sits outside the scope of the project as it is the most expensive technology introduced in the literature review. This technology in theory will be a good measure for the sharpness of the blade testing. McCarthy (2010) and the conclusions from the literature review state that the most effective measure of knife sharpness is the radius of the tip. The literature states that the capacitance measuring device measures the capacitance from the tip of the blade and is relative to the area normal to the axis of the blade, and therefore relative to the radius of the tip.
37
probes on the market are 3mm in diameter. This will be one of the testing factors for further research.
Another concern is the fact that the patent, US5196800 (1993) on this particular concept of using capacitance probe for knife sharpness analysis, is not currently on the market or even being developed by any business or individual in the knife sharpness testing industry. This may mean that the inventors of this use of the capacitance probe felt that it was not an effective tool for sharpness analysis or just that the limitations to their research meant that they were unable to finish the research in this field.
Further research is required to complete the full usefulness of this technology, and to find out whether this technology will be useful for non-contact knife sharpness testing analysis. This being an expensive technology, Company X may find this highly accurate measure of the edge of the knife may be able to be effectively used for high end or even laboratory style knife sharpness testing tools in the future.
38
7.4
Acknowledgements
Many thanks must go to Mr Peter Dowd and company X for providing this project and the opportunity to develop these new technologies for a real industry. I look forward to seeing what products and developments come from this research. I would also like to thank Dr Aruna Shekar and Dr Edmund Lai, my university lecturers and project supervisors. They ensured the project stayed on task and guided the final completion of this thesis, I would not have gotten this far without their encouragement. Finally, I would like to thank my parents and family for their loving support and constant encouragement from the beginning to the end of this project.
Thank you all so much,
39
8
A
PPENDIX
41
42
8.2
M
ATLAB CODE–
L
ASER LIGHT REFLECTION CREATING THE PLOTSorange1 = imread ('laser_orange1.JPG'); razer1 = imread ('laser_razer1.JPG'); gritt400 = imread ('laser_400gritt1.jpg'); gritt600 = imread ('laser_600gritt1.jpg'); gritt900 = imread ('laser_900gritt1.jpg');
orange2 = imread ('laser_orange2.jpg'); razer2 = imread ('laser_razer2.jpg'); gritt402 = imread ('laser_400gritt2.jpg'); gritt602 = imread ('laser_600gritt2.jpg'); gritt902 = imread ('laser_900gritt2.jpg');
orange1 = rgb2gray (orange1); razer1 = rgb2gray (razer1); gritt400 = rgb2gray (gritt400); gritt600 = rgb2gray (gritt600); gritt900 = rgb2gray (gritt900);
orange2 = rgb2gray (orange2); razer2 = rgb2gray (razer2); gritt402 = rgb2gray (gritt402); gritt602 = rgb2gray (gritt602); gritt902 = rgb2gray (gritt902);
oran1 = std(sum (orange1)) oran2 = std(sum (orange2)) raz1 = std(sum (razer1)) raz2 = std(sum (razer2)) gritt4 = std(sum (gritt400)) gritt6 = std(sum (gritt600)) gritt9 = std(sum (gritt900)) gritt42 = std(sum (gritt402)) gritt62 = std(sum (gritt602)) gritt92 = std(sum (gritt902))
subplot(2,3,1); plot(sum(orange1)) title ('orange blade')
subplot(2,3,2); plot(sum(razer1)) title ('razer blade')
subplot(2,3,4); plot(sum(gritt400))
title ('400 gritt blade')
subplot(2,3,5); plot(sum(gritt600))
title ('600 gritt blade')
subplot(2,3,6); plot(sum(gritt900))
43
8.3
M
ICROSCOPE EDGE DETECTION CODE// OpenCV_300.cpp : Defines the entry point for the console application. // #include "stdafx.h" #include <opencv2/imgproc/imgproc.hpp> #include <opencv2/highgui/highgui.hpp> #include <stdlib.h> #include <stdio.h> #include <iostream> #include <string> #include <fstream>
using namespace std;
using namespace cv;
using namespace System::IO::Ports;
Mat src, src_gray;
Mat dst, detected_edges, output, output2, morphout, display_mat; Mat image;
Mat frame;
int edgeThresh = 1;
int lowThreshold, highThreshold;
int const max_lowThreshold = 120;
int ratio = 9;
int kernel_size = 3;
char* window_name = "Edge Map";
int morph_elem = 0;
int morph_size = 3;
int morph_operator = 1;
int const max_operator = 4;
int const max_elem = 2;
int const max_kernel_size = 21;
int edgeout[2000];
int count1 = 0;
int i = 0, n = 0;
int x[6000], y[6000];
double stddev = 0, res[6000];
int capture = 0; int const capture1 = 3;
int loopadder = 0;
int lastreading = 0;
int maxdiff = 0, maxdiffpixel = 0, diff = 0;
ofstream myfile1("residuals.txt"); ofstream myfile3("output.txt"); ofstream myfile("example.txt");
void leastsquared() {
double SUMx = 0, SUMy = 0, SUMxy = 0, SUMxx = 0, SUMres = 0, slope = 0, y_intercept = 0, y_estimate = 0;
/*FILE *infile;
infile = fopen("xydata", "r");
if (infile == NULL) printf("error opening file\n"); fscanf(infile, "%d", &n);
44
y = (double *)malloc(n*sizeof(double));
SUMx = 0; SUMy = 0; SUMxy = 0; SUMxx = 0;*/
for (i = 0; i < n; i++) {
//fscanf(infile, "%lf %lf", &x[i], &y[i]);
SUMx = SUMx + x[i]; SUMy = SUMy + y[i];
SUMxy = SUMxy + x[i] * y[i]; SUMxx = SUMxx + x[i] * x[i]; }
slope = (SUMx*SUMy - n*SUMxy) / (SUMx*SUMx - n*SUMxx); y_intercept = (SUMy - slope*SUMx) / n;
printf("\n");
printf("The linear equation that best fits the given data:\n"); printf(" y = %6.2lfx + %6.2lf\n", slope, y_intercept); printf("---\n"); printf(" Original (x,y) Estimated y Residual\n"); printf("---\n");
SUMres = 0;
for (i = 0; i < n; i++) {
y_estimate = slope*x[i] + y_intercept; res[i] = y[i] - y_estimate;
SUMres = SUMres + res[i]*res[i];
//printf(" (%6.2lf %6.2lf) %6.2lf %6.2lf\n", x[i], y[i], y_estimate, res);
if (myfile1.is_open()){
myfile1 << i << " " << y[i] << " " << y_estimate << " " << res[i] << endl;
}
else cout << "Unable to open file 2"; }
SUMres = SUMres / n; stddev = sqrt( SUMres);
printf("---\n"); printf("Residual sum = %6.2lf\n", SUMres);
printf("Std deviation = %6.2lf\n", stddev); }
/**
* @function CannyThreshold
* @brief Trackbar callback - Canny thresholds input with a ratio 1:3
*/
void CannyThreshold(int, void*) {
/// Reduce noise with a kernel 3x3 blur(dst, detected_edges, Size(3, 3)); //detected_edges = src_gray;
/// Canny detector
Canny(detected_edges, output, lowThreshold, lowThreshold * 3 , kernel_size);
/// Using Canny's output as a mask, we display our result //output = Scalar::all(0);
//image.copyTo(output, detected_edges); //detected_edges.copyTo(output);
45
imshow("edge detect", display_mat);
}
void Morphology_Operations(int, void*) {
Matelement = getStructuringElement(morph_elem, Size(2* morph_size + 1, 2* morph_size + 1), Point(morph_size, morph_size));
/// Apply the specified morphology operation
morphologyEx(src_gray, output, MORPH_OPEN, element);
resize(output, display_mat, Size(detected_edges.cols / 4, detected_edges.rows / 4)); imshow("morph", display_mat);
//resize(dst, display_mat, Size(dst.cols / 4, dst.rows / 4)); //imshow("morph", display_mat);
}
void edgedetectloop(){
for (i = 0; i < output.cols; i++){
for (int j = 1; j < output.rows; j++){
diff = (output.at<uchar>(j, i)) - (output.at<uchar>(j - 1, i)); //diff = output.at<uchar>(j - 1, i);
if (diff > maxdiff){ maxdiff = diff; maxdiffpixel = j; }
}
if (myfile.is_open()){
myfile << i+loopadder << " " << maxdiffpixel << " " << endl;
//cout << i << " " << maxdiff << " " << maxdiffpixel << endl;
output2.at<uchar>(maxdiffpixel, i) = 0; x[i] = i;
y[i] = maxdiffpixel; }
else cout << "Unable to open file 1 \n"; maxdiff = 0;
lastreading = y[i]; }
}
void edge_analysis(){
}
int main(int argc, char** argv) {
SerialPort port("COM4", 9600, Parity::None, 8, StopBits::One); port.Open();
46
cap.set(3, 2048); cap.set(4, 1536);
if (!cap.isOpened()) // if not success, exit program {
cout << "Cannot open the video cam" << endl;
return -1; }
double dWidth = cap.get(CAP_PROP_FRAME_WIDTH); //get the width of frames of the video
double dHeight = cap.get(CAP_PROP_FRAME_HEIGHT); //get the height of frames of the video
cout << "Frame size : " << dWidth << " x " << dHeight << endl;
// start of loop!!!!!!
int j = 0;
for (j = 0; j < 10; j++){
namedWindow("MyVideo", WINDOW_AUTOSIZE); //create a window called "MyVideo"
while (1) {
bool bSuccess = cap.read(frame); // read a new frame from video
if (!bSuccess) //if not success, break loop {
cout << "Cannot read a frame from video stream" << endl;
break; }
resize(frame, frame, Size(dWidth / 4, dHeight / 4));
int num = dWidth / 8;
imshow("MyVideo", frame); //show the frame in "MyVideo" window
for (int j = 1; j < frame.rows; j++){
diff = (frame.at<uchar>(j, num+ 3)) - (frame.at<uchar>(j - 1, num + 3));
//diff = output.at<uchar>(j - 1, i);
if (diff > maxdiff){ maxdiff = diff; maxdiffpixel = j; }
}
cout << maxdiffpixel << endl; diff = 0;
maxdiff = 0;
/*if (maxdiffpixel < 128){ port.Write("d");
}
else if (maxdiffpixel > 200){ port.Write("c");
}*/
if (waitKey(30) == 27) //wait for 'esc' key press for 30ms. If 'esc' key is pressed, break loop
47
cout << "esc key is pressed by user" << endl;
break; } } cap.read(image); destroyWindow("MyVideo"); imwrite("webcam_capture.jpg", image);
// std::string name; //if (argc != 2)
//{
// //cout << " usage: display_image imagetoloadanddisplay" << endl;
// //return -1;
// std::cin >> name; //}
//image = imread(argv[1], IMREAD_COLOR); // Read the file
//image = imread("webcam_capture.jpg", IMREAD_COLOR); // Read the file
if (!image.data) // Check for invalid input {
cout << "Could not open or find the image" << std::endl;
return -1; } dst.create(image.size(), image.type()); detected_edges.create(image.size(), image.type()); output.create(image.size(), image.type()); output2.create(image.size(), image.type()); morphout.create(image.size(), image.type());
/// Convert the image to grayscale
cvtColor(image, src_gray, COLOR_BGR2GRAY);
/// Create a window
namedWindow("original image", WINDOW_AUTOSIZE); imshow("original image", image);
//waitKey(0);
namedWindow("Gray scale", WINDOW_AUTOSIZE); imshow("Gray scale", src_gray);
//waitKey(0);
destroyWindow("original image"); destroyWindow("Gray scale");
namedWindow("morph", WINDOW_AUTOSIZE);
/// Create Trackbar to choose kernel size
createTrackbar("Kernel size:\n 2n +1", "morph", &morph_size, max_kernel_size, Morphology_Operations);
/// Default start
Morphology_Operations(0, 0);
//waitKey(0);
destroyWindow("morph");
48
edgedetectloop();
// display output.
resize(output2, display_mat, Size(detected_edges.cols / 3, detected_edges.rows / 3));
imshow("output2", display_mat);
n = output.cols; //n is the length of loop to go through each columb of the image.
leastsquared (); // does the calculation to estimate the centerline using least squared calc.
double limit = stddev * 3; // turning the std deviation into the upper
limit (this will be change overtime to a single mutiplier using the estimation of all the images/edges regression numbers.
//waitKey(0);
for (i = 0; i < n; i++){
if (res[i] > limit){
myfile3 << i + loopadder << " " << res[i] << " " << endl;
}
else if (res[i] < (limit *-1)){
myfile3 << i + loopadder << " " << res[i] << " " << endl;
}
}
loopadder = loopadder + n; cout << loopadder << endl;
/*if (lastreading < 800){ port.Write("cc");
}
else if (lastreading > 1500){ port.Write("dd"); }*/ port.Write("a"); } myfile.close(); myfile1.close(); myfile3.close(); port.Close();
cout << "finished" << endl;
49
}
[image:50.595.73.529.157.257.2]8.4
KST
COMPARISON TEST DATA OF KNIVES [image:50.595.70.539.230.661.2]Figure 26: razor edge
Figure 27: orange handle
Figure 28: green 900
50
51
9
R
EFERENCES
Hainsworth, S. V., Delaney, R. J., & Rutty, G. N. (2008). How sharp is sharp? Towards quantification of the sharpness and penetration ability of kitchen knives used in stabbings. International journal of legal medicine, 122(4), 281-291.
"In-Depth Description - Harvard Natural Sciences Lecture ..." 14 May. 2015
http://sciencedemonstrations.fas.harvard.edu/icb/icb.do?keyword=k16940&pageid=icb.page9 3273&pageContentId=icb.pagecontent221640&view=view.do&viewParam_name=indepth.ht ml
Marsot, J., Claudon, L., & Jacqmin, M. (2007). Assessment of knife sharpness by means of a cutting force measuring system. Applied Ergonomics, 38(1), 83-89.
McGorry, R. W., Dowd, P. C., & Dempsey, P. G. (2003). Cutting moments and grip forces in meat cutting operations and the effect of knife sharpness. Applied ergonomics, 34(4), 375-382.
McGorry, R. W., Dowd, P. C., & Dempsey, P. G. (2005). A technique for field measurement of knife sharpness. Applied ergonomics, 36(5), 635-640.
McGorry, R. W., Dowd, P. C., & Dempsey, P. G. (2005). The effect of blade finish and blade edge angle on forces used in meat cutting operations. Applied ergonomics, 36(1), 71-77.
McCarthy, C. T., Hussey, M., & Gilchrist, M. D. (2007). On the sharpness of straight edge
blades in cutting soft solids: Part I–indentation experiments. Engineering Fracture Mechanics,
74(14), 2205-2224.
McCarthy, C. T., Annaidh, A. N., & Gilchrist, M. D. (2010). On the sharpness of straight edge
blades in cutting soft solids: Part II–Analysis of blade geometry. Engineering Fracture
Mechanics, 77(3), 437-451.
Marsot, J., Claudon, L., & Jacqmin, M. (2007). Assessment of knife sharpness by means of a cutting force measuring system. Applied Ergonomics, 38(1), 83-89.
52
Reilly, G. A., McCormack, B. A. O., & Taylor, D. (2004). Cutting sharpness measurement: a critical review. Journal of Materials Processing Technology, 153, 261-267.
Szabo, R. L., Radwin, R. G., & Henderson, C. J. (2001). The influence of knife dullness on poultry processing operator exertions and the effectiveness of periodic knife steeling. AIHAJ-American Industrial Hygiene Association, 62(4), 428-433.
Willis, M. "Propagation Tutorial - Diffraction." 2007. 14 May. 2015 http://www.mike-willis.com/Tutorial/PF7.htm
Yuan, Z. J., Zhou, M., & Dong, S. (1996). Effect of diamond tool sharpness on minimum cutting thickness and cutting surface integrity in ultraprecision machining. Journal of Materials Processing Technology, 62(4), 327-330.