AND SOCIAL INDICATORS
FOR SUSTAINABLE DEVELOPMENT
Copies of this paper may be obtained from The Economic and Social Research Institute (Limited Company No. 18269}. Registered Office." 4 Burlington Road. Dublin 4.
Price IR£16.00
FORMULATING ENVIRONMENTAL
AND SOCIAL INDICATORS
FOR SUSTAINABLE DEVELOPMENTS. Scott, B. Nolan and T. Fahey
© THE ECONOMIC AND SOCIAL RESEARCH INSTITUTE DUBLIN, 1996
The authors are grateful to their ESRI colleagues who made helpful comments, in particular Terry Baker, Patrick Honohan, John Fitz Gerald, Alan . Barrett and John Lawlor. They wish to thank Maura Rohan and Regina Costello for Library services, Pat Hopkins for managing the drafts and Mary McElhone, Phil Browne and Regina Moore for editing and bringing this paper to publication.
The discussion of.environmental indicators in this essay has benefited from consultations with many individuals including Michael Lucey, Gerry O’Hanlon and Gerry Milligan of the CSO, Larry Stapleton of the .Environmental Protection Agency, Frank Convery of.the Environmental Institute, Myriam Linster and Jean-Philippe Barde of OECD, Jan Scherp of DG 11 of the European Commission, Prashant Vaz6 of the CSO m the UK, Kirk Hamilton of the World Bank, Giles Atkinson of CSEP, GE. A debt of gratitude is owed to the late Jim McGilvray of the University of Strathclyde who, as a fine and generous teacher, promoted the sustainability of htiman capital in a special way. All remaining errors in the paper are the responsibility of the authors.
In particular we are grateful to Geraldine Tallon and Maureen Doyle of the Department of the Environment for their constructive help and for the funding from the Department which has supported this work, undertaken by the
Page
Acknowledgements iv
General Summary 1
Chapter
I INTRODUCTION 8
PART I: ENVIRONMENTAL INDICATORS 13
2 OPTIONS AND METHODOLOGIES 14
2. | Environmental Indicators for Individual Themes 16
2.1.1 OECD Core Set of Environmental Indicators 16
"2.1.2 Eurostat Physical Indicators: Pressure Indices 22
2.1.3 Adriaanse’s Indicators for the Netherlands 23
2.1.4 Other Indicators for Individual Themes 25
2.2 Green National Income. 28
2.2.1 Satellite Accounts Integrated into the
National Accounts Framework 31
- Depletion in the National Accounts 36
- Degradation in the National Accounts 37’ - Defensive Expenditure in the National
Accounts 38
2.2.2 Examples of Integrated National Accounts 40
2.3 National Sustainability Indicators 47
2.3. I Examples of Application of the National
Sustainability Criterion 49
3 OVERVIEW OF ENVIRONMENTAL DATA AND
INFORMATION STRUCTURES IN IRE~D 53
3.1 Environmental Indicators for Individual Themes 59
3.2 Green National Income 62
4 SUMMARYAND RECOMMENDATIONS ON ENVIRONMENTAL INDICATORS
4.1 Types of Indicators 4.2 Data Availability 4.3. Choice of Themes
4.4 Indicators and Policy - Lessons from Abroad 4.5 Recommendations on Environmental Indicators
68 68 71 72 76 78
PART 11: SOCIAL INDICATORS
5 SOCIAL 1NDICA TORS
5.1 Introduction
5.2 Concepts of Welfare
5.2. I Dimensions of Welfare
-5.2.2 Defining and Measuring Development 5.2.3 Capabilities or Outcomes
5.2.4 Human Development Index 5.3 Multiple Indicators
5.4 OECD Social Indicators 5.5 Social Indicators for Ireland
5.5.1 Data Requirements 5.6 Recommendations
References
Appendices
Environmental Indicators Under Co~ideration by the United Nations Environment Programme and the World Bank I1 Calculation of the User Cost Approach to Depletion Ill Origin and Destination of Emissions and Natural
Resources in the Netherlands, 1991
IV List of Tables from lrish Environmental Statistics (1993) V Refinement of OECD Indicators, Proposed by EPA
Glossary of Terms
Papers Relating to the Environment, Published by the ESRI (from 1990)
Table
2.1 2.2
2.3 2.4
2.5
2.6 2.7
2.8 3.1 3.2a 3.2b 3.2c ’ 4.1 5.1
5.2
Summary of OECD Indicators by Environmental Issue
Regional Water Resot~rces and Demands in the UK in 1990 (MI/da~)
Traditional National Accounts (shaded) and Satellite Accounts Categories of Environmental Protection Services Suggested by UN (ISIC 2 digit)
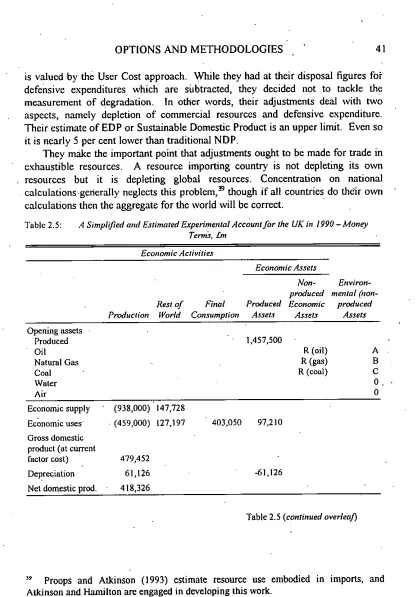
A Simplified and Estimated Experimental Account for the UK in 1990 - Money Terms " ’
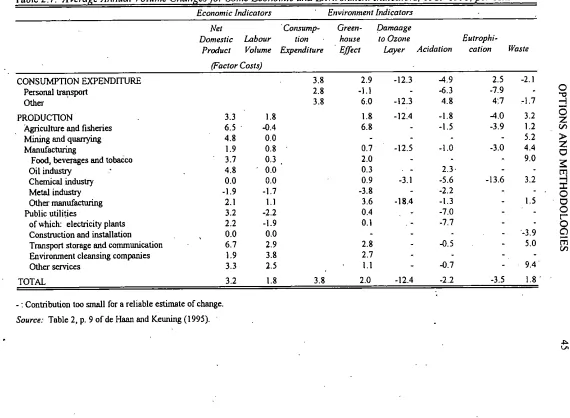
Eco Domestic Product for Mexico, 1985 (Million New Pesos) Average Annual Volume Changes for Some Economic and Environment Indicators, 1989-1991, per cent
Marginal Social Costs per tonne of Air Pollutant EmiRed ($) Quality of Water in Selected Rivers, 1971, 1981, 1986 and i990
Main Environmental Problems of Concern: First Mentioned Main Environmental Problems of Concern: Second Mentioned Main Environmental Problems of Concern: Third Mentioned Potential Environmental "State" Indicators for Ireland Ranking of Developed Countries by Human Development Index and GNP per capita
oEcD List of Social Indicators
Page
20
27 34
39
41 43
45 51 60’ 63 64 65 75
87 91
Figure
2.1
2.2
2.3
2.4
2.5
The Pressure-State-Response Framework
Example for Iceland of Core Indicators in Environmental Performance Reviews (OECD, 1994)
Two Examples of Adriaanse’s Indicators for the Netherlands (a) Economic and Environmental Performance of Agriculture (b) Acidification Indicator
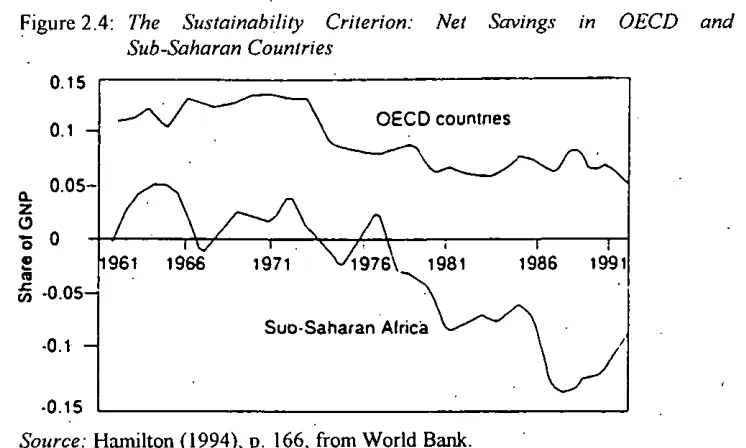
The Sustainability Criterion: Net savings in OECD and Sub-Saharan Countries
UK Sustainability: Genuine Savings Rates for 1980 to 1990 (per cent of GDP)
Page
17
21
26
49
52
The programme of the present government includes a commitment to "working towards a new set of indicators of sustainable economic development which will take account of environmental as well as social factors". The central concern is to go beyond existing measures of economic activity produced within the national accounting framework (such as GDP or national income) in order to develop a more complete picture of economic and social progress in Ireland. The present publication provides an overview of the issues and options which arise in connection with this commitment, and suggests steps which might be taken in pursuing it.
The publication is set out in two largely separate essays, one dealing with environmental indicators, the other with social indicators. While it would be desirable to deal with those two topics together, the differences in the intellectual and institutional traditions from which they have developed are such that an integrated approach has not yet emerged. In the final section of the present summary, the recommendations emerging from the tWO essays are brought together, though they are presented separately in the body of the report.
PART 1. Environmental Indicators
There have recently been many calls for "the production of envitTonmental indicators and a flurry of activity on developing them. This stems from a concern about the sustainabilit), of the world’s stock of environmental assets at the hand of human activity. As with any asset, if environmental assets become depleted or degraded, the future flow of benefits will shrink and could disappear altogether, with serious consequences in some cases. To help them to ward off these sorts of situations people require to be kept informed. To take an example, overfishing is, by definition, unsustainable, but it is less likely to happen if people know that it is occurring. Another provision is that the fishstock be owned or effectively controlled. A feature of many environmental assets is that they are frequently ¯ widespread and not owned, so information, on them is not automatically gathered and control is not exercised; the earth’s atmosphere is perhaps the best example.
assets where control may not be easy and information may not be gathered. Nevertheless, these are true assets which bestow real benefits on an Undefined
number of people. These recurring features of benefits that are widely spread, non-ownership and difficulties of control are the reasons why we require regular information as to whether the assets are being used in a sustainable manner. They are also the reasons why information is difficult to obtain.
The environment has many aspects which are hard to evaluate in monetary terms. Consequently, data must be expressed in physical units, and a huge amount
of information can result, difficult for even the expert to assimilate. The attractive idea that such information might be condensed in a few easily-understood indicators leads some people to feel that there should be similar headline measures for the environment as there are for the economy, like national income or consumer prices. In fact, of course, different levels of information are needed for different uses. A single serious incident ofa fishkill should be highlighted as at present, but as this may not be representative one will also need to know the overall situation in relation to Ireland’s rivers, how they compare with rivers abroad. For similar reasons, work on environmental indicators has progressed at many levels elsewhere.
Three main types of indicator are described on which Ireland might embark. These are:
(a) environmental indicators for individual themes, (b) environmentally adjusted (or green) national income, (c) national sustainabiliiy indicators,
the ordering being roughly in ascending order of aggregation or monetary measurement. The basic data ai’e usually expressed in physical units and indicators in physical units are receiving most official attention at present. Each of the three sorts is described with many illustrated examples. A summary of each
is as follows.
are, however, an essential first step. Indicators described include the OECD’s core set, Eurostat’s Pressure Indices which are still under construction as part of a large programme, Adriaanse’s sectoral indicator for agriculture.and his theme indicator for acidification in the Netherlands, and finally Pearce’s indicator of the sustainability of regional water resources in the UK.
(b) Green national income has been the subject of preliminary estimates in many ’countries - the word "preliminary" applies because there are still several issues of measurement to be settled. In fact even the system of traditional national accounts, being only fifty years old, is subject to unsettled issues. National income (NNP)I is a poor measure of welfare, being merely a measure of economic activity. Howevei’, it is one of the few comprehensive measures available, it is comparable betnveen countries thanks to the system ’overseen by the United Nations and, being net of depreciation or the measure you arrive at "not reducing your productive capacity" to quote Hicks (i946), it is a valid measure of income. Unfortunately nationar!ncome as currently measured only incorporates depi-eciation of produced assets, and .does not depreciate non-produced natural assets which are non-marketed, and even those which are marketed, like forest and mineral depletion, are not depreciated in the national accounts.
Marketed assets are the first to receive attention in environmentally adjusted national income. Some questions still hang over how depletion is to be valued: one method is to convert the net income from a depleting resource into an equivalent perpetual stream of true (i.e., sustainable) income. Another important adjustment is to incorporate the degradation of environmental assets, such as the eutrophication of rivers or the damage to the ozone layer. It is here that various diffic:ulties’ arise in obtaining monetary valuations (though a recent example for air pollution is given), such that ihe United Nations are recommending that countries start by constructing "satellite accounts" which may’ be expressed in physical units (like quantities of polluting gases released, or area of land damaged). In the Netherlands, a practical extension of the exercise has produced tables showing the changes in output from the main production sectors in the economy, alongside their annual changes in environmental damage. Another adjustment issue relating to measured national income is the treatment of expenditure on remedying and preventing environmental damage caused in the production process. While the manner of this adjustment is not settled, countries are encouraged to record such expenditure according to a standard format.
(c) National sustainability indicators are related to green national income in that the data requirements are similar. A sustainability indicator is a measure of the change in assets. If the change in assets, measured indirectly by an adjusted savings rate, is positive when averaged over a period of years, then society is on a sustainable path. If negative, society is depleting its assets - if this situation persists, society will not be able to sustain the same level of well-beiag. The national sustainability indicator is the national savings rate adjusted for depletion and degradation of environmental assets. Itis b3., this indicator that many developing countries, which rely heavily on depletion of natural resources, can be seen to-be on an unsustainable path. Their well-being will decline in the future, on the basis of present trends; yet their national income, traditionally measured, would not reveal this - as it has recently been rising. Sustainability indicators are illustrated for Sub-Saharan Africa and the OECD group of countries, and one for the UK.
The data situation in Ireland for the task of preparing environmental indicators is patchy though reasonably good in parts. The Environmental Protection.Agency (EPA) is charged by the Environmental Protection Act~ of 1992 with a statutory obligation to establish and maintain a data base related to environmental quality. The Central Statistics Office (CSO), under the Statistics Act of 1993, has the authority to co-ordinate official statistics compiled by public authorities, to ensure ¯ adherence to statistical standards and the use of appropriate classifications.
Co-operation between these two bodies therefore is necessary, and may lead to cost savings where their data collection, collation and dissenunation activities are related. Furthermore, any green national accounting has to be closely associated with the CSO’s traditional national accounting. Attention to the environment would also be strengthened by close association with the central statistics agency, if experienee from abroad is an indication.
There is no single type of indicator above all others which should be developed for Ireland, because the different t)~pes of indicator have their uses in different fields. As to the choice of themes to be covered, the international work has a wide and varied range of coverage. In fact the themes are fundamentally similar, though grouped under different heads or using different terminology. The Environmental Protection Agency has listed some refinements to the measures used by OECD, in order to reflect Ireland’s particular conditions. In addition, soundings from a survey of the public, and from non-governmental organisations (via their conference topics), reveal concerns similar to those of the international agencies, with the addition of survival of the built heritage, which might loosely be termed a social-environmental theme. While work on environmental indicators needs to proceed on all fronts, a few could be highlighted and presented in a way
that most people would understand, covering either aspects of or the entirety of: Eutrophication, Acidification, Toxic Contamination, Urban Quality, Built Heritage, Species Survival and Biodiversity, Depletion of Resources, Global ¯ Warming and.Ozone Depletion¯ These indicators would be accompanied by clear
explanations.
PART II. Social Indicators
Social indicators seek to go beyond traditional measures of development derived from the national accounts, first, by focusing on distribution of economic resources as well as on national aggregates or averages, and secondly by extending measurement to include non-economic aspects of social life such as health, literacy, social integration and crime. The task of selecting social indicators to achieve these purposes first requires a set of agreed definitions and priorities so that there is a common understanding of what the goals Of development are. Such consensus can be achieved only by negotiation and agreement within a shared framework of values and cultural tradit!ons, and is as much a political as a scientific process. As well as technical assessment of the feasibility, reliability or informativeness of particular social indicators, one should also expect political or ideological debate about their relevance to competing societal preferences or priorities.
Various approaches to social indicators have emerged within the social sciences since the 1960s and 1970s, some of them self-consciously concerned with fundamental questions about the nature of progress and development, others focused more on technical issues of conceptualisation and measurement within a taken-for-granted view of what development means. Examples are the concern with subjective social indicators in the 1970s (based on surveys of attitudes, perceptions and satisfaction levels among samples of individuals), the "capabilities" appi’oach advanced by Sen and his colleagues, the "basic needs" apl~roach and the Human Development Index (HDI) developed by the United Nations Development Programme. All have their .limitations as bases on which social indicators for Ireland might .be constructed. Some are difficult to operationalise (e.g., the capabilities approach), others were ¯devised with particular reference to poor countries (e.g., the basic needs approach), others wcre designed to provide global rankings of rich and poor countries rather than sensitive measures of social progress within richer countries (e.g., the HI)I), while others have problems of reliability and validity across time and place (e.g., subjective social indicators).
education, employment, quality of working life, free time, leisure, the distribution of income and wealth, housing and physical environment, social environment and pkzrsonal safety¯ The list is broadly applicable across developed countries, is reasonably compreheasiv9 and is generally feasible in measurement terms.
In building on the OECD list, questions remain about the social categories across which inequalities on the items on the list should be measured (region, social class, gender and generation are the most obvious options). The possibility of adding items to the list also needs to be considered. Should aspects of family structure be included, such as the marital breakdown rate or the rate of lone parenthood? What about crime’? Under the heading "social integration", the OECD list includes one indicator - suicide - but further candidates for consideration could include such things as drug addiction, or degree of neighbourliness.
The availability of data is a major immediate constraint in implementing the OECD list and in adding new items. On many items, existing data sources are adequate, while on others either no data exist or they are collected too infrequently to be of use for present purposes. A comprehensive set of social indicators would therefore require considerable additions to existing data sources.
Recommendations
Environmental Indicators
1. Some indicators for individual environmental themes can be readily produced, and a selection which is representative of the main themes should be presented for widespread public consumption¯ Detailed indicators would be contained in the envii-onmental data base. (Tables 4.1, 2.1 and Appendix V give preliminary lists, but a complete and regu!ar inventory of data availabilit3; and quality should be produced.)
2. Green national income .(with satellite accounts) and national sustainability indicators, are worthy of attention. Work abroad should be monitored.
3. Monetary valuation needs to be developed, since policy decisions implicitly use values. Use of non-monetary weights should proceed with care.
4. Co-ordination between the Environmental Protection Agency, the Central Statistics Office and other major providers and users of environmental information needs to be put on a firm basis.
Social indicators
,
determine selection. These mechanisms should have a substantial component of technical expertise (drawn from agencies such as the Central Statistics Office) but should also represent as wide a range of social and economic interests in Ireland as possible.
The OECD List of Social Indicators should be adopted as the starting point for a scheme of social indicators for Ireland.
Data
INTROD UCTION
The government parties are committed3 to
... working towards a new set of indicators of sustainable economic development which will take account of environmental and social factors. These iodicators will be used alongside the existing measures of economic activity such as GDP.
This commitment clearly rests on the belief that e.,dsting measures of economic activity such as Gross Domestic Product or national income are inadequate both from ,an environmental and a social point of view. This publication provides a preliminary review of the conceptual and methodological issues which arise in working towards a more adequate way of quantifying development and summarises the main approaches currently being developed in other countries and institutions. The aim is to set out the main options and to make suggestions as to the steps which might be followed in carrying out the commitment.
In working towards this aim, the first issue we had to consider was the relationship between environmental, and social indiczitors, both in general and in the particular context of the present review. The grouping together of environmental and social factors in the government’s policy statement could be taken to imply that these two sets of concerns could be treated together as different dimensions of a single underlying concept of sustainable development. Such an approach would envisage an integrated treatment of environmental and social indicators, aiming towards the attractive prospect of comprehensive quantitative measures of development which would simultaneously encapsulate environmental and social concerns, alongside those issues which are already incorporated into ordinary economic data and standard national accounts. However attractive the integrated approach might be, the reality is that environmental and social concerns about development hb, ve emerged from different institutional and intellectual
A government of Renewal (1994).
backgrounds, and have tended to be treated in some isolation from each otherl Each dimension hag proved to be difficult enough to quantify on its own: the task of bringing them together into a single integrated framework has hardly yet begun. This reality points to a segregated approach to the two strands, perhaps with a view to eventual integration but with no expectation that such integration is immediately at hand. The present publication therefore treats the environmental and social dimensions of development separately, each being dealt with in a more or less self-contained essay. The two essays are summaiised together in the ’General Summary which prefaces this volume, but.otherwise they stand apart:
The difference between the environmental and social strands of concern about conventional measures is exemplified in their relation to the notion of "sustainability", which features in the government commitment and in much of the analysis and rheto/ic of the relationship between economic gro~da and the environment.. At a sufficient level of generality, sustainability can be defined in a way.which encompasses environmental and social concems. One such definition is that a system is sustainable if it allows the well-being of future generations to be at least as high as that of the present generation. However, in practice the concept of ¯ sustainability can be much more readily applied to environmental issues, and a core concern for environmentalists has been that current patterns of economic activity are .running down the asset base at a rate which cannot be susXa)med. Sustainability in this sense is sometimes qualified as being "weak" or "strong". Under strong sustainability, some environmental assets are seen as ¯being essential, like the ozone layer, and not having any’.close substitutes. Under weak sustainability it is assumed that the items under consideration do ultimately have substitutes, so that the main focus will be on maintaining the aggregate stock of assets. The concept of sustamability as it relates to the environment will be discussed in more detail in Part 1, but it would not, in our view, be productive to try to apply any broader notion of "social sustainability" at this point.
Of the two essays which make up this volume, the first or PART I, dealing with environmental aspects (by Sue Scott) is the longer because of recent strongly voiced concerns about the current path of economic development The issue was . highlighted by the Brundtland Commission4 and by the Rio Earth Sumrmt5 which charged governments with adopting the concept of sustainable development. To do so we need to know whether and where there is, or is likely to be, unsustainable ¯ development. As it transpires, there are few calculated indicators which can
strictly inform us about the sustalnability of a thing or proeess,~and a lot of
’ World Commission on Environment. and Development (1987), Our Common Future, Oxford, New York.
information is a prerequisite to any assessment of sustainability. This informatiofi ¯ therefore becomes included in the umbrella term "sustainability indicator". It is
apparent that people often use this term to mean some measure of an asset or theme where sustainability is an issue, though the measure itself only vet3, indirectly throws light on whether use of the asset is sustainable. We should not be disturbed by this loose use of the term, though we need to be aware of more rigorous definitions, discussed later.
PART I comprises three chapters. Chapier 2 draws on experience elsewhere to outline the main methodologies and options available, distinguishing environmental indicators for .individual themes, Green national accounts, and national sustainability indicators. Chapter 3 describes the Irish situation as regards data and information structures for each of these categories. Chapter 4 suggests a list of themes and sets out recommendations on environmental indicators.
The second essay or PART II, by Brian Nolan and Tony Fahey, turns to social indicators, exploring what these indicators can add to conventional measures and seeking to learn from international experience about how best to improve the information base available for’ evaluation of Ireland’s socio-economie development.
The term "indicator" refers to some message which in a succinct way conveys information about an item of significance, or perhaps communicates a trend from a complicated ensemble of data. There seem to be two motivations for .producing such indicators. One is that the physical and social environments seem to miss out in the release of regular indicators, like releases on consumer prices, unemployment, GDP, house pricesand the like, or else they can be subject to unrepresentative media treatment. The other is that composite indicators have not emerged that draw together all the relevant social and environmental threads "to summarise the situation adequately. Both these aims can be criticised - whatever about regular release, there are firm slots in the media, which ensure regular. spotlighting of individual problems, and a new’ composite indicator would m turn suffer the criticisms of all composite indicators~ like GDP. The policy analyst who is trying to address a worsening situation highlighted by an indicator would immediately want to see how it was derived6;’the underlying data are therefore still the most crucial aspect. However the composite indicator might do the alerting. It might also give a sense of balance.~
E.g., the consultant to NESC (1975) who examined inflation in Ireland (Paper No. 10) started bychecking how the Consumer Price Index measured and weighted the components.
The actual benefits to be derived from the construction of indicators are not easy to assess. The many calls for indicators suggest that there is a demand on the part of policy makers and of the public. The case for social indicators lies in the inadequacy¯ of income measures as measures of welfare, because neither across countries nor over time can one assume that welfare is evolving in line with income ’per head. The case for environmental indicators lies additionally in ’the fact that
much of the environment is outside the market such that harms can accrue to third parties, unlike in the rest of the economy where the market largely ensures that payment and compensation occur. Consequently indicators for the environment are perhaps more necessary than for the ordinary economy where there is less hidden threat of unsustainability.
S. Scott
OPTIONS AND METHODOLOGIES
The government commitment quoted at the start of Chapter 1 raises t~vo especially interesting issues which one should aim to address. The first, the issue of "sustainability" has entered the popular domain quite forcibly and, though people may have but a vague idea of what it means, they would profess to be in favour of it. In Ireland, economic discussions of the early 1980s were largely concerned with the problem of sustainable economic development in the face of growing foreign debt, so the idea of sustainability has a familiar ring. It was a similar problem: we were running down our assets and it became clear that we were making things worse for the future if.we continued as we were. In one useful definition," a system is said to be sustainable if it allows the well-being of future generations to be a least as high as that of the present generation. There is evident concern that the current path of economic development, with its heavy use of the environment, is affecting the potential for future well-being.
Unsustainability implies that there is a limited supply of something, which is " being over-used. Indeed, a major and frequent cause of over-use can be underpricing - correct pricing or regulation may help to address the problem. However one must also be aware that the non-survival of some aspects of the environment may not be a deprivation to future generations. A flourishing smallpox virus, for example, is obviously not a candidate to be sustained (except in a laboratory), but what about, say, the architecture of the. 1930s? We are immediately confronted with the issue of the worth of.what is being maintained and the many calls on the resources that would be required to maintain it. Sustainability, by invoking the idea that the maintenance of something will bring future well-being, is implying that !t has a future worth, which is not always true. Because the item being maintained is frequently outside the market, its present worth, let alone its future worth, can be a subjective matter.
The second issue is "economic development". We know that trends in national income, or.national income per head, measured by GDP or NNP, are used as a barometer to represent a country’s economic development, though they are but
measures of market transactions. They are used to rank nations, to judge their economic performance and .determine international subsidies, dues, or quotas. These measures have always been recognised as wanting in several respects. The phrase "not by bread altne"- is a qualification of materialism that is ingrained in our culture, and though most individuals aspire to higher incomes, they would
include other things in this income. One proposed definitions of true income is that it indicates present and future economic well-being: "income " would be the measure you arrive at "not reducing your productive capacity", an idea which we recognise as embodying today’s notion of sustainability. Evidence of the inadequacy of the current measures of income9 and the increasing calls to incorporate the state of the environmentI° stem from the intensity and more noticeable results of human activity. These have effects which are only sometimes picked up in measured income, and then in limited and haphazard instances. For example, pollution causes illness and renders a person unable to work, or hurts tourism, which indirectly reduce measured income. However there needs to be a much more systematic approach.
The indicators which will now be described in turn are as follows: (a) environmental indicators for ifidividual themes, (b) green national income, which includes¯ the measurement of resource depletion, environmental deg!’adation and restoration (or so-called defensive) expenditure, and (c) national sustainability indicators. We used the term "spectrum" for the choice of indicators, which implies some sort of order. The ordering chosen here is, roughly speaking, ascending oi’der of aggregation or monetary measurement. The more an item is capable of being expressed in monetary terms, the more easily can there be aggregation without resort to other, possibly subjective, weights. Of course, monetary aggregation amounts to using money weights, which can also provoke
s Hicks (1946).
9 "Some have presented the extreme view that there has been no real economic growth at all in the US. economy over the recent past, as the apparent growth in measured product has been eaten away by an increasingly important set of negative growth elements manifested by a massive deterioration in our physical and social environment....more police, fire and other Protective services, or greater military hardware and personnel, or a larger fleet of garbage removal trucks clearly represents increased output ... but if these expanded flows of product do no more than simply maintain existing ’stocks’.of personal security, national security, and ecological purity, it is hard to see where economic welfare has been increased." FT. Juster in the.Forward to Nordhaus and Tobin (1972).
disagreement. Work on both forms of weights is progressing at a pace unthinkable a few years back, and while green-adjusted national income was much discussed in the last ten years and saw big strides in its development, it is indicators expressed in physical terms Which are now gaining more attention at official levels.
2.1 Environmental lndicators for lndividual Themes
Indicators for individual themes can be constructed at various levels of
refinement and can be expressed in physical terms. Not only can fairly simple indicators be very informative, but the basic dam. required for their construction are usually necessary in their own right. In addition they may form the fi~undation of future work on possibly more sophisticated indicators.
We shall look at four sets of such indicators currently being produced. The first is the Core Set of Environmental Indicators recently published by the OECD.
Secondly we shall describe similar indicators by Jesinghaus of Eurostat, which, though at an earlier stage of development, may form the basis of a system to which Ireland is likely to want to contribute and conform. Thirdly there are the
Indicators of Sustainable Development for Decision-Making Processes, by
Adriaanse, which we will later show to be incorporated in the Netherlands integrated environmental and economic accounts." Fourthly, we will look at some focused national indicators in which the idea of sustainability is more explicit but which still relate to individual themes. A feature that is common to all indicators is that their construction entails first deciding on which themes to cover and how they should be covered.
2.1.1.0ECD’s Core Set of Environmental Indicators
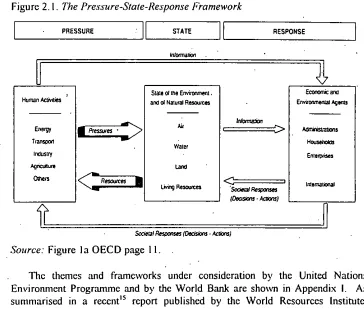
The OECD categorises indicators for each theme into three broad types, namely pressure, state and response. The distinctions, which by their nature are not always clearcut, are ilhistrated by OECD in Figure 2.1 below,
The Pressure-State-Response framework is widely used as a way of grouping ififormation on the environment. "Pressures", such as traffic density and waste emissions, are exerted by human activities on the environment. They change its quality and the stock of natural resources, for which the current situation or "state" can be described. In tile present context, the "response" is used only for societal (not ecosystem) response, through environmental, economic and sectoral policies. In fact there are many frameworks~2 for the organisation of statistics on the environment and, as with all such multidimensional topics, it is unlikely that the perfect framework can’ be found. The Pressure-State-Response framework13 has the advantage that it answers three simple questions: What is the state of the environment and its evolution? This is answered .by state indicators. Why is it
OfdeHaan and Keuning (1995). "
¯ changing’? This is ,answered by pressure indicators. What are we doing about it? This is answered by response indicators. The ultimate focus of interest is the state of the environment as this is what affects well-being. Pressures per se, unless related to the tolerances of the receiving medium, are not so informative. This is because emissions in some circumstances may have a negligible effect and in others the effect could be highly detrimental. However, it is to the pressures14 that policy is usually applied and in any case the pressures are often more easily measured. For example, the emission by Ireland of ozone-degrading gases can be estimated more simply than the present thickness of the ozone layer and its likely thinning as already-released gases have their effect.
Figure 2. I. The Pressure-State-Response Framework
I
PRESSURE II st,rE It
Stale ot the Envirorur~t, and d Natural Rec, ouces
Aia
Water
Land
Renc,Jces
Source: Figure la OECD page 11.
Tile themes and frameworks ’under consideration by the United Nations Environment Programme and by the World Bank are shown in Appendix I. As summarised in a recent~5 report published by the World Resources Institute, material and data to construct indicators are usually most available for pressure
,4
It appears thai Etlrostal concentrates more on pressure indices whereas the
European Environment Agency lays more emphasis on information relating to the state
of the environment. ~
indicators and sparsest for response indicators. Indeed the selection of response indicators could also be better focused: basing response indicators more closely on the policy instruments available to society could be mole informative. These policy instruments, which public authorities can avail of, mainly include:
- information and education to affect attitudes and bchaviour (indicators could
show, for example, trends in knowledge that there is a link between energy use and greenhouse gas release, or knowledge of where to deposit recyclables, CFC containers et cetera);
- economic instruments and correct incentives (e.g., applying the Polluter Pays
Principle in higher ta~xes on leaded petrol, charging for waste collection);
- regulation, including enforcement measures, and extent and results of
monitoring;
- direct government action (e.g., government construction of waste water
treatment plant).
Such information on response might be more relevant than "% of NNP spent on vaccination" or "protocol signatory".
The themes and framework chosen by OECD are as follows. The first nine can be classified as "sink-orientated", whereas the others are "source orientated".
Climate change Ozone layer depletion Eutrophication Acidification~6 Toxic contamination Urban environmental quality Biodiversity
Landscapes Waste
Water resources Forest resources Fish resources
Soil degradation (desertification and erosion)
General indicators (e.g., population growth or economy-wide environmental expenditure)
re-examine their capacity to assess and monitor the state of the environment and detect changing conditions and trends. They emphasise that indicators should be viewed as but one tool for evaluations, and need to be supplemented by other qualitative and scientific information in order to avoid misinterpretation. They also advise caution when making inter-country comparisons, though their aim is standardisation. Great variation in measurability between individual indicators is noted, some being immediately measurable, others need additional effort before they can be presented, and a third group will only be measurable in the long term, due to absence of data. So they have concentrated on the immediately measurable indicators. Furthermore the indicators are likely to change as knowledge and perception of environmental problems evolve. The varying relevance and different contexts, depending on the country, are emphasised.
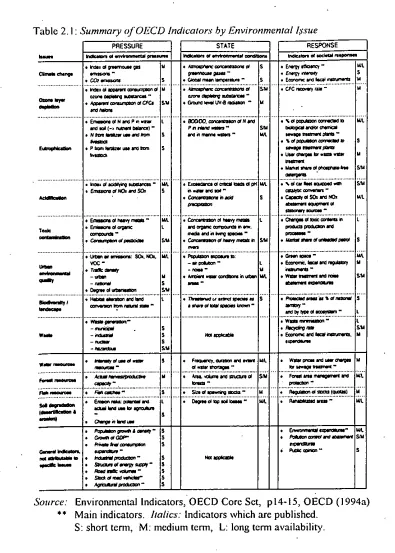
A sunmmry of OECD indicators by environmental issue is given in Table 2.1 below, with s~qnbols S, M, L to denote that the information is available in the short, medium and long term respectively. Main indicators are pointed out by a double asterisk. Indicators already available and published arc printed in italics.
’Information for many OECD countries is published in the document, including for Ireland in most cases. Information for Ireland is supplied (mainly by the Deparmaent of the Environment) in the form of time series as well as in formats which facilitate comparison between countries. It is usefully emphasised that individual countries will have different circumstances and therefore different tolerances. Each environmental issue is briefly.explained and the measurements are clarified, technical annexes giving more detail. Their category of "indicators of societal responses" would be incomplete without information on whether societies were making progress towards rectifying the undercharging of environmental damage - a major cause of environmental problems in the first place. In fact, the differential in tax rates on leaded versus unleaded petrol is illustrated, and water and waste water charges will also be listed in the medium term, which additions go some wayto addressing this criticism. The strength of the OECD approach is that the information is, or should be, readily available, as a result of monitoring processes and the like. It is also of such a fundamental nature that it is required in any case, for policy decisions at various levels and, importantly, owing to the
limited amount of weighting required, it is largely uncontentious.
Table 2. I : Summary of OECD Indicators by Environmental l,~’sue
STATE RESPONSE
Source." Environmental Indicators,’OECD Core Set, p14-15, oEcD (1994a) ** Main indicators. Italics." Indicators which are published.
Figure2.2: Example for lceland of Core Indicators in Environmental ¯ Performance Reviews (OECD 1994).
Air pollution
AtO~ugh tcelan(rs per capita c~umptJon of e~ezg’/is high and is higher g,,an 5aat ol any oO~er OECD counW, its unusually high propodJon of hydro and geothermal energy comfibutes substan~lly to mainla]nlng pollut~’~ at low levels. Total primary enelgy supply {TPES) per ur~ ol GOP in 1990 was 84 per cent above the OECD average and 69 per cent above the average I~- the other N~:SiC coun~e~. TPES,~er capita was 71 pet cent g~eater than ~he OECO average and 57 per ce~ hiQhet ¢k~n ~e average 1o~ other Noto~c ~. Tl~e Icelandlc au3~ties successfugy reduced o;J corwJmp~ through substJt~ of cenewabie resources. Elec~ ge~ra~¢~ is generated a]mosl exck~ely from hydropower and geothermal
l
n~y co~ltributes a high share of spac~ het, t~g.’~"~¢~m In ¢i#a¢*¢1,¯ Contextandsupplementary .~ ,~ ,.. ,=, ., ,.. t,
information ~..~ ,~ ... .., .. .. .~.
/
¯
Country.specific indicator~ anddata
Core indicator X
The implications O[ the~z ~ss~ ~ cedaJn po~utJo~ emi~s~3z~s for hLml~ hP.aJth a~d eco~ems ma~ ~ m~
~8 to the 8ss~mSatJ~e c~ ol the ern’korz’ne~ For ~, in spite or i~e shaq~ e~q~ms=o, in NOx e~is~ the)evel ol de~ is at ~east 5~,*ee ~es lower tha~ in any E~opean co,.~W. "R~s. the I~tan~ 8~o~es I’,ave d~a*,m spec~ atls~Jo~ to the need to co~k~w po~on ¢:x~*a~ns and ambient levels in impte~e~g intema~ctal ¢ommiCnents.
Naturally there are many otherbodies constructing environmental indicators of their own, for instance in Canada and the UK. It is interesting to scan their lists of themes and to note how they reflect the existence of special assets or problems in each region. This is a good feature foi- the selection of indicators to have.
2.112 Eurostat Physical Indicators: Pressure Indices
The issue of weigl~tmg systems is given considerable thought in Eurostat discussions of indicators (Jesinghaus, 1995). The three valid possibilities are described and total reliance on any particular one is not suggested, the three being monetisation, experts’ assessments and compliance with official/popular policy goals. Monetisation includes use of such methods as evaluating people’s willingness to pay or willingness to accept, and market prices, such as house price changes and travel cost approaches (as used for green national income). The criticism levelled against these methods is that they are dependent on income levels and on how well-informed people are. Also, for example, it is stated that individuals’ willingness to.accept yields systematically three times the value of willingness to pay. SecOndly, expert assessments are suited to where the issue is
technical, such as the relative importance of NOx versus SO2 to atmospheric quality. There can be reasonable agreement, even when the experts come from different sectors of society. The weights in the Pressure Indices would measure urgency or need for political intervention. The third weighting scheme, is public opinion polls, where the weights are based on the notion of coneem, "much concern", "little concern", etc.
The plan of action in the Pressure Indices Project, to be implemented in close collaboration with the national statistics offices, the European Environment Agency and other official data providers, consists of ten sub-projects for each of the following ten themes, chosen because they are considered to be problem areas.
Climate change Ozone layer depletion Loss of biodiversity Resource depletion Dissipation of toxies , Waste
Air pollution and acidification
Marine Environment and coastal zones Water pollution and water resources
Urban problems, noise and odours
ambitious hierarchical organisation of tasks is proposed for each problem area, With a specialised environmental institute co-ordinating work on each and co-operuting with partners in a national statistics office, a national environmental agency, a national environmental ministry, the European Environment Agency and its relevant topic centre, the section of the European Commission most relevant to the field and the European Joint Research Centre (ISPRA). Contributions from peer groups, groups of scientific advisers and the like will be soughtin a formal structure of work. To construct the pressure index for any given theme, use of weights which are acceptable to the scientific comnmnity and to the general public is proposed, via an Expert Topic Assessment System (or EXTASY as it is named) consisting of a group of experts which decides on weights.
The final output will be published as a Pressure Indices Hmadbook, with a chapter for each problem area and arrangements will be made for the annual calculation of pressure indices, basedon official data. The timescale envisaged for the project is two years, excluding the time for implementation of tasks by institutions providing data and by parties to agreement.
2. 1.3 Adriaanse’s Indicators for the Netherlands
During preparation in 1987 of the National Envirortmental Policy Plan (NEPP) it became clear .that some information mechanism was needed to assess the overall situation for the main environmental topics in the Plan and to help with the follow up later. Attention was given to considering, wl/o the users would be and what they would want. It was envisaged that the main users would be Members of Parlianlent and decision makers, so that the indicators should be policy-oriented and annual, and published with the government budget proposals. There was also concern that interrelations (between air, water and soil for cxample) should not be overlooked in policy, and that the policy process integrate
the fields: economy, energy, transport, agriculture and the like. The themes were chosen to be manageable segnients as follows:
I change of climate "
-2 acidification of the environment 3 eutrophication of the environment 4 dispersion of toxic ~;ubstances 5 disposal of toxic waste
¯ 6 disturbance of local environments 7 dehydration of soils
8 squandering of resources
The main economic sectors which were seen as target groups of environmental policy were agriculture, the transport sector, industry, the energy sector, refineries, the waste removal sector, the construction industry, consumers and the retail trade.
differ. Furthermore, given thatin the Plan, policy targets were mandated to act as norms, it was deemed that indicators be developed which would enable an evaluation in relation to the norms.
Indicators were distinguished under the three headings we saw before, which Adriaanse (1996) describes as:
Pressure or stress on the environment. These would cover certain flows, stich as emissions, materials depletion, and interventions such as infrastructural activities.
State or quality of the environment, probably at a point in time.
Response in terms of the quality of the environment to measures taken by human action to improve the environment.
It is noted that "response" here is not just societal response, as in OECD’s indicators. There would be a relat!onship between a reduction in pressure and response, .after a time lag, though in areas like ozone depletion the lag may be decades and the effect of one country undiscemible. The success of government policy on ozone would in fact need to be judged by the decline, or otherwise, in the pressure index of emissions.
Important steps in the construction of each indicator are, first, the selection of the main contributing compounds. Next, the evaluation unit in which the compound xvill be measured has to be decided. The choice will often comprise emissions, depositions or effects. Thirdly, the compounds need to be aggregated to give one final indicator for each theme. Within each theme, weights are required to transform emissions measured in physical units into contributions in "theme equivalents", based on available scientific evidence.
The contribution of each economic sector to each theme was also calculated. In most cases, however, the sector would tend to affect about three themes mainly. ¯
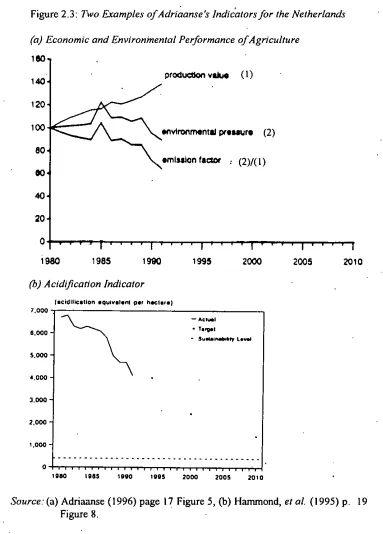
The weight for each theme was based on the distance-to-target principle, thereby making the validity of the sector’s indicator dependent on the validity of the targets set for each theme. Some people~8 might hesitate to use this approach on the grounds that targets should not be an input to the evaluation process and should perhaps be shown separately as in Figure 2.3(b). There are two ways to set targets which are considered feasible. One is to set the target at a "no change" level, which in some cases would be akin to the principle of strong sustainability. The second is simply the target set by politicians, which, of course, could be subject to the usual influences. Further weighting is undertaken to obtain, after scaling, an overall environmental pressure index for the sector. An emission factor can also be derived from simply dividing the environmental pressure by the sector’s output, such that it indicates the trend of environmental pressure per unit of economic output.
The results are communicated in numbers as well as in graphs. The first part of the graph below, Figure 2.3(a), shows time series for the agriculture sector of economic performance along with environmental performance. We will see that the annual volume changes in each sector’s contribution to each theme will be incorporated in Table 2.7, in the section below on integrated accounts. The system ¯ could probably’be expanded to include some social indicators, in like manner. The system does not in fact tell us how serious is. the damage, or the relative seriousness of different aspects.
However, for some themes, to the extent that the scientific issues have been settled, it is possible to construct useful indicators. Figure 2.3(b) shows an indicator of acidification inthe Netherlands, in which the three main acidic substances, sulphur dioxide, nitrogen oxides and ammonia are converted into acidification equivalents per hectare per ),ear. The targets and "sustainability level" are also illustrated on the chart. Different countries will have different levels of vulnerability with regard’ to acidification.¯ For these indicators to be accepted it is important that the weights or conversion factors be uncontentious and that local or national levels of vulnerability be agreed.
2.1.4 Other Indicators for Individual Themes
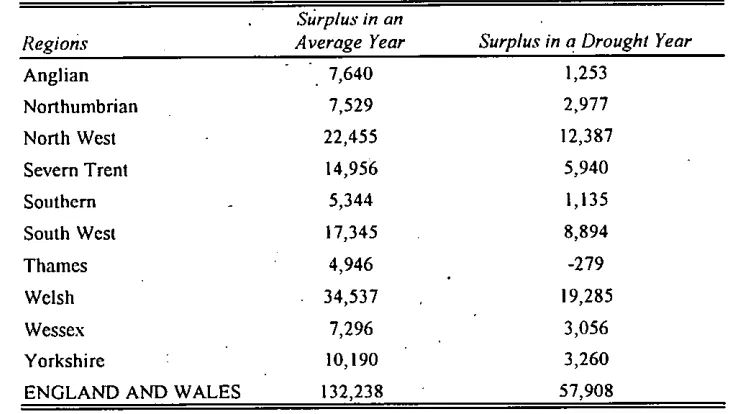
Other indicators would tend to "be constructed for specific themes, such as fisherics, wetlands and the like. It !s especially appropriate that countries work on these where an asset does not have close substitutes, that is, where strong sustainability might apply. An example will be given for water, by Pearee (1993). The quantity of Water that" is available for use in any period is equal to precipitation minus evapotranspiration (this remainder is called effective runoff), plus any stocks of water he d. on the surface or underground. In the absence of international trade in water, the sustainability rule that we should not reduce stocks becomes: .water demand should be met out of effective runoff only. It is sustainable in the sense that it does "not rely on any finite stocks for support. Figures can be compiled which take account of the annual resource input each year and the annual net demand, giving average surplus for an average ),.ear and for a drought ),ear, as shown in Table 2.2 below.
Figure 2.3: Two Examples of Adriaanse’s Indicators for the Netherlands
(a) Economic and Environmental Performance of Agriculture
lan produc~m v~ (1)
120
100- envtmamenta IXOIOIJtI) (2)
80-~omlsltonflcto¢ : (2)/(1) O0,
40-
20-0 ... i ....
I .... I ’’ ’"rl .... I ’ i 980 1985 19~0 1995 2000 2005
, ¯ , |
2010
Source.’(a) Adriaanse (1996) page 17 Figure 5, (b) Hammond, et al. (1995) p. 19
Table 2.2: Regional Water Resources and Demands in the UK in 1990 t341/day) Surplus in an
Regions Average Year Surplus in q Drought Year
Anglian . 7,640 1,253
Northumbrian 7,529 2,977
North West 22,455 12,387
Severn Trent 14,956 5,940
Southern 5,344 I, 135
South West 17,345 8,894
Thames 4,946 -279
Welsh 34,537 19,285
Wessex 7,296 3,056
Yorkshire : 10,190 3,260
ENGLAND AND WALES 132,238 57,908
Source: Derived from Pearce (1993).
This example of focused indicators for themes of interest illustrates how flexibly the idea of sustainability can be interpreted. The use of water resources in the Thames region may not be sustainable. In general terms, over-abstraction does not just reduce future supply, but can also cause losses of amenity, wildlife habitat, recreational possibilities and the like. However substitution of water supplies can take place up to an extent, by importing from other regions which have a surplus, again assuming that the inhabitants of the importing region are willing to pay the infrastructural and other costs. In fact in some cases one suspects that Users might not be willing to pay.
Turning to the quality aspect of water, the sustainability rule that current users should not impose costs on future users would imply that water quality should be non-declining over time.(Dubourg, 1992). Therefore where effluent levels exceed critical loads causing declining quality, water quality needs to be improved. From the indicators (not shown here) which show reductions in quality in the UK, it is considered that the quality dimension of the water stock is hardly being used in a sustainable manner in the sense that quality decline is a reduction of the asset. Whether this warrants action is a different matter, but at least the situation is brought to light.
indicator would need to measure to what extent a portion of the net price Or "rent". was being reinvested on fuel replacement assets, such as renewable energy. This amount would be analogous to the "user cost" discussed under "depletion" in the next section on green national income, but instead of being like a mere depreciation measure, it would be earmarked for spending on renewables,j9 This does not mean that the extraction agency has to invest in renewables, but that this matching investment is occurring within the state.. In this way the strong sustamability assumption is applied, that energy assets per se must be maintained.
2. 2 Green National Income
Measurement of green national income, that is income which is adjusted to take environmental considerations into account, is still in the early stages. In fact, measurement of traditional national income2° has only recently celebrated its 50th birthday. The USA produced the first National Accounts in 1942 and lrdand produced its first National Accounts m 1946 (Stationery Office). The Central Statistics Office publishes the official accounts. The ESRI and the Central Bank publish quarterly forecasts, which are widely reported. These figures in fact merely measure the level of economic activity, which in turn is only indirectly related to human welfare: They are recognised as being a weak measure of welfare, but they exist and they are fairly comparable across countries. The method of compiling the National Accounts currently follows the procedures spelt out by the UN in their manual of 1968, which was updated in 1993.
,9 The question of whether the investment is worthwhile ought to be posed, though it is not posed in the case of investment in produced capital.
2, National income is officially called Net National Product, or NNP, at factor cost¯ Other frequently reported traditional measures are Gross National Product (denoted GNP and in Ireland about 14 per eenl higher than NNP) and Gross lJomestic Product . (denoted GDP and about 32 per eem higher than NNP). NNP is equal to GNP less depreciation of assets. In turn, GNP equals GDP less net factor flows to the rest of the world, such as profit outflows and national debtinterest. The table below for 1993 (in £ billion) illustrates the relationships between various measures of Product at factor cost. The figures are reported in Tables 1 and 2 of National Income and Expenditure 1994, an annual publication of the Central Statistics Office.
Gross
~
Net
Domestic GDP: 29.0 3.1 NDP: 25.9
less factor flows 4.0 ’4.0
National GNP: 25.0 3.1 NNP: 21.9
It is worth noting that there is a consistent conceptual framework for national income, beyond the accounting framework in which the measurement sits. The aim of policy should be to maximise the well-being of society, not just over the next few years but over an infinite timespan. When theoretical’ models of the economy are constructed to do this for a simple economy and without consideration of environmental externalities and other important welfare aspects,
the results show that NNP is indeed what a planner would choose to mzLximise.2~ If the goal is to confer the most well-being to society over the long term, you should aim to maximise consumption plus investment, that is NNP.
NNP only has an adjustment for depreciation of produced capital. The next step therefore is to adjust the framework,:~ to take account of the environment. There are three major flaws in the traditional measure of national income and these wouldneed tO be addressed in order to create green measures. These flaws are as follows:
(i) Traditional National Income ignores the depletion of natural assets.
Produced assets, on the other hand, such as buildings and equipment are "used up" over their lifetimes and their depreciation is entered as a minus figure in the calculation of National Income. Natural resource assets.are ¯ not so valued: "A country could exhaust its mineral resources, cut down its forests, erode its soils, pollute its aquifers, and hunt¯ its wildlife and fisheries to extinction without affecting i:ts measured national in~:ome", to . quote Repetto’s famous statement (1992). He adds that "It is a bitter irony
that the Iow-ineome countries most dependent on natui-al resources for employment, revenues, and foreign exchange earnings are instructed to use a system for national accounting and macroeeonomic analysis that almost completely ignores their principal assets." So this loss of capital, as natural resources are used beyond their capacity to recover, probably as a
*~ Weitzman (1976) showed that net national product is equal to that constant level of " product the present value of which equals the present value of consumption along an efficient path for a competitive economy.
;: The theoretical models are called Optimal Control Models. An example, which does incorporate environmental externalities, might be to maximise ~o U(C,B)c’"dt, that is, the present value of utility, which is a function of traditional consumption, C, and the benefits of the elivironment, B, subject to technical economic and environmental constraints, to deal with cumulative effects of pollution, etc. The resulting measure of economic welfare consists of the traditional sum of consumption and investment, less emissions valued at marginal social costs plus the level of environmental services valued by consnmers. It is the definitions of the correct and consistent specifications of how
result of being under-priced, is not recorded in national income and invesmaent accounts.
(ii) Traditional National Income ignores the negative impact on welfare of environmental damage which has not been put right. This damage can be
very difficult to measure. In some causes one would need to avoid double counting if the damage has been remedied. The deterioration in river quality owing to agricultural effluent, or to take a less tangible example, the replacement of moss, heather and lichen by mud on the hills in the West of Ireland as a result of overgrazing by sheep: these would not feature as minuses in the traditional national accounts. We know, however, that people are concerned about them. In a recent survey, a majority said that they were "very concerned" about the general appearance of their area, and water pollution was the highest first-mentioned and second-mentioned problems, of concern (Murphy, et al., 1994). Environmental damage also has the potential for reducing future welfare, by reducing economic activity through its asset degi’adation effect, just described.
(iii) Traditional National Income could be overstated by final expenditures by households and Governments which merely remedy the environmental damage of the production process. These so-called "defensive" expenditures should perhaps not be counted as output, but simply as production costs, like repairing machinery or buying insurance cover. At present if, say, government or households have to spend money on countering the asthma suffered by people, livmg alongside a lorry route, this expenditure on health adds to National Income, while in fact the expenditure has arguably merely restored the inhabitants to their original level of well-being. National Income perhaps should not rise. The misallocation to output rather lhan to costs would not arise if the enterprise or producer carried out the remedial work, incurring current costs as part of the production process.~ That Said, the producer would have to raise the value of output to cover the extra costs, so that the net effect on measured national income ’could .be mamaterial.. Another argument~4 proposes that if we want our green national income to
represent welfare, it should include a measure of the value of the quality of, or of the services provided by, the environment, net of defensive expenditures by households and government. If one knew; somehow, that ~ This has not always occurred: we need only remind ourselves of unrehabilitated mine sites - which owe something to the fact that the tax cede for mining does not treat end-of-life remedial work like other costs for tax purposes - an example of faulty incentives. Regulations on rehabilitation are in place now.
the welfare derived from the environment had not changed,, it might be theoretically feasible merely to subtract defensive expenditures. In any event, measurement of defensive expenditures can sometimes be difficult to isolate, if they form a part of the upgraded features in some process, say.
We know that these are the problems. The question, which is not yet fully answered, is how should one make the alterations which are in fact correct.
Returning to the optimising models, it is but a small step to add environmental constraints into the traditional framework and work on this is proceeding. The incorporation of resource depletion,2~ that is the theoretical approach and practicalities for adjusting the national accounts for the discovery, depletion and growth of commercial natural resources is considered to be settled, though there are some outstanding issues discussed below. With. the high dependence of developing economies on natural resources, the adjustment will be noticeable there. The incorporation of environmental degradation is also advancing, in particular in relation to pollution with cumulative effects, multiple pollutants and abatement costs.:~ The importance of these exercises is that they indicate the way that valuation should be aimed at, when it comes to the practical task.
Having reported on the substance of the theoretical developments, we can summarise the practical guidelines emanating from the UN’s recent work. The UN was ~nvolved with the early National Accounts guidelines, the handbook used until recently being dated 1968. Along with’ the Commission of the. European . Communities, the International Monetary Fund, the Organisation for Economic Co-operation and Development and the World Bank, the UN have published System of National Accounts 1993 (or SNA 1993). In the comprehensive list of suggestions are recommendations for the’inclusion of, for example, degradation of land, water resources and other natural assets from economic activit,j, including damage to land from improper agricultural practices, etc., which may deal with some problems pertinent to Ireland’s case. The general thrust of the recommendations is, however, that any new approaches should be ~incorporated, not into the existing core System Of National Accounts, as the loss of continuity would be a distinct loss, but as "satellite accounts".
2.2.1 Satellite Accounts Integrated into the National Accounts Framework
The next few pages give a simplified overview of the approach~7 to satellite accounts which is suggested in System of National Accounts 1993. The aim of this section is to provide a summary of what "integration in the national accounts" means to readers who do not wish to be distracted by detail, but at the same time
For example, by Hamilton (1994) and the World Bank (1995). By Hamilton and Atkinson (1995).
wish to be conversant with the basic procedures and with the calculation of green national income. Without losing the thread of the discussion, however, readers can skip to sub-section 2.2.2 which follows, with examples of integrated national accounts, and then proceed to the discussion of national sustainability indicators. It is worth noting that a link between green national income and national sustainability indicators is that they both incorporate a measure of depletion and degradation of natural assets. While green national income is a measure of well-being, national sustamability indicators show the rise or fall in assets. A decline in assets will reduce future well-being.
The authors of SNA 1993 state that their work should be considered as state of the art, which may evolve as a result of continuing discussions. Being satellites, the environmental accounts can be separate from the SNA, but they are integrated in so far as they fit logic~ly within the SNA framework and, in particular, add to stocks and flows arising from the interaction between the economy and the environment.
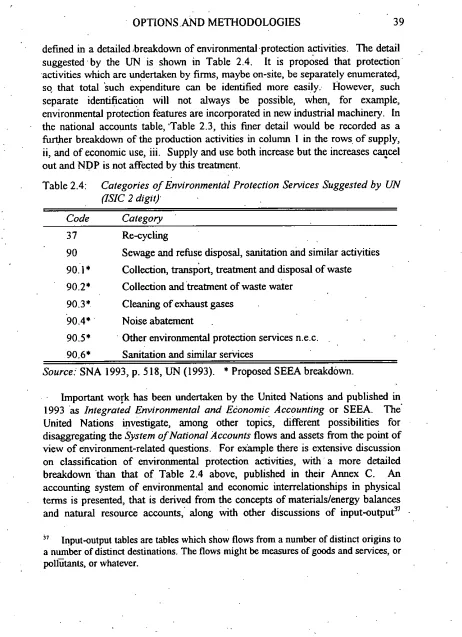
Table 2.3 below is reproduced from SNA 1993. The shaded parts of the table are meant to represent the traditional national accounts, though in fact the first row and last three rows are absent from Ireland’s national accounts. We can orient ourselves by noting that existing Net Domestic Product is in the cell marked NDP at the start of row v. Along the remainder of that row are the components of NDP, when it is measured by the expenditure method, that is exports minus imports plus final consumption (by consumers and by government) and net investment.~ Also, part of existing SNA, is row i under the heading Assets, which records the year’s opening stock of Produced or man-made and of Non-produced or natural assets (minerals, cultivated forests etc.).:9 Row ii gives total supply, namely production P and imports M. Row iii shows how supply is used: as intermediate consumption Ci, for further production, as exports X, final consumption C or gross investment Ig. Turning to the columns of the existing SNA, the first column shows how product P is the sum of intermediate consumption Ci, depreciation or the consumption of fixed produced capital CFC, and value added which is NDP. Note
2s As well as being recorded in the Central Statistics Office’s National lncome and E.xpenditure, it is basically this row which forms a central part of the forecasts regularly published in the Central Bank Bulletin and in the Quarterly Economic Commentary of The Economic and Social Research Institute.