Open access self-archiving:
An author study
May 2005
Alma Swan and Sheridan Brown
Key Perspectives Limited
48 Old Coach Road, Playing Place, TRURO, Cornwall, TR3 6ET, UK (Registered Office)
Tel. +44 (0)1392 879702
CONTENTS
Executive summary
1. Introduction 1
2. The respondents 7
3. Open access journals 10
4. The use of research information 13
4.1 Ease of access to work-related information 13 4.2 Age of articles most commonly used 13 4.3 Respondents’ publishing activities 17 4.3.1 Number of articles published 17 4.3.2 Respondents’ citation records 20
4.3.3 Publishing objectives 23
4.4 Searching for information 23
4.4.1 Research articles in closed archives 24 4.4.2 Research articles in open archives 24
5. Self-archiving 26
5.1 Self-archiving experience 26
5.1.1 The level of self-archiving activity 26 5.1.2 Length of experience of self-archiving 38 5.2 Awareness of self-archiving as a means to providing
open access 43
5.3 Motivation issues 49
5.4 The mechanics of self-archiving 51 5.4.1 Who has actually done the depositing? 51 5.4.2 How difficult is it to self-archive? 51 5.4.3 How long does it take to self-archive? 53 5.4.4 Preservation of archived articles 55
5.4.5 Copyright 56
5.4.6 Digital objects being deposited in open archives 57
5.4.7 Mandating self-archiving? 62
6. Discussion 69
Appendix 1: Reasons for publishing in open access journals, by
subject area (table) 77
Appendix 2: Reasons for publishing in open access journals, by
subject area (verbatim responses) 79
Appendix 3: Reasons for not publishing in open access journals, by
subject area (table) 83
Appendix 4: Reasons for not publishing in open access journals, by
subject area (verbatim responses) 86
Appendix 5: Ease of access to research articles needed for work, by
subject area 93
Appendix 6: Reasons for publishing research results (verbatim responses) 94 Appendix 7: Use of closed archives: results broken down by subject area 97
Tables
1. Breakdown of invitations sent out using c25,000 email addresses
supplied by ISI 7
2. Respondents by geographical area 8
3. Respondents by subject area 8
4. Reasons for publishing in open access journals 10 5. Reasons for not publishing in open access journals 12 6. How long ago most of the articles needed by respondents for their
work was published 14
7. Age of the most commonly used and cited articles by subject area
of respondents 14
8. Number of articles published each year, by subject area 17 9. Respondents’ average citation count per article, by subject area 20 10. Scholars’ reasons for publishing their work 23 11. How users search for articles in closed archives 24 12. How users search for articles in open access archives 25 13. Patterns of self-archived open access provision by researchers 26 14. Self-archiving activities by subject area of respondents 27 15. Patterns of self-archiving by respondent sub-populations 31 16. Comparison of earlier and present surveys with respect to
self-archiving patterns 31
17. Individual acts of self-archiving of different types by each
respondent population 33
18. Self-archiving activities by respondents publishing varying
numbers of papers per year 34
21. Awareness of self-archiving as a means to providing open access:
results by subject area 43
22. Awareness of self-archiving as a means to providing open access:
results by geographical origin of respondents 46 23. Original source of information on self-archiving 48 24. Original source of motivation for self-archiving 50 25. Sources of information on self-archiving used by people who were
self-motivated to self-archive, or who were motivated by the
citation advantage of self-archiving 51
26. Authors’ experiences with respect to copyright on their articles 57 27. Digital objects deposited by self-archivers 58 28. Types of object self-archived, by subject area 60 29. Compliance with an employer or funder mandate to self-archive 63 30. Compliance with an employer or funder mandate to self-archive,
by subject area 64
31. Compliance with an employer or funder mandate to self-archive,
by geographical area of respondents 66
Figures
1. Age of the most commonly used and cited articles by subject area
of respondents (clustered column chart) 15 2. Age of the most commonly used and cited articles by subject area
of respondents (stacked column chart) 16 3. Number of articles published each year by subject area
(clustered column chart) 18
4. Number of articles published each year by subject area
(stacked column chart) 19
5. Respondents’ average citation count per article by subject area
(clustered column chart) 21
6. Respondents’ average citation count per article by subject area)
stacked column chart) 22
7. Self-archiving activity level by subject area (clustered column chart) 28 8. Self-archiving activity level by subject area (stacked column chart) 29 9. Comparison of earlier and present surveys with respect to self-
archiving patterns 32
10. Self-archiving activities by respondents publishing varying
numbers of papers per year (clustered column chart) 35 11. Self-archiving activities by respondents publishing varying
numbers of papers per year: data expressed by activity
(clustered column chart) 37
13. Self-archiving activities by respondents publishing varying numbers of papers per year: data expressed by activity
(stacked column chart) 38
14. Length of time for which researchers have been self-archiving 39 15. Length of self-archiving experience in different subject areas
(clustered column chart) 41
16. Length of self-archiving experience in different subject areas
(stacked column chart) 42
17. Awareness of self-archiving as a means to providing open access:
results by subject area (clustered column chart) 44 18. Awareness of self-archiving as a means to providing open access:
results by subject area (stacked column chart) 45 19. Awareness of self-archiving as a means to providing open access:
results by geographical area of respondents (clustered column
chart) 47
20. Original source of information on self-archiving 49 21. Original source of motivation for self-archiving 50 22. Ease of self-archiving an article for the first time (pie chart) 52 23. Ease of self-archiving subsequent articles (pie chart) 52 24. Time taken to self-archive the first article (pie chart) 53 25. Time taken to self-archive subsequent articles (pie chart) 54 26. Ease of self-archiving articles (bar chart) 54 27. Time taken to self-archive articles (bar chart) 55 28. Authors’ expectations on the period of preservation of self-
archived articles 56
29. Digital objects deposited by self-archivers 58 30. Compliance with an employer or funder mandate to self-archive 63 31. Compliance with an employer or funder mandate to self-archive ,
by subject area (clustered column chart) 65 32. Compliance with an employer or funder mandate to self-archive ,
by geographical origin of respondents (clustered column chart) 67 33. Compliance with an employer or funder mandate to self-archive ,
EXECUTIVE SUMMARY
This, our second author study on open access, was carried out to determine the current state of play with respect to author self-archiving behaviour. The survey was carried out during the last quarter of 2004. There were 1296 respondents. The survey also briefly explored author experiences and opinions on publishing in open access journals to follow up our previous study on this topic for JISC and the Open Society Institute. Many of the findings reported here match those of that previous study. For example, the main reasons for authors publishing their work in open access journals are the principle of free access for all and their perceptions that these journals reach larger audiences, publish more rapidly and are more prestigious that the toll-access (subscription-based) journals that they have traditionally published in. The principal reasons why authors have not published in open access journals are that they are unfamiliar with any in their field and that they cannot identify a suitable one in which to publish their work. These reasons, and their rank order, exactly match the findings from our survey that was specifically on open access publishing last year.
The purpose of this present study, however, was to move the focus onto self-archiving, the alternative means of providing open access to scholarly journal articles. Almost half (49%) of the respondent population have self-archived at least one article during the last three years in at least one of the three possible ways — by placing a copy of an article in an institutional (or departmental) repository, in a subject-based repository, or on a personal or institutional website. More people (27%) have so far opted for the last method — putting a copy on a website — than have used institutional (20%) or subject-based (12%) repositories, though the main growth in self-archiving activity over the last year has been in these latter two more structured, systematic methods for providing open access. Use of institutional repositories for this purpose has doubled and usage has increased by almost 60% for subject-based repositories.
Postprints (peer-reviewed articles) are deposited more frequently than preprints (articles prior to peer review) except in the longstanding self-archiving
communities of physics and computer science. There are some differences
between subject disciplines with respect to the level of self-archiving activity and the location of deposit (website, institutional or subject-based repositories). Self-archiving activity is greatest amongst the most prolific authors, that is, those who publish the largest number of papers.
of the total author population (71% of the remaining 51%), has not yet been appraised of this way of providing open access.
Authors have frequently expressed reluctance to self-archive because of the perceived time required and possible technical difficulties in carrying out this activity. The findings here show that 20% of authors found some degree of difficulty with the first act of depositing an article in a repository, but that this dropped to 9% for subsequent depositions. Similarly, 23% of authors took more than an hour to deposit their first article in a repository, but only 13% took this long subsequently, with most taking a few minutes. Another author worry regarding self-archiving is the danger of infringing agreed copyright agreements with publishers. Only 10% of authors currently know of the SHERPA/RoMEO list of publisher permissions policies with respect to self-archiving, where clear guidance as to what a publisher permits is provided. Where permission is
understood by the author to be required, it seems it is being sought (this accounts for around 17% of self-archiving cases); where it is not known if permission is required, authors are not seeking it and are self-archiving without it.
Communicating their results to peers remains the primary reason for scholars publishing their work; in other words, they publish to have an impact on their field. Nonetheless, more than half still do not know what the citation rate is for their most recent articles. Almost all (98%) of authors use some form of
bibliographic service to locate articles of interest in closed archives such as
publisher websites, but only a much smaller proportion of people (up to 30%) are yet using the specialised OAI search engines to navigate the open access
repositories. Nevertheless, at the time of this survey, 72% of authors were using Google to search the web for scholarly articles: the subsequent arrival of
GoogleScholar, which indexes the content of open access repositories as well as general websites, and thus retrieves formally-archived open access material, can be expected have a bearing on the level to which open access archives are
searched in future and consequently on the eventual impact of articles deposited therein.
The vast majority of authors (81%) would willingly comply with a mandate from their employer or research funder to deposit copies of their articles in an
institutional or subject-based repository. A further 13% would comply reluctantly; 5% would not comply with such a mandate.
Alma Swan
Key Perspectives Ltd Truro, UK
1. INTRODUCTION
Twelve months ago we at Key Perspectives Ltd completed and reported on a study of authors who had published their work in open access journals,
compared and contrasted with authors who had not done this1,2. The work was
commissioned and funded by the Joint Information Systems Committee (JISC) in the UK and the Open Society Institute. Having thus learned about authors’ experience of open access publishing, we embarked upon this current study of the alternative means to providing open access — by authors archiving copies of their articles in open access archives or repositories. This process is usually referred to as ‘self-archiving’.
The practice of self-archiving has its roots in the field of computer sciences, where researchers were depositing results in ftp archives some decades ago and, later, on websites. A preprint culture — that is, the distribution of drafts of research articles before they have been peer reviewed to colleagues around the world, to establish ownership of the piece of research, to move the subject along, and to invite critical commentary before final revision and submission of the articles to learned journals — had been in place for many years in print form in the computer science community, and as the digital age arrived the practice simply migrated from paper to electronic form. Today, there are more articles – preprint and postprint (peer-reviewed papers) - freely available through self-archiving in computer science than in any other subject. The computer science ‘online library’, Citeseer3, currently has almost 723,000 articles that have been
harvested from distributed sites around the world (websites, ftp archives) where authors have deposited their work. Not only does this indicate the size of the corpus of computer science research available on open access, but it clearly demonstrates the success of this mechanism (harvesting from distributed sites) for creating a subject-based open access archive.
There is another mechanism for creating a subject-based archive and that is for authors to deposit their work directly into a centralised repository. In 1991, the first centralised archive, for the high-energy physics community, was established at the Los Alamos National Laboratory. It is called arXiv4 and today this houses
some 300,000 documents, with around 42,000 being added each year. Its main areas of coverage are high energy physics, condensed matter physics and astrophysics: substantial numbers of articles in computer science and
by arXiv to be available to anyone who wished to read them, even if their own institution could not afford to purchase the journals in which they were
published. [On a point of terminology, the collective term for an electronic version of an article in draft (preprint) or final, peer-reviewed (postprint) form self-archived by the author is an ‘e-print’].
That this practice could be spread to the rest of the scholarly community, freeing up the whole research literature from what he termed ‘toll-access’, that is,
accessible only to those whose library could purchase the journals, was first mooted by Stevan Harnad in 19955,6. Harnad has argued this case ever since,
refining the model and rebutting6 the arguments against the notion, which come
not only from publishers, understandably nervous at what they see as a threat to their businesses, but also from the scholarly community itself — from researchers and librarians, both of whom are stakeholders in the developments in scholarly communications7. Their concerns have been debated extensively in public fora
over the last decade (and continue to be), including the online American Scientist Open Access Forum set up and moderated by Harnad since 1998, the longest-running of all the open access discussion lists8.
It is useful to lay out here the elements of this debate and the concerns that exercise the various parties. It should be noted that the focus of this present study is self-archiving, not open access publishing (in open access journals), which was extensively covered and discussed in our foregoing study1,2. The
discussion here, therefore, concentrates on the issues around self-archiving that form the foci of resistance to the practice and which need to be overcome by proponents of open access if the whole research literature is to be ‘made free’. The first discussion point is the definition of what self-archiving is and what it is not. It is not an alternative to publishing in learned journals, but an adjunct, a complementary activity where an author publishes his or her article in whatever journal s/he chooses and then simply self-archives a copy. In practice, this means depositing the file, which is usually the author’s final version of the article after peer review has been completed, in an open access archive or repository. There are two main types of such archives, which we will come to shortly. The articles are tagged in these archives as peer-reviewed postprints or as preprint drafts, so it is possible clearly to distinguish the two.
of a fully peer-reviewed article whose destiny was to be published in the traditional way in a conventional, quality-controlled journal. It has therefore been peer-reviewed in the usual way. Postprints are not some kind of
self-published, second-rate alternative to conventional journal articles: they are those articles.
Authors have often cited the issue of copyright as a major stumbling block to self-archiving. They are anxious that, having signed over copyright to the publisher of the journal in which their article appears they will be contravening the agreement if they self-archive the article. To be sure, if they self-archive the publisher’s own file (the PDF file supplied by the publisher to the author and containing the final formatting and layout assigned by the publisher) without permission, then this would in almost all cases be in contravention of copyright, if that resides with the publisher. The publisher has not copyrighted the author’s final version, however, and in the vast majority of cases (over 90% is the latest estimate9,10) the publisher expressly permits an author to self-archive their own
final draft — the version that was finally submitted to the publisher after peer-review revisions and recommendations have been incorporated.
The other main issue that is raised by authors1,2 and, sometimes, by librarians, is
how self-archiving might disrupt the present scholarly publishing model. Naturally, it is the perceived vulnerability of the journals published by learned societies, rather more than those of commercial publishers, that concerns authors. In this respect, it is worth examining what has happened to learned societies that have already had experience in this arena, those publishing in the areas covered by arXiv, alongside which they have had to live since 1991. It has already been said here that arXiv receives around 42,000 deposits per year. The ISI (Institute for Scientific Information) Science Citation Index covers around 420 physics journals, and to give a measure of the total volume of physics research, in 2003 these journals published a total of 116,721 articles: arXiv thus contains a
substantial proportion (approximately one third) of the total physics research output and in the specialist areas mentioned earlier — condensed matter, astrophysics and high energy physics — the coverage of arXiv is pretty well complete.
In a separate exercise to this present study, we asked the American Physical Society (APS) and the Institute of Physics Publishing Ltd (IOPP) what their experiences have been over the 14 years that arXiv has been in existence. We asked how many subscriptions have been lost as a result of arXiv. Both societies said they could not identify any losses of subscriptions for this reason.
to their business (rather the opposite, in fact) and this is underlined by the fact that the APS helped establish an arXiv mirror site at the Brookhaven National Laboratory – hardly the action of a society with its back to the wall because of that repository. Now it is true that there are only a couple of experiments of this sort carried out so far (physics and computer science), where publishers have to co-exist with a successful open access archive, and so there is always the
possibility that there is something of a ‘special case’ about this example. Quite what might make it such a special case has never been adequately argued, but it is a finite possibility. Nevertheless, the evidence there is to hand points to the likelihood that the peaceful — and perhaps mutually beneficial — co-existence of traditional journals and open access archives is entirely possible; in biological terms, mutualism, rather than parasitism or symbiosis, might best describe the relationship.
The final issue that is raised frequently is the cost to institutions that self-archiving might impose. This is much more in the area of responsibility of librarians and institutional administrators than of authors. Will setting up and running an open access archive in a research-based university, for example, cost a lot of money? How will it be paid for, whose budget will it fall under, can it be afforded, will it need an open cheque for the future? We collected together some actual figures from various archive managers for a study we undertook recently to develop a model for a national e-prints service for the United Kingdom. The figures varied wildly, as we meant them to for illustrative purposes, for we selected as our examples some of the largest and most ambitious, and some of the smallest and most modest, institutional archives in existence. For the whole range of costs, the reader is directed to the report of that study11,12. It is probably
most helpful here to say that an average-sized research-based university can set up a functional archive for, say, ten thousand US dollars. Annual running costs vary according to the institution’s existing levels of provision of IT services, what level of interventional support administrators are going to give the archive, and how much advocacy activity is to be included, but could amount to half or one FTE if ambitions do not run too high. For all the benefits such an archive brings to an institution (see below), this represents excellent value for money.
So much for the worries and concerns about self-archiving. Let’s turn now to the arguments for it and the benefits that it can bring to the scholarly community, for there must be substantial benefits to be realised if the effort is to pay off. The benefits fall into two camps, those for the institution and those for the researchers (and some are shared, of course).
communicate their research findings to their peers, so that they can be built upon in future research efforts. Depositing an article at the time of acceptance for publication also means that the inevitable delay at the publisher before the article finally appears in the journal is immaterial — the article is already available to anyone who wants to read it and use it for their work. The research cycle is thus shortened. And of course, the article is available to all interested parties, not just to readers in institutions that can afford the journal in which it is published. There are other benefits, too. An institutional repository is a secure storage location for working documents or for research data; it becomes the mediator for a one-input, many-outputs scenario, where a researcher can retrieve whichever elements of his or her own research record are needed for a task-in-hand
(perhaps writing a paper, a lecture, preparing teaching materials, preparing a CV). It can also provide the home for research data that cannot be published in traditional journal format but which supports research findings and which the author would like to make available to peers and colleagues, data such as very large datasets, video files, graphical files of various formats, audio files and mixed media output.
For the institution, the benefits are just as substantial. Research-based institutions share with the researcher the wish to enhance the visibility and impact of the research generated within that institution. Institutions also have administrative burdens that require access to, and organisation of, information about their employees’ research records, research grant applications and fulfilment. They also need to carry out research performance evaluation (the Research Assessment Exercise in the UK being one such example,) and an
institutional open access archive provides a permanent record of all the research output of that institution (provided that it has ensured all the researchers deposit copies of their articles, of course). An archive can also serve as a marketing tool for the institution, a shop window for potential students, staff and assessors on what is being generated by that institution. In a similar vein an institution can measure itself against other institutions that it sees as ‘competitors’ when all the outputs are openly visible in institutional archives. And, finally, a repository provides a place for all the digital output of that institution, so not just research articles but digital records of academic and cultural life in that institution can be stored there.
mathematics), there are other well-known examples, such as Cogprints19
(cognitive sciences), also a centralised repository. RePEc20 (economics) is similar
but actually works by harvesting articles from distributed archives. Whilst there is the obvious attraction to the appropriate community of such subject-centred services, we have argued that the optimal system for encouraging and achieving self-archiving across the whole scholarly community is via a distributed system; in other words, a global network of institutional archives, all OAI-compliant and thus completely interoperable*, so that a user can locate and be directed to an original article wherever it resides and without having to know anything about its location11,12. Subject-based centralised archives have their devotees and can be
extremely popular within their communities. They are few and far between, however, and apart from arXiv most have been filling extremely slowly;
Cogprints, for example, despite its 8-year existence, still houses only around 2000 articles. Subject-based services can be very useful to researchers, but are
probably most effectively created by service providers (search-and-retrieval services) that harvest relevant subject-focused information from all repositories and sort and organise it to form a subject-centred offering to the research community.
The reason for arguing for a distributed system is that it is institutions (employers) that can most effectively bring about an effective self-archiving practice across the board. To be sure, research funders can influence the researchers they fund. The Wellcome Foundation is just implementing a self-archiving mandate for its grantholders to self-archive their articles and is setting up a new European PubMed Central archive for this purpose21. But external
research funds only benefit a fraction of the research carried out in universities, so research funders can only influence a fraction of researchers. The institutions themselves, however, can influence the whole body of scholars, in whatever disciplines they work, funded or not, and if all institutions provide an archive that is interoperable with every other archive then they are effectively
contributing to a global database of freely accessible research — true open access.
*OAI-compliant means that the article metadata (the title, authors, keywords etc) are created in the format laid down by the Open Archives Initiative Protocol for Metadata Harvesting (OAI-PMH). Search engines can then harvest the metadata from all archives making their metadata visible in this form, and present it to users in an appropriate way.
Acknowledgment
2.
THE RESPONDENTS
The total respondent population is composed of four subpopulations as follows:
• Respondents to a call-to-respond posted on various open access and
publishing-related online discussion lists (398 individuals; response rate unknown). This is termed the ‘interested and informed’ population.
• Respondents to an invitation sent to all individuals (851 people) whose email
addresses could be collected by trawling open access repositories worldwide and scanning peer-reviewed, published articles (52 individuals, representing a 6% response rate). This is termed the ‘archived’ population.
• Respondents to an invitation sent out internally within the School of Electronics & Computer Sciences at Southampton University to 240
individuals (we are grateful for the help of Dr Leslie Carr with this task). This School made self-archiving mandatory in January 2003 so is an excellent test-bed for collecting the views of authors who have been required to make their work open access in this way (35 individuals, representing a 15% response rate). This is termed the ‘Southampton’ population.
• Respondents to an invitation sent to around 25,000 names randomly-selected
from the Institute for Scientific Information’s Science Citation Index and Arts & Humanities Citation Index (811 individuals, representing a 3% response rate). This is termed the ‘randomly-selected’ population. Southampton University researchers were specifically excluded by ISI when selecting
names, as were the individuals invited as part of the ‘archived’ population, so as not to invite the same people twice. The proportions of invitations sent out in this campaign by ISI are shown in Table 1 below. All figures are
percentages and are rounded:
Region/country Arts & humanities Social sciences Sciences Total
United Kingdom 1 4 9 7
Western Europe 11 11 15 14
Eastern Europe 7 10 12 11
North America 44 37 20 27
Japan 6 6 5 6
Asia (less Japan) 14 15 12 13
Central/South America 8 5 14 11
Africa 2 6 8 6
Australia/New Zealand 6 7 5 5
Total 12 28 60 100
Table 1: Breakdown of invitations sent out using c25,000 email addresses supplied by ISI
institutions, 5% in the public sector and 5% in industry or business.
By geographical area the respondent pattern was as shown in Table 2. Figures are percentages and are rounded:
Region Percentage of total respondents
Australia/New Zealand 7
Asia (except China and Japan) 4
China 3 Japan 1 Canada 4 USA 21
Central/South America 6
European union (except UK) 17
Other European countries (except EU or
UK) 10
UK 18
Middle East 4
Africa 4
Table 2: Respondents by geographical area
By subject area the pattern of responses was as shown in Table 3. Figures are percentages and are rounded.
Subject Percentage of total respondents
Agriculture & food science 5
Business & management 4
Chemistry 6
Computer sciences 12
Earth & geographical sciences 3
Engineering, materials science & technology 8
Humanities 8
Law & politics 1
Library & information science 6
Life sciences 17
Mathematics 6
Medical sciences 17
Physics 7 Psychology 9
Social sciences & education 10
Table 3: Respondents by subject area
3. OPEN ACCESS JOURNALS
Respondents were first asked whether they had submitted a manuscript to, or had a paper published in, an open access (OA) journal in the last three years. 66% had not done these things, 24% said they had and 9% don’t know. It is important to understand the reasons why some people have chosen to publish their work on OA journals. The possible reasons why researchers might have elected to publish in open access journals were presented and respondents asked to indicate which of them were appropriate to their own case. The results are shown in Table 4. Reasons are presented in rank order. Figures are percentages of respondents and are rounded.
If you HAVE published in an Open Access journal, please indicate which of the following factors were reasons for doing so. Please select any that apply
Reason % respondents
The principle of free access for all readers 18 I perceive the readership to be larger than for a subscription-based
journal 11
I perceive OA journals to have faster publication times than other types of journal
10
The OA journal(s) I have published in are prestigious in my field 9 I think my article will be more frequently cited 8 The OA journal(s) I have published in have a high impact in my field 6 I was attracted to the editor / editorial board 5 I am concerned about the cost to my institution of no OA journals 3 I object to publishing with a non-OA commercial publisher 3 My decision to publish in an OA journal was influenced by my
co-publishing colleagues
2
The OA journal(s) I have published in are published from my own institution
1
My decision to publish in an OA journal was influenced by my
institution 0.8
My decision to publish in an OA journal was influenced by my grant-awarding body
0.3
Table 4: Reasons for publishing in open access journals
Although there were some minor variations in these percentage scores across subject areas, the rank order of the reasons remains consistent. A complete analysis of responses broken down by subject area is shown in Appendix 1. Some respondents offered additional comments which are reproduced in Appendix 2. A number of main themes arise from this list:
journal
• Some authors value the increased visibility and other perceived advantages of publishing in an OA journal
• There is a fairly strong perception that OA journals publish work quickly
These responses – the rank ordering, the level of support for each reason, and the extra comments – all tally with the results obtained in a previous survey by KPL where the same questions were asked1. This previous survey was carried out on
a much smaller sample population (around 150 individuals) and its findings have been called into question as a result of this, though we have asserted that the sampling methodology was carried out correctly and the findings were valid. This present larger-sample result almost exactly corroborates the previous
factors were reasons
Reason % respondents
I am not familiar enough with OA journals in my field to feel confident about submitting my work
36
I could not identify any OA journals to publish in 22 I perceive the OA journals in my field to have low prestige 17 I perceive the OA journals in my field to have low impact 16 I cannot find the funds to pay any publication fees required by OA
journals
14
I object in principle to paying a publication fee to OA journals that
charge one 13
I perceive the readership to be smaller than for a subscription-based journal
11
I always publish my work in the same journals and am satisfied with this way of working
9
I am concerned about the archiving of work published in OA journals 7 I perceive the OA journals in my field to have poor peer review
procedures in place 6
My decision was influenced by my co-publishing colleagues 4 My decision was influenced by my institution 4 My decision was influenced by my grant-awarding body 2 I perceive the OA journals in my field to have slower publication times
than traditional journals
0.5
Table 5: Reasons for not publishing in open access journals
A complete analysis of responses broken down by subject area is found in Appendix 3. A large number of respondents appended comments, which are reproduced verbatim in Appendix 4.
Once again, the rank order and level of response for the options match those found in the previous study. The main reasons why authors have not published in an open access journal are that:
• they are not familiar with the concept or with OA journals in their
field
• they could not identify a suitable one to publish in.
Interestingly, just as they did in the previous survey, authors who have not published in OA journals also say that they perceive them to have low prestige and impact, directly contradicting the perceptions of the authors who have published in an OA journal.
4. THE USE OF RESEARCH INFORMATION
When gathering information to use in assessing how scholarly communication will develop, which is one of the main purposes of this study, it is helpful to understand how researchers produce and use scholarly information. This enables the assessment of how scholars in different disciplines work, how they produce and use information, their levels of awareness of advances in digital information services, and how much and how effectively they use them. Ten of the questions in the survey addressed these issues.
4.1 Ease of access to work-related information
With respect to research articles, more than half (54%) of respondents say they have easy access to most of the articles they need for their work. A further 10% say they have easy access to all the articles they need. Just over one quarter of respondents (26%) have easy access to some of the articles they need and 9% can only easily access a few of the articles they need. There are minor differences between subject areas here, the main findings being that computer scientists, engineers and mathematicians have better access to the research information they need than average, and humanities scholars have the most difficulty in accessing what they need, but in general there are not great differences between disciplines. The full breakdown is given in Appendix 5.
4.2 Age of articles most commonly used
For your own work, when were MOST of the articles you consult – or cite in your own articles – published?
Period when most articles needed by
respondents were published Percentage of total respondents
Up to 2 years ago 8
Up to 5 years ago 35
Up to 10 years ago 34
Up to 20 years ago 17
Up to 50 years ago 4
More than 50 years ago 1
Table 6: How long ago most of the articles needed by respondents for their work were published
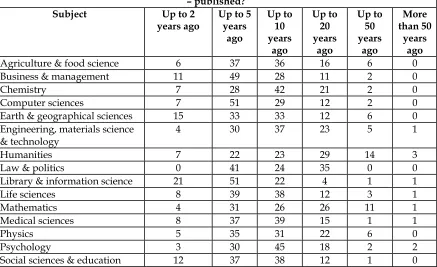
The full breakdown by subject area is in Table 7, and the data are presented in graphical form in Figure 1. The peak is in different places depending on subject area. For humanities the peak is around 20 years ago, for chemistry, engineering and medicine it is around 10 years ago and in computer science, life sciences and library & information science it is more recent at around 5 years ago.
For your own work, when were MOST of the articles you consult – or cite in your own articles – published?
Subject Up to 2
years ago Up to 5 years ago
Up to 10 years
ago
Up to 20 years
ago
Up to 50 years
ago
More than 50
years ago Agriculture & food science 6 37 36 16 6 0
Business & management 11 49 28 11 2 0
Chemistry 7 28 42 21 2 0
Computer sciences 7 51 29 12 2 0
Earth & geographical sciences 15 33 33 12 6 0 Engineering, materials science
& technology 4 30 37 23 5 1
Humanities 7 22 23 29 14 3
Law & politics 0 41 24 35 0 0
Library & information science 21 51 22 4 1 1
Life sciences 8 39 38 12 3 1
Mathematics 4 31 26 26 11 1
Medical sciences 8 37 39 15 1 1
Physics 5 35 31 22 6 0
Psychology 3 30 45 18 2 2
[image:21.612.90.527.372.639.2]Social sciences & education 12 37 38 12 1 0
0 10 20 30 40 50 60 Ag ric ult ure & fo od s ci enc e B usi ne ss & m a nag em ent Ch em is tr y C om put er sci en ce s Eart h & geo grap hic al sci en ce s En gin eeri ng, ma te ria ls sc i, te chno log y H u m a nit ies La w & pol iti cs Lib rary & in fo rmati on sc ie nc e Li fe s ci enc es M at h em at ic s Me d ica l sc ie nc es P hysi cs Ps yc hol ogy So ci al s cie nc es & ed uc at io n
Up to 2 years ago
Up to 5 years ago
Up to 10 years ago
[image:22.612.79.742.117.431.2]Up to 20 years ago
Up to 50 years ago
More than 50 years ago
0% 10% 20% 30% 40% 50% 60% 70% 80% 90% 100% A g ri cu ltur e & food s ci enc e B u si n e ss & management Chemi str y C o mputer sc ienc es Ear th & geogr aphi ca l sc ienc es E ngi neer ing, m a te ri a ls sci , tec hnol ogy H u mani ties Law & pol iti cs Li br ar y & in fo rm a tio n sci e n ce Li fe s ci enc es Mathemati cs Medi ca l sc ienc es Ph ysi cs P sy chol ogy S oc ial s ci enc es & educ ati o n
Up to 2 years ago
Up to 5 years ago
Up to 10 years ago
[image:23.612.97.714.112.409.2]Up to 20 years ago
Up to 50 years ago
More than 50 years ago
4.3.1 Number of articles published
Each year, 23% of respondents publish up to 1 article. Fifty percent publish 2-3 articles, 15% publish 4-5 and 11% publish more than 5 articles. The subject area where most papers are published is engineering, materials science & technology. Scholars in humanities and in library & information science publish the fewest. The full breakdown is given in Table 8 and Figures 3 and 4. Figures in the table are percentages of respondents and are rounded.
Approximately how many articles do you publish each year?
Subject 0-1 2-3 4-5 More
than 5 Agriculture & food science 19 57 16 7 Business & management 28 49 19 4
Chemistry 10 52 24 12
Computer sciences 27 47 11 15
Earth & geographical sciences 12 67 9 12 Engineering, materials science
& technology
17 44 14 24
Humanities 35 43 12 8
Law & politics 24 59 6 12
Library & information science 44 44 3 8
Life sciences 18 52 20 11
Mathematics 28 44 18 10
Medical sciences 20 49 15 15
Physics 20 55 15 9
Psychology 24 49 17 10
Social sciences & education 25 55 15 5
Whole population 23 50 15 11
0 10 20 30 40 50 60 70 80 A gr ic ul tur e & food s ci enc e Bu si ne ss & management C hemi str y C
omputer scienc
es Ea rt h & geogr aphi ca l sc ienc es E ngi neer ing, m at er ia ls sci , tec hnol ogy Humani ties Law & pol iti cs Li br ar y & in fo rm at io n sc ienc e Li fe s ci enc es Mathemati cs Medi ca l sc ienc es Phy si cs P sy chol ogy S o ci al s ci enc es & educ ati o n
[image:25.612.80.713.126.414.2]0 or 1
2 or 3
4 or 5
More than 5
0% 10% 20% 30% 40% 50% 60% 70% 80% 90% 100% A gr ic ul tur e & food s ci enc e Bu si ne ss & management C hemi str y C
omputer scienc
es Ea rt h & geogr aphi ca l sc ienc es E ngi neer ing, m at er ia ls sci , tec hnol ogy Humani ties Law & pol iti cs Li br ar y & in fo rm at io n sc ienc e Li fe s ci enc es Mathemati cs Medi ca l sc ienc es Phy si cs P sy chol ogy S o ci al s ci enc es & educ ati o n
[image:26.612.94.716.111.404.2]0 or 1
2 or 3
4 or 5
More than 5
4.3.2 Respondents’ citation records
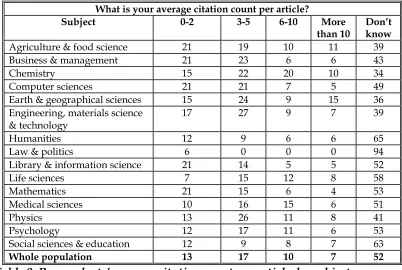
More than half (52%) of respondents don’t know what their average citation count per article is two years after publication. Thirteen percent of respondents say their average citation count is 0-2 at this time point; 17% say it is 3-5, 10% say it is 6-10 and 7% say it is more than 10. Scholars in earth and geographical
sciences claim the highest rate of citations. The full breakdown of answers to this question by subject area is given in Table 9 and Figures 5 and 6. Figures in the table are percentages of respondents and are rounded.
What is your average citation count per article?
Subject 0-2 3-5 6-10 More
than 10 Don’t know Agriculture & food science 21 19 10 11 39
Business & management 21 23 6 6 43
Chemistry 15 22 20 10 34
Computer sciences 21 21 7 5 49
Earth & geographical sciences 15 24 9 15 36 Engineering, materials science
& technology
17 27 9 7 39
Humanities 12 9 6 6 65
Law & politics 6 0 0 0 94
Library & information science 21 14 5 5 52
Life sciences 7 15 12 8 58
Mathematics 21 15 6 4 53
Medical sciences 10 16 15 6 51
Physics 13 26 11 8 41
Psychology 12 17 11 6 53
Social sciences & education 12 9 8 7 63
[image:27.612.121.523.220.490.2]Whole population 13 17 10 7 52
0 10 20 30 40 50 60 70 80 90 100 A gr ic ul tur e & food s ci enc e Bu si ne ss & management C hemi str y C
omputer scienc
es Ea rt h & geogr aphi ca l sc ienc es E ngi neer ing, m at er ia ls sci , tec hnol ogy Humani ties Law & pol iti cs Li br ar y & in fo rm at io n sc ienc e Li fe s ci enc es Mathemati cs Medi ca l sc ienc es Phy si cs P sy chol ogy S o ci al s ci enc es & educ ati o n
[image:28.612.80.717.128.411.2]0 to 2
3 to 5
6 to 10
More than 10
Don't know
0% 10% 20% 30% 40% 50% 60% 70% 80% 90% 100% A gr ic ul tur e & food s ci enc e Bu si ne ss & management C hemi str y C
omputer scienc
es Ea rt h & geogr aphi ca l sc ienc es E ngi neer ing, m at er ia ls sci , tec hnol ogy Humani ties Law & pol iti cs Li br ar y & in fo rm at io n sc ienc e Li fe s ci enc es Mathemati cs Medi ca l sc ienc es Phy si cs P sy chol ogy S o ci al s ci enc es & educ ati o n
[image:29.612.94.714.111.409.2]0 to 2
3 to 5
6 to 10
More than 10
Don't know
4.3.3 Publishing objectives
Respondents were also asked to say what their objectives are in publishing their work. The results are shown in table 10. The shaded columns show the
cumulated totals for the ‘agree’ and ‘strongly agree’ options and for the
‘disagree’ and ‘strongly disagree’ options, giving overall measures of agreement or disagreement with the statements. Figures are percentages of respondents and are rounded.
In general, what are your objectives when publishing scholarly work? Please indicate the degree to which you agree or disagree with the following statements
Reason for publishing
work Strongly agree Agree Strongly agree or agree
Disagree Strongly
disagree Strongly disagree or disagree To communicate results to
their peers 60 32 92 1 0 1
To advance their career 34 46 80 3 2 5
For personal prestige in
their filed 24 52 76 5 1 6
To increase their chances of gaining funding
24 40 64 8 4 12
For direct financial reward 1 8 9 24 47 71
Table 10: Scholars’ reasons for publishing their work
A number of respondents also offered additional comments after this question and these are reproduced verbatim in Appendix 6.
The answers here also corroborate findings from a previous study we carried out1,2 and confirm that the primary reason that scholars publish is to make their
research findings widely available for others to read and build upon. Career and personal reasons for publishing all come behind this foremost reason.
4.4 Searching for information
When searching closed (or ‘toll-access’) archives, that is, collections where the user has access only to the full-text of articles in journals to which they or their institution have a subscription, most people use ScienceDirect (54%). Obviously it is the science-based disciplines that are the primary users of ScienceDirect. Scholars in the humanities and other non-science subject disciplines
predominantly use other full-text services. The breakdown of these results by subject area is shown in Appendix 7. In total, 86% of people use this type of service.
The overall findings are shown in Table 11 below. Figures are percentages of respondents and are rounded.
When you search for articles online in CLOSED ARCHIVES, (i.e. where you are only allowed access to the full-text of articles in journals you or your library subscribe to), which services do you use regularly?
Services used regularly to search closed
archives Percentage of total respondents
ScienceDirect 54
Individual publishers’ websites 38
Subject-specific full-text services 25 Other cross-subject full-text services 22
CrossRef Search 7
Table 11: How users search for articles in closed archives
4.4.2 Research articles in open archives
where you can access the full-text of any research article)?
Services used regularly to search open
access archives Percentage of total respondents
Scirus 14
Citebase Search 10
OAIster 3 Open Archives Initiative Information in
Engineering, Computer Science & Physics (OAIIECSP)
3
Public Knowledge Project Open Archives
harvester (PKP) 2
Perseus 1.6 Arc 1.5 CYCLADES 0.5
Callima 0.4 SAIL-eprints 0.2 TORII 0.1
Table 12: How users search for articles in open access archives
It should be noted that answers to this question were not mutually exclusive, so a respondent was able to give more than one answer. A total of 30% of
respondents are represented here (391 individual respondents). This finding supports data presented later in this report that show that awareness of open access and how to use open access tools remains limited. Computer scientists are the most frequent users of these services, with life scientists and medical
scientists following. Other disciplines show very low levels of usage in general. Respondents who do search open access archives do so fairly infrequently compared to the findings for bibliographic databases, for example. Fifty percent search open access archives less frequently than once per month; 17% do so at least once per month, 12% at least once per week and 9% several times per week. When it comes to searching the World Wide Web for research articles on
5. SELF-ARCHIVING
There are three ways a researcher can provide open access to articles by self-archiving. S/he can deposit a copy of an article on a personal or institutional website, or place it in an institutional open access archive, or put it in a subject-based, centralised, open access archive (such as the physics archive, called arXiv, or Cogprints, the cognitive science archive). Articles may be in preprint (pre-peer review or pre-refereeing) or postprint (after (pre-peer review or refereed) form.
5.1 Self-archiving experience
5.1.1 The level of self-archiving activity
Respondents were asked to indicate how many times in the past three years they had deposited full copies of their research articles in these various ways. In each case the majority of researchers had not deposited any articles in that way. The full results for this question are shown in Table 13. Figures are percentages of respondents and are rounded.
In the past 3 years, how many times have you deposited full copies of the following version of research papers in the following ways?
Open access provision method None Once 2-3
times times 4-5 times >5 percentage Total self-archiving
in this way Pre-refereeing draft on personal web page 79 5 7 3 7 21 Refereed, published research article on
personal web page
69 6 9 4 13 31
Pre-refereeing draft in departmental or
institutional OA archive 82 4 7 3 4 18
Refereed, published research article in departmental or institutional OA archive
75 5 8 4 8 25
Pre-refereeing draft in a centralised subject-based open archive
89 4 3 2 3 13
Refereed, published research article in a
centralised subject-based open archive 85 4 3 3 5 15
Table 13: Patterns of self-archived open access provision by researchers
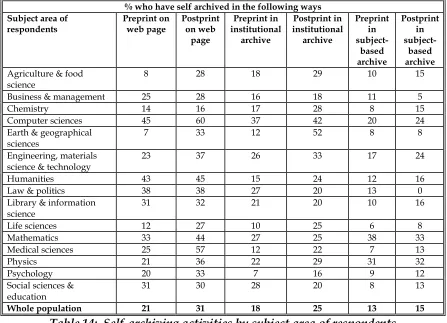
Subject area of
respondents Preprint on web page Postprint on web page
Preprint in institutional
archive
Postprint in institutional
archive
Preprint in
subject-based archive
Postprint in
subject-based archive
Agriculture & food science
8 28 18 29 10 15
Business & management 25 28 16 18 11 5
Chemistry 14 16 17 28 8 15
Computer sciences 45 60 37 42 20 24
Earth & geographical sciences
7 33 12 52 8 8 Engineering, materials
science & technology
23 37 26 33 17 24
Humanities 43 45 15 24 12 16
Law & politics 38 38 27 20 13 0
Library & information science
31 32 21 20 10 16
Life sciences 12 27 10 25 6 8
Mathematics 33 44 27 25 38 33
Medical sciences 25 57 12 22 7 13
Physics 21 36 22 29 31 32
Psychology 20 33 7 16 9 12
Social sciences &
education 31 30 28 20 8 13
[image:34.612.83.530.73.396.2]Whole population 21 31 18 25 13 15
Table 14: Self-archiving activities by subject area of respondents
0 10 20 30 40 50 60 70 Agri cu lture & fo o d sci e nce B usi ne ss & m a na gem e nt Che m is tr y C om p ut er sci e nce s Eart h & g eog raph ic a l sci e nce s Eng in eeri ng, ma te ria ls sci , te chno log y H um a ni ties La w & po litic s Li brary & inf o rm at io n sc ie n ce L ife s ci enc es M a them a tic s M edi ca l sc ienc es Phy sic s Ps yc hol ogy Soc ial s ci enc es & edu ca tio n
Preprint on web page Postprint on web page Preprint in institutional archive
[image:35.612.77.706.138.431.2]Postprint in institutional archive Preprint in subject archive Postprint in subject archive
0% 20% 40% 60% 80% 100% Agri cu lture & fo o d sci e nce B usi ne ss & m a na gem e nt Che m is tr y C om p ut er sci e nce s Eart h & g eog raph ic a l sci e nce s Eng in eeri ng, ma te ria ls sci , te chno log y H um a ni ties La w & po litic s Li brary & inf o rm at io n sc ie n ce L ife s ci enc es M a them a tic s M edi ca l sc ienc es Phy sic s Ps yc hol ogy Soc ial s ci enc es & edu ca tio n
Preprint on web page Postprint on web page Preprint in institutional archive
[image:36.612.99.713.130.403.2]Postprint in institutional archive Preprint in subject archive Postprint in subject archive
Finally, it is informative to report how many individuals are involved in self-archiving at all. The question permitted respondents to check any number of options, so that some of the people who have self-archived on their websites, for example, may also have self-archived in institutional or subject-based
repositories. The overall findings presented above, therefore, do not reveal the true level of self-archiving within the population. To find out what this was, the results for this question were analysed on a case-by-case basis so that the number of individuals represented in the results was revealed.
The total number of people in the respondent population who have self-archived in any way is 631, that is, 49% of the total population. This total population of 1296 researchers has carried out 1303 individual acts of self-archiving; since 631 individuals have archived, the average number of archiving acts per self-archiver is 2.1. The last time we measured the level of self-archiving1,2, 10
months earlier than this present survey, 23% of the population had self-archived in some way at least once. See below for more details of this earlier survey in comparison to the present one.
The proportions of self-archivers in each of the subpopulations (see Section 2 for definitions) surveyed is:
‘Interested and informed’ population: 35%
Archived population: 85%
Southampton population: 77%
Randomly-selected population: 42%
It can be noted that the ‘interested and informed’ population is not self-archiving as much as the average, or as much as the randomly-selected population, so the term ‘interested’ is something of a misnomer. The results for the ‘archived’ and ‘Southampton’ populations are also worthy of comment. The archived
population comprised individuals whose names were obtained from papers stored in open access archives (see section 2). In practice, then, every one of these individuals should be a self-archiver, by definition. Nonetheless, 15% of them have not recorded any self-archiving activity in this survey, underlining the fact that an author may become a self-archiver by default, that is, by his or her papers being archived by co-authors or by proxy archivists (librarians, archive
Southampton repository (courtesy of Dr Les Carr) suggests that the explanation for this is that colleagues or departmental administrators have actually deposited the articles in many cases, leaving individual researchers either unaware of the fact that their work resides in the repository or insufficiently familiar with the procedures to feel able to respond to the questions in this survey. Who is doing the depositing of self-archived articles is examined in Section 5.4.
There is more that can be learned from this question, too, as follows. How do these different respondent populations compare in detail? Table 15 shows the level of self-archiving for each of the respondent
subpopulations. It shows the number of people in each subpopulation who have self-archived articles in one or more of the six possible ways (which are: putting a preprint on a web page; putting a postprint on a web page; putting a preprint in an institutional archive; putting a postprint in an institutional archive; putting a preprint in a subject archive; or putting a postprint in a subject archive). Some people have done all six, some none, and some have done some or many of these things. Figures in Table 15 are all percentages of the sub-populations concerned and are rounded.
Number of ways in which respondents have self-archived their articles
Respondent sub-populations
1 2 3 4 5 6
‘Interested & informed’ population 20 7 6 0 2 1
Archived population 27 31 14 8 4 2
Southampton population 29 26 11 11 0 0
Randomly-selected population 20 13 4 3 1 2
Table 15: Patterns of self-archiving by respondent sub-populations
Table 16 compares the findings from this present survey (last quarter 2004) with those from the previous survey (January 2004). Figures are percentages of the total respondent population and are rounded.
Open access provision method Earlier survey Present survey
Pre-refereeing draft on personal web page 23 18
Refereed, published research article on personal web page 22 27 Pre-refereeing draft in departmental or institutional OA archive 4 15 Refereed, published research article in departmental or
institutional OA archive
10 20
Pre-refereeing draft in a centralised subject-based open archive 7 9 Refereed, published research article in a centralised subject-based
open archive
7 12
0 5 10 15 20 25 30 P repri n
t on w
e b page P o stpri n
t on w
e b page P re p rin t in in sti tuti onal archi ve P o st p rin t in in sti tuti onal archi ve P repri n t i n subj ect-based archi ve P o stpri n t i n subj ect-based archi ve % re sp o nde nt s
[image:39.612.104.556.114.519.2]Earlier survey Present survey
Figure 9: Comparison of earlier and present surveys with respect to self-archiving patterns
Open access provision
method population Whole ‘Interested and informed’ population
Archived
population Randomly-selected population
Southamp-ton population Pre-refereeing draft on
personal web page
231 107 12 108 4
Refereed, published research
article on personal web page 344 130 17 181 16
Pre-refereeing draft in departmental or institutional OA archive
192 55 19 102 16
Refereed, published research article in departmental or institutional OA archive
262 83 23 139 17
Pre-refereeing draft in a centralised subject-based open archive
119 32 14 62 1
Refereed, published research article in a centralised subject-based open archive
155 52 13 88 2
Total number of acts of self-archiving by this population
1303 469 98 680 56
Average number of acts of self-archiving per
researcher
1.01 1.15 1.75 0.83 1.60
Number in population 1296 398 52 811 35
Table 17: Individual acts of self-archiving of different types by each respondent population
Percentage of respondents Open access provision
method
Those publishing 0-1 papers per year
Those publishing 2-3 papers per year
Those publishing 4-5 papers per year
Those publishing more than 5 papers per year Pre-refereeing draft on
personal web page
23 20 22 21
Refereed, published research
article on personal web page 25 30 36 39
Pre-refereeing draft in departmental or institutional OA archive
12 19 14 20
Refereed, published research article in departmental or institutional OA archive
20 25 26 29
Pre-refereeing draft in a centralised subject-based open archive
15 10 12 11
Refereed, published research article in a centralised subject-based open archive
[image:41.612.85.552.100.370.2]17 13 15 17
0 5 10 15 20 25 30 35 40 45
0 or 1 2 or 3 4 or 5 More than 5
Papers published per year
% r
es
pondent
s
Preprint on web page Postprint on web page
[image:42.612.121.469.89.477.2]Preprint in institutional repository Postprint in institutional repository Preprint in subject archive Postprint in subject archive
0% 10% 20% 30% 40% 50% 60% 70% 80% 90% 100%
0 or 1 2 or 3 4 or 5 More than 5
Papers published per year
% r
es
pondent
s
Postprint in subject archive
Preprint in subject archive
Postprint in institutional repository
Preprint in institutional repository
Postprint on web page
[image:43.612.125.572.88.337.2]Preprint on web page
0 5 10 15 20 25 30 35 40 45
Preprint on web page
Postprint on web page
Preprint in institutional
repository
Postprint in institutional repository
Preprint in subject-based
archive
Postprint in subject-based
archive
% r
es
pondent
s
0-1 papers per year 2-3 papers per year
[image:44.612.125.556.87.480.2]4-5 papers per year More than 5 papers per year
0% 10% 20% 30% 40% 50% 60% 70% 80% 90% 100%
Preprint on web page
Postprint on web page
Preprint in institutional
repository
Postprint in institutional repository
Preprint in
subject-based archive
Postprint in
subject-based archive
% res
pondent
s
0-1 papers per year 2-3 papers per year
[image:45.612.130.522.86.436.2]4-5 papers per year More than 5 papers per year
Figure 13: Self-archiving activities by respondents publishing varying numbers of papers per year. Data expressed by activity (stacked column chart)
5.1.2 Length of experience of self-archiving
Those respondents who had self-archived were asked for how long they had been doing this. The results for the whole population are shown in Table 19 and Figure 14. Figures in the table are percentages of respondents who have self-archived and are rounded.
If you have done any of the above, for how long have you been doing this?
Experience of self-archiving Percentage of respondents
Within the last year 21
2-3 years 32
3-5 years 21
Longer than 5 years 26
0 5 10 15 20 25 30 35
Within the last year
2-3 years 3-5 years Longer than 5 years
% r
es
pondent
[image:46.612.106.506.89.344.2]s
Figure 14: Length of time for which researchers have been self-archiving
It appears that the momentum is growing with respect to self-archiving activity. Just over a quarter of self-archivers began this activity over 5 years ago. Between three and five years ago roughly ten percent of them began to self-archive each year. This increased to 16% per year more recently and the last year accounted for 21% of the total taking up the self-archiving habit.
Subject area of respondents Longer than
5 years 3-5 years 2-3 years Within the last year only
Agriculture & food science 22 11 47 19
Business & management 25 25 20 30
Chemistry 19 19 30 32
Computer sciences 41 17 28 15
Earth & geographical sciences 12 12 38 38
Engineering, materials science & technology
24 25 32 19
Humanities 18 32 28 22
Law & politics 46 18 9 27
Library & information science 16 19 30 35
Life sciences 26 21 33 20
Mathematics 29 33 24 14
Medical sciences 15 20 43 23
Physics 35 30 25 11
Psychology 19 22 41 19
Social sciences & education 14 23 37 26
[image:47.612.85.515.79.313.2]Whole population 6 21 32 21
0
5
10
15
20
25
30
35
40
45
50
A g ri cul tur e & food sci enc e B u si ness & m ana gem ent Ch em is tr y C o m put er sc ie nces Ea rt h & ge ogr aphi ca l sci enc es E ngine er ing, m at er ial s sc i, technol ogy Hu m an it ie s La w & pol it ic s Li br ar y & in for m ati on sci enc e Lif e sci enc es Ma them at ic s Medi cal sci enc es Ph ys ic s P sychol ogy S o ci al s ci ence s & educa ti o n [image:48.612.81.733.119.471.2]Longer than 5 years 3-5 years 2-3 years Within the last year