Polymeric optical fibre sensor coated by SiO2 nanoparticles for humidity sensing in the skin microenvironment
David Gomez, Stephen P. Morgan, Barrie R. Hayes-Gill, Ricardo Goncalves Correia, Sergiy
Korposh
Optics and Photonics Research Group, Faculty of Engineering, University Park, University of
Nottingham, Nottingham, NG7 2RD, UK
Corresponding author: Sergiy Korposh, [email protected]
ABSTRACT
The sensitivity of a low-cost polymeric optical fibre humidity sensor based on transmittance
changes due to evanescent wave absorption is reported using test measurements in an
environmental chamber and of the skin. The layer-by-layer method was used to coat 30mm of
the central unclad section of a multimode polymeric optical fibre with 7 layers of a hydrophilic
film consisting of bilayers of poly(allylamine hydrochloride) and SiO2 mesoporous
nanoparticles. Sensor characterisation shows a decrease in light transmission as relative
humidity increases as a result of refractive index changes of the coating deposited onto the
optical fibre which correlates with a commercial capacitive humidity sensor. The sensitivity
obtained for the sensor coated with an optimum 7 layers was approximately -3.87x10⁻³ and
-9.61x10⁻³ in transmittance percentage per RH percentage for the range of ~10% to ~75% RH
and 90% to 97% RH, respectively. In addition, a response time of 1.5s can be seen for breath
monitoring with the polymeric optical fibre humidity sensor. The proof of concept
measurements made on the skin indicate that this sensor has the potential to be used to monitor
humidity of the skin microenvironment within a wound dressing which can be used to provide
better prognosis of healing.
1. Introduction
Humidity measurements are important for several aspects of daily life, such as air conditioning,
meteorological forecast and in industrial settings. Furthermore, there are medical conditions
that would benefit from humidity monitoring, such as monitoring of air delivered to
mechanically ventilated patients in critical care [1] and monitoring the microenvironment of
chronic wounds [2]. Chronic wounds are a major global healthcare problem placing a
considerable economic burden on the resources of healthcare providers. For example, in the
UK alone, a recent analysis of the health economic burden of wounds [3] highlighted that ~2.2
million wounds were managed by the publicly funded National Health Service (NHS) in
2012/2013 requiring 18.6 million practice nurse, 10.9 million community nurse, 7.7 million
GP and 3.4 million hospital outpatient visits. The annual NHS cost of managing these wounds
is £4.5-5.1 billion (~4% of the entire NHS budget). A wound dressing that remotely monitors
parameters associated with healing such as humidity presented on the wound
microenvironment, wound exudate pH and proliferative cell levels within the wound could
have a significant impact on these costs. This monitoring would enable clinical interventions
to take place promptly but only when required, thus improving wound care and reducing the
number of clinical appointments.
Studies by Winter [2] have demonstrated the advantages of keeping a moist environment at the
wound surface rather than allowing the wound to dry out. It has been shown that the healing
rate is at least twice faster when the wound is covered by a dressing in order to maintain optimal
hydration [4]. Moisture on wounds accelerates the epithelialization phase of wound healing by
preventing scab formation over the wound bed. This increases migration of proliferative cells,
such as fibroblast and endothelial cells that produces angiogenesis and promotes growth factors
and keratinocytes, which results in faster dermal repair and reduced scarring of the wound [5]
[6] [7]. Additionally, it has been shown that moist wounds decrease bacterial infection by the
formation of a hostile antibacterial environment [8]. However an equilibrium in humidity
should be reached in order to avoid skin breakdown and delayed healing [9] [10].
In order to preserve a moist environment on the wound surface, humidity can be measured.
The level of humidity is quantified by the term relative humidity (RH), which is defined as the
environment can hold, expressed as a percentage. Several devices exist to measure humidity
[11]; many of them are either expensive or not suitable to be embedded within wound
dressings. Previous research has incorporated electrochemical sensors into wound dressings
[12] [13] [14] but optical fibre sensors (OFS) have not yet been investigated in such a setting.
These potentially offer a more convenient and reliable alternative method of monitoring
humidity [15] [16] as they have low-cost fabrication, small size and diameter (micrometres),
fast response and high sensitivity [17].
Previous research has shown different approaches of humidity sensors based on silica core fibre
[1] [18] [19]. However, it is known that a silica core fibre may not be suitable for use in a harsh
environment due to its fragility after removing the cladding. In contrast, polymeric optical
fibres (POF) have higher elasticity and strength to resist rough handling that makes them well
suited to be embedded within wound dressings [20]. In the work presented in this paper, the
fabrication and characterisation of a polymeric optical fibre humidity sensor (POFHS) is
described. The unclad central region of the POF was coated by a hydrophilic mesoporous film
based on poly(allylamine hydrochloride) (PAH) and SiO2 mesoporous nanoparticles
(PAH/SiO2) using a layer-by-layer (LbL) deposition method [21]. The principle of operation
of the POFHS is based on the measurements of the light intensity changes due to the interaction
between the evanescent wave (EW) and the hydrophilic film, which changes its refractive index
with humidity.
The ultimate objective of this work is to develop an optical fibre sensor that can be embedded
into a textile, such as wound dressings in order to provide humidity measurements of the wound
microenvironment without removing the dressing and hence disturbing the wound healing
process. Our work aims to provide a better prognosis of wound healing that can result in a
reduction of hospitalization time, prevention of advanced treatments such as surgery, reduced
referrals and hence reduced health care costs [22]. The ability to predict the efficiency of wound
healing will help ensure patients receive the appropriate attention at the earliest possible stage.
In this work, as an initial step, the fibre was embedded into a textile and humidity generated
from the intact skin was measured to prove the concept. An example is also provided within a
2. Material and Methods
This section describes the sensor fabrication and monitoring process and two experiments that
were carried out to demonstrate the sensitivity of the POFHS as a function of humidity: the
first in an environment where humidity was controlled by flowing nitrogen through a gas
chamber and another using humidity generated from the palm of a hand.
2.1 Sensor fabrication
ESKA SK-10 multimode POF (1.49 refractive index, 0.5 NA, Mitsubishi Rayon Co., Ltd.) with
the core diameter of 240µm polymethyl-methacrylate resin (PMMA) and 5µm fluorinated
polymer cladding was used. In order to facilitate interaction between the mesoporous thin film
and EW the cladding was removed to expose the core in a region around the mid-section of the
fibre. The optical fibre was placed within a holder made of Teflon containing a channel of
dimensions 50mm length, 5mm width and 7mm height and exposed to acetone ((CH3)2CO) in
order to remove the cladding. The diameter of the optical fibre after cladding removal was
measured using a microscope (BX50F4, Olympus optical Co. Ltd.).
Since the POF cladding is only 5µm thick, it can be easily removed. Nonetheless, it was
observed that by removing also a small part of the core, a more uniform surface is achieved in
order to obtain better film deposition and hence higher sensitivity due to enhanced interaction
between EW and the humidity sensitive film. Scanning electron microscopy (SEM) (Philips
(FEI) XL30 FEG ESEM) images from the unclad section of the fibre were taken in order to
observe uniformity of the unclad surface of the fibre. For SEM measurements the unclad
section of the fibre was coated with platinum (Pt) using sputtering coating method.
Once the cladding and a part of the core are removed the humidity sensitive film is deposited
using the LbL method. SiO2 mesoporous nanoparticles (SNOWTEX 20L, 40-50nm diameter,
Nissan Chemical, Japan) were deposited with poly(allylamine hydrochloride) (PAH) to form a
PAH/SiO2 hydrophilic material which creates a higher humidity sensitivity compared with
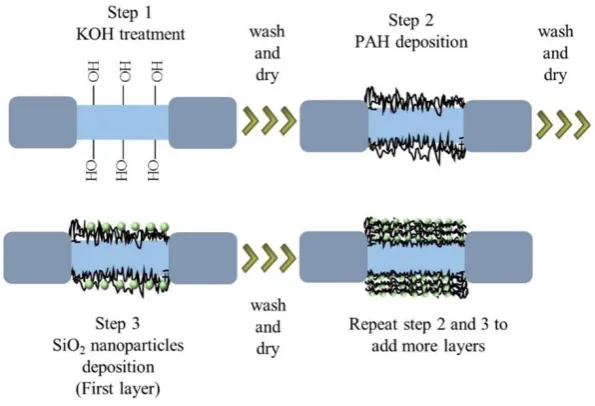
The PAH/SiO2 layers were deposited in three steps as illustrated in Figure 1 [24]. First, the
unclad surface of the POF is placed within the Teflon holder. The core surface is activated by
depositing 1wt% ethanolic KOH in order to functionalise it with OH- groups. After 20 min,
KOH is removed using an aspiration pump and the fibre is rinsed and dried with deionized
water and Nitrogen gas (N2), respectively.
Second, the fibre is bathed with 0.17wt% of positively charged PAH (Sigma-Aldrich Co, UK,
polycation, pH = 11) for 15 min. After the polycation deposition, the fibre is washed and dried
again. The third stage is to immerse the fibre in a solution containing negatively charged SiO2
nanoparticles for 15 min. Then the fibre is once again washed and dried in order to remove any
excess nanoparticles and obtain a uniform monolayer. In order to deposit more layers, the
[image:5.595.150.448.348.551.2]second and the third steps are repeated.
Figure 1. Layer-by-Layer deposition process.
The cladding removal and LbL deposition processes were monitored using the set-up illustrated
in Figure 2. It consists of a tungsten halogen lamp (Ocean Optics HL-2000, wavelength range
λ = 360nm – 2400nm) connected to one end of a POF via an SMA connector. At the other end
of the fibre, intensity light changes produced by the interaction of the humidity sensor with the
surrounding environment were monitored by a spectrometer (Ocean Optics USB 2000+,
detection range λ = 200nm – 1100nm). The spectrometer is connected to a computer via a USB
Figure 2. Set-up for monitoring POFHS fabrication process.
2.2 In-vitro humidity measurement using flowmeter setup
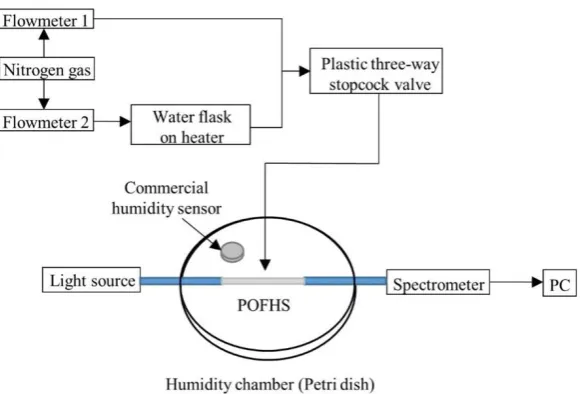
The in-vitro experimental set-up for generating humidity of different levels is illustrated in
Figure 3. Nitrogen gas is supplied to two flowmeters, F1 and F2 (range 0.1 – 1 L/min,
Cole-Parmer Instrument Co. Ltd.). F1 supplies nitrogen gas directly to one input of a plastic
three-way stopcock valve whilst F2 is connected to a heated flask filled with water. Once evaporation
of water begins, vapour is transported from the flask to the other input of the stopcock valve in
order to mix flows from F1 (direct N2 low humidity) and F2 (water vapour, high humidity). The
combination of F1 and F2 provides different levels of RH. The inflow from the stopcock valve
output was connected to the lid of a Petri dish via a pipe. Plastic paraffin film was used to seal
the pipe with the lid and the rest of the Petri dish in order to avoid leakage.
To generate different levels of humidity the initial conditions of the flowmeters were set such
that F1 (direct nitrogen) and F2 (water vapour) were fully closed (0.0 L/min) for 2 min, i.e. the
baseline humidity inside the chamber was recorded. Measurements were then repeated with F1
fully open (1.0 L/min) whilst F2 was kept fully closed (0.0 L/min) until the signal stabilised
(approximately 3.5min). Then, F1 was reduced by 20% and F2 was increased to 20% of full
scale (F1 = 0.8 L/min, F2 = 0.2 L/min) until there was no change in the signal (~3.5min). The
flowmeter values were then changed in intervals of 20% until F1 was fully closed and F2 was
fully open.
The Petri dish acts as a measurement chamber containing the POFHS connected to the tungsten
halogen light source at one end and to the spectrometer at the other end to obtain continuous
standard, a commercial humidity sensor (iButton Hygrochron Temperature/Humidity Logger,
[image:7.595.169.463.121.318.2]DS1923, 0 to 100%RH, Maxim Integrated Ltd.) was also located inside the chamber.
Figure 3. In-vitro humidity experiment with flowmeters and POFHS located inside a petri dish which acts as a humidity chamber.
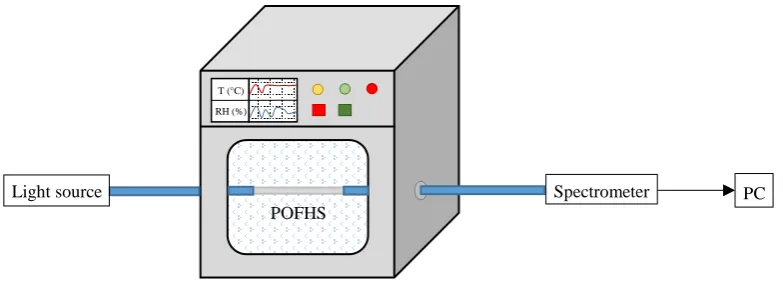
2.3 In-vitro humidity measurement using environmental chamber
A series of three test were performed using an environmental chamber (Bench Top,
C-TH40-20/1, CVMS °Climatic Ltd., UK) to control RH and temperature conditions. The characteristics
of the environmental chamber are: 40L internal capacity with dimensions of 300mm x 400mm
x 300mm, depth, height and width, respectively. Temperature range of -20°C to 150°C and
humidity range of 30% to 98% ±2.5% RH. The environmental chamber flows cold and hot air
to change temperature and a compressor, a condenser and an evaporator are used for changing
RH within the chamber. The control of temperature and RH is made by a programmable logic
controller (PLC, TEMI 1500).
In the experimental setup, as shown in Figure 4, the POFHS is inserted in the centre of the
environmental chamber through portholes (50mm diameter) on each side of the chamber. The
tungsten halogen light source and the spectrometer are connected to each end of the POFHS to
The first test consisted in varying RH from 90% to 97% and vice versa with fixed temperature
at 30°C. In the second test, temperature was changed along the time from ~25°C to 35°C and
vice versa with RH constant at 90%. The third test consisted on setting RH and temperature
constant for a long period at 85% and 30°C, respectively, to observe the response, repeatability
and stability of the POFHS.
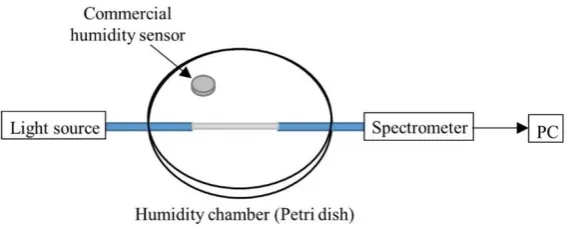
2.4 In-vivo humidity measurement
For the in-vivo humidity test on skin, a similar optical set-up as the above in-vitro test was
deployed (Figure 5). The POFHS was inserted inside the measurement chamber along with the
reference standard device. On this occasion the sealed lid of the chamber and the flowmeters
were replaced by the palm of a human hand. The in-vivo test involved covering the chamber
with the palm of the subject’s hand until the output signal from the spectrometer stabilised and
then removing the hand until the output signal stabilised. This process was repeated 3 times so
as to ascertain repeatability of measurements. The experiment was carried out at room
temperature (23°C) with measurements on 5 different volunteers (male, healthy, age 25 – 35)
recorded. Before the test, all volunteers cleaned their hands with a commercial antibacterial
and alcohol-free hand foam sanitiser (Ecohydra) in order to stabilise the skin to the same
condition for each participant. Ethical approval was provided by the Ethics Committee, Faculty
of Engineering, University of Nottingham.
Environmental chamber POFHS
Light source Spectrometer PC
[image:8.595.111.503.181.329.2]T (°C) RH (%)
Change in humidity levels in the in-vitro experiments was limited by the flowmeters and in the
case of in-vivo measurements by the release of water vapour from the skin. An additional
experiment was therefore conducted to investigate the response time of the POFHS and the
[image:9.595.157.442.163.278.2]commercial humidity sensors by applying short rapid breaths to the measurement chamber.
Figure 5. Set up for in-vivo humidity test on human skin using the POFHS.
3. Results
3.1 Sensor fabrication monitoring
The optimum core diameter for film deposition was 190 ±5µm which can be reached after 27
minutes immersion in acetone since at this diameter a complete removal of cladding and a more
uniform surface can be achieved, compared with 210µm core diameter as shown in the SEM
images taken from the unclad section of the fibre (Figure 6). Further etching time produced a
fragile fibre and hence will not be practical for applications in wound dressings. At a core
diameter of 190µm different sensing region lengths (5, 10, 20 and 30mm) were also
investigated.
[image:9.595.143.453.562.665.2]In order to compare the interaction of the evanescent wave with different lengths of sensitive
region, the peak intensity of the spectra at wavelength 611nm was measured. Figure 7
illustrates the transmittance at = 611nm as a function of the sensitive region length for four
fibres with 190µm core diameter. It was observed that with an increased length of cladding
removed, less light intensity was transmitted to the spectrometer. This was expected since more
light is able to escape from the unclad section of the fibre, which also increases the EW region
that interacts with the hydrophilic film and the surrounding environment. Nonetheless, longer
exposed regions produced a fragile fibre and therefore was not practical for applications in
wound dressings. The standard deviation is less than 1%, therefore error bars are not plotted
[image:10.595.189.405.289.465.2]on the graph.
Figure 7. Comparison of transmittance at 611nm wavelength versus length of the unclad section of the POF after cladding removal. Core diameter = 190µm.
The optimum length in terms of mechanical robustness and sensitivity of the sensitive region
for the POF was 30mm and 190µm core diameter. Figure 8 illustrates the increment in
transmittance versus wavelength as more layers are added to the fibre for the whole spectra
(Figure 8a) and at 611nm wavelength (Figure 8b). After depositing the 7th layer, it can be seen
that only a small change in intensity occurs. This can be explained with reference to the
relationship between EW penetration depth and film thickness. Optimum film thickness needs
to be lower than or equal to the EW penetration depth as sensitivity decreases due to the lack
In this case, the POFHS has a refractive index of 1.49 and 1.22 for the core and the hydrophilic
film [25], respectively. For measurements at the wavelength peak of 611nm and angle of
incidence 57°, the penetration depth of the EW is approximately 360nm. Since a PAH/SiO2
layer is approximately 45nm thick, after 7 layers are deposited the film thickness is close to the
[image:11.595.82.510.186.350.2]EW penetration depth.
Figure 8. (a) POFHS light spectra along film deposition which illustrates that as more layers are deposited, light intensity increases. (b) Transmittance at 611nm wavelength versus
number of layers deposited. After the 7th layer the sensitivity starts to decrease due to the
relationship between film thickness and EW penetration depth.
3.2 In-vitro humidity measurement based on flowmeter setup
The intensity at the 611nm wavelength peak is illustrated in Figure 9 for a fibre with 190µm
core diameter and 7 PAH/SiO2 layers deposited on a 30mm sensitive region (red trace)
compared to the capacitive humidity sensor (blue trace). As can be seen, the POFHS can
clearly detect humidity changes and also has a faster response time compared with the
capacitive humidity sensor as the RH was changed. The sensor settling time is defined as the
time at which the light intensity stabilises within 2% of the maximum value recorded for
humidity level. The average settling time for the POFHS was 23s whereas for the commercial
sensor the average settling time was 45s. It should be noted that this is not representative of the
Figure 9. In-vitro humidity measurement with flowmeters F1 and F2 gradually adjusted in steps of 20% to vary humidity in the chamber. All results were monitored at 611nm
wavelength for the POFHS with 7 PAH/SiO2 layers deposited.
Figure 10 shows the calibration curves for in-vitro humidity measurements with POFHS coated
with 5 and 7 PAH/SiO2 layers. Measurements were taken at 611nm wavelength for both sensors
(190µm core diameter and 30mm sensitive region length). It can be observed that the POFHS
sensitivity increases as the number of layers increases. After 7 PAH/SiO2 layers are deposited,
the POFHS demonstrated a sensitivity of -3.87x10⁻³ in transmittance percentage per RH
percentage for the range of ~10% to ~75% RH. The thickness of 7 PAH/SiO2 layers is the
closest to the EW penetration depth and provides optimal performance, since higher interaction
Figure 10. In-vitro calibration curves of a POFHS coated with 5 and 7 PAH/SiO2 layers. Measurements were taken at 611nm wavelength, 190µm core diameter and 30mm sensitive
region length for both sensors.
3.3 In-vitro humidity measurement based on environmental chamber
Figure 11a shows the results for the first test performed with the environmental chamber setup
where RH was changed from 90% to 97% and vice versa every 30 minutes. The temperature
was set constant at 30°C (Figure 11b). It can be noted that the POFHS response (red trace) is
following perfectly the humidity change measured using the environmental chamber sensor
(blue trace). Repeatability can be observed in the measurements recorded at 611nm wavelength
for the POFHS with 7 PAH/SiO2 layers, Figure 11a. The linearity observed shows a sensitivity
of -9.61x10⁻³ in transmittance percentage per RH percentage in the range of 90% to 97% RH,
The second test consists of cycling the temperature from ~25°C to 35°C while trying to
maintain RH at 90% using the environmental chamber. Since temperature and RH are related,
it can be seen that RH fluctuates (Figure 13a) as temperature was changed from ~25°C to 35°C
(Figure 13b) and backwards. Nevertheless, the POFHS behaviour is proportional to that
recorded by the environmental chamber sensor (Figure 13a) which indicates that the sensor is
[image:14.595.93.507.85.251.2]a) b)
Figure 11. First test with POFHS with 7 PAH/SiO2 layers within environmental chamber setup. (a) POFHS (red trace) and environmental chamber sensor (blue trace) response to
humidity in the range of 90% to 97% RH. (b) Temperature recorded during the test, set at
30°C.
Figure 12. Calibration curve of POFHS coated with 7 PAH/SiO2 layers. Measurements were taken at 611nm wavelength, 190µm core diameter and 30mm sensitive region length. RH
[image:14.595.175.413.360.544.2]sensitive to the RH rather than to the temperature. It should be also noted that RH sensor in
environmental chamber saturates at 100% (blue trace, Figure 13a) and cuts the top off the
readings, while the POFHS continuously measures the change in RH. The behaviour of the
environmental chamber RH sensor is most likely due to the error of the accuracy of the RH
sensor which is quoted as ±2.5% and measurement range of up to 98%.
In the third test, the POFHS response was measured for a long period with constant RH and
temperature at 85% and 30°C, respectively. As can be seen in Figure 14a, the POFHS response
is stable compared with the environmental chamber sensor. Using the calibration curve (Figure
12), the POFHS signal can be expressed in terms of RH, Figure 14b. It can be noticed that the
POFHS response is reliable for long term measurements, therefore it can be used for
continuously monitoring wound healing.
In addition, in order to understand behaviour of the plastic optical fibre, an optical fibre with
cladding removed (190µm core diameter) without coating was inserted within the setup during
the long period test. As can be seen in Figure 14a, the response of the unmodified fibre (black
trace) is not stable at fixed values of RH compared with the POFHS signal. This phenomenon
most plausibly is owing to the swelling of the plastic optical fibre. On the other hand, POFHS
[image:15.595.89.509.191.362.2]a) b)
Figure 13. Second test with POFHS with 7 PAH/SiO2 layers within environmental chamber setup. (a) POFHS (red trace) and environmental chamber sensor (blue trace) response to RH
fluctuation for temperature changes. (b) Temperature change from ~25°C to 35°C and vice
(i.e. modified with the sensitive film 7 PAH/SiO2 layers) has stable response, most likely
owing to the protection role that 7 PAH/SiO2 layers play and adsorb water molecules
preventing them from absorption inside the plastic optical fibre.
3.4 In-vivo humidity measurements
The purpose of the in-vivo humidity test was to monitor the RH present on the skin
microenvironment at the palm of the hand to mimic the wound environment. As described in
section 3.2, the study consisted of placing the palm on the measurement chamber as shown in
Figure 5 and monitoring transmittance in order to observe the RH changes within the chamber.
The hand was removed from the top of the chamber after the signal stabilised.
Figure 15 shows the results for the in-vivo humidity measurements on skin for one of the
participants at 611nm wavelength since similar results were obtained with all the volunteers.
Using the calibration curve (Figure 10), the signal obtained from the POFHS can be observed
in terms of RH in order to measure the response time compared with the commercial sensor.
[image:16.595.87.511.152.335.2]a) b)
Figure 14. Third test with environmental chamber setup. (a) Response from POFHS (red trace), environmental chamber sensor (blue trace) and optical fibre without film and core
exposed (black trace) to continuous RH measurement. Temperature and RH constant at
30°C and 90%, respectively for approximately 8hrs. (b) POFHS readings (red trace) in terms
The variation of RH recorded for each participant was from 50 ±5% to 90 ±5%. When
removing the hand from the chamber, a rapid drop in RH occurs due to the difference between
the RH inside the measurement chamber and the environment. This sudden RH change is
observed in both the POFHS and the commercial humidity sensor signals. The hand was placed
again on the chamber after the signal stabilised again. This operation was repeated 3 times in
order to investigate repeatability of the measurements for each volunteer. The settling time,
which is the time for the signal to reach 90% of saturated value was 100 ±3s and 135 ±3s, for
the POFHS and the commercial sensor, respectively. As expected, the same behaviour as for
the in-vitro humidity measurements was observed, i.e. an increase in RH represents a decrease
in light intensity. Again, these response times are limited by the rate of increase of humidity in
[image:17.595.182.420.308.497.2]the chamber and not the response time of the sensors.
Figure 15.In-vivo humidity measurements on the palm of the hand recorded with the POFHS (red trace) and the commercial humidity sensor (blue trace).
In order to further investigate the POFHS response time, a more rapid change in humidity is
provided using a sharp breath on the sensor. Figure 16 displays relative humidity measured at
611nm wavelength for the POFHS (red trace) along with the commercial humidity sensor
response (blue trace) in RH. The response time is calculated as the time from 10% to 90% of
the final recorded value. The POFHS response time recorded was 1.5s, whereas the value
Figure 16. Response time of POFHS and commercial humidity sensor in response to a single breath on both sensors simultaneously.
4. Discussion
The development of a POFHS is reported. Different lengths and core diameter for the sensitive
part of the fibre were investigated. The optimum core diameter and length of the sensitive
region were 190µm and 30mm, respectively, in order to obtain higher sensitivity due to deeper
penetration depth of EW and interaction with the hydrophilic film coated on the unclad central
section of a POF. Smaller core diameters and longer sensitive regions produce a fragile sensor
which tends to easily break.
The physical behaviour of the POFHS against RH changes is related to the film refractive
index. When the sensor is exposed to dry environments, the core refractive index is higher than
the PAH/SiO2 coating refractive index. As a result, the fibre works as a wave-guide and hence
transmittance of light increases. On the other hand, when the sensor is exposed to humid
surroundings, the refractive index of the sensitive PAH/SiO2 section increases until it is higher
than that of the core, hence the light scatters through the film and the transmittance is reduced.
Additionally, the humidity in-vitro measurements were carried out at different RH and
changes. For the humidity test on the palm of the hand, temperature and ambient light did not
affect measurements since both parameters were not significantly changing when placing the
hand on the set up.
In order to achieve a portable set up for practical applications, such as the performance of the
POFHS within a dressing, a photodetector can replace the spectrometer function of collecting
the data from the sensor. The light source that can be also exchanged for an LED in order to
reduce the set up size. This is useful for tele monitoring purposes and to obtain a low-cost
portable device.
Furthermore, as a first step for wound monitoring development, the POFHS has been embedded
on a dressing (sterile, N-A knitted viscose primary dressing, Systagenix Wound Management
Ltd., UK) with dimensions 9.5cm length and 9.5cm width and it was covered by a clinical
gauze used as secondary dressing (non-woven swab clinic gauze, Clinisupplies Ltd., UK) with
dimensions 5cm length and 5cm width in order to observe its feasibility for humidity
measurements, as shown in Figure 17a. In order to observe the POFHS response embedded on
the dressing, the in-vivo humidity experiment was performed for a single volunteer.
Figure 17b shows the response of the POFHS to the RH generated by the palm of the hand. As
it can be seen on the graph, the behaviour of the POFHS is similar to the previous in-vivo test
in section 3.4. Nonetheless, since the POFHS is embedded on the dressing and it is covered by
a clinical gauze, a longer settling time is observed. It should be noted that the response is highly
dependent on the properties of the textile and further work investigating responses of different
wound dressings will form part of future work.
The settling time and the recovery time obtained were ~ 7.7 min and ~ 9.7 min, respectively.
The RH change observed was between 30% ±2% and 95% ±2%. This are encouraging results
in order to develop a dressing that can remotely monitor humidity in the skin microenvironment
Figure 17. (a) POFHS embedded in a dressing and covered by a clinical gauze as a secondary dressing for humidity measurements. The unclad visible part of the sensor is
30mm length. (b) In-vivo humidity measurements on the palm of the hand recorded with the
POFHS embedded on a dressing and covered with a clinical gauze as secondary dressing.
Moreover, in future generations of the device, the sensor might be incorporated into a smart
wound dressing that can control the temperature and humidity of the wound microenvironment.
For example, the device could take a similar form to a vacuum assisted closure (VAC) system,
in which a feedback loop is created to control humidity levels [26].
5. Conclusion
In this work, it has been demonstrated that a POF coated with PAH/SiO2 layers on the exposed
core can be used as a humidity sensor. A higher RH sensitivity can be obtained by optimising
the film thickness depositing 7 PAH/SiO2 layers which is close to but lower than the EW
penetration depth. The sensitivity demonstrated for 7 layers deposited was -3.87x10⁻³ and
-9.61x10⁻³ in transmittance percentage per RH percentage for the range of ~10% to ~75% RH
and 90% to 97% RH, respectively.
The deposition of SiO2 nanoparticles as a sensitive element has provided pilot data to illustrate
its efficiency in the detection of humidity. The RH measurements in the in-vivo tests suggest
that the POFHS developed can be used as a humidity sensor of the human skin. The POFHS
response time is in the order of 1.5s compared to the commercial humidity sensor of 3.1s, for
breath monitoring (rapid RH changes). In addition, for measurements on skin, the POFHS
average settling time observed was 1.6 min, faster than settling time recorded by the
commercial sensor (approximately 2.6 min). Further, the POFHS feasibility to be integrated
within a dressing was tested by embedding the POFHS into a textile. The results obtained
suggests that a POFHS within a dressing can be developed in order to monitor moisture in
wounds.
The development of POFHS is a novel technology that provides a faster response, compared
with a commercial humidity sensor. The POFHS advantages are flexibility, ease of
incorporation into dressings and immunity to electromagnetic fields. This new and reliable
unobtrusive approach for humidity sensing is potentially extremely helpful for providing
improved monitoring of wound status. If successful it will be of increased benefit for patients
and offers the potential to allow a better understanding about the process of wound healing
itself.
Acknowledgements
Funding was obtained from the Engineering and Physical Sciences Research Council (grant
number EP/K503800/1). David Gomez was funded by the National Council on Science and
Technology of Mexico (CONACYT). We would also like to thank Prof William Jeffcoate and
Alison Musgrove of Nottingham University Hospitals NHS Trust for valuable clinical
discussions.
References
[1] F. U. Hernandez, S. P. Morgan, B. R. Hayes-Gill, D. Harvey, W. Kinnear, A. Norris, D.
Evans, J. G. Hardman and S. Korposh, “Characterization and Use of a Fiber Optic Sensor
Based on PAH/SiO2 Film for Humidity Sensing in Ventilator Care Equipment,” IEEE
[2] G. D. Winter, “Formation of the Scab and the Rate of Epithelialization of Superficial
Wounds in the Skin of the Young Domestic Pig,” Nature, vol. 193, pp. 293-294, 1962.
[3] J. F. Guest, N. Ayoub, T. Mc Ilwraith, I. Uchegbu, A. Gerrish, D. Weidlich, K. Vowden
and P. Vowden, “Health economic burden that wounds impose on the National Health
Service in the UK,” BMJ Open, vol. 5, no. 12, pp. 1-8, 2015.
[4] L. G. Ovington, “Advances in wound dressings,” Clinics in dermatology, vol. 25, pp.
33-38, 2007.
[5] K. Cutting, R. White, P. Mahoney and K. Harding, Clinical identification of wound
infection: a Delphi approach, London: European Wound Management Association
(EWMA) Position Document, 2005.
[6] G. S. Schultz, R. G. Sibbald, V. Falanga, E. A. Ayello, C. Dowsett, K. Harding, M.
Romanelli, M. C. Stacey, L. Teot and W. Vanscheidt, “Wound Bed Preparation: A
Systematic Approach to Wound Management,” Wound Repair And Regeneration, The
International Journal of Tissue Repair and Regeneration, vol. 11, pp. 1-28, 2003.
[7] M. Dyson, S. Young, C. L. Pendle, D. F. Webster and S. M. Lang, “Comparison of the
Effects of Moist and Dry Conditions on Dermal Repair,” The Journal of Investigative
Dermatology, vol. 91, pp. 434-439, 1988.
[8] T. Abdelrahman and H. Newton, “Wound dressings: principles and practice,” Surgery,
vol. 29, no. 10, pp. 491-495, 2011.
[9] M. A. Fonder, G. S. Lazarus, D. A. Cowan, B. Aronson-Cook, A. R. Kohli and A. J.
Mamelak, “Treating the chronic wound: A practical approach to the care of nonhealing
wounds and wound care dressings,” Journal of the American Academy of Dermatology,
vol. 58, no. 2, pp. 185-206, 2008.
[10] K. F. Cutting and R. J. White, “Maceration of the skin and wound bed 1: its nature and
causes,” Journal of wound care, vol. 11, no. 7, pp. 275 - 278, 2002.
[11] T. Yeo, T. Sun and K. Grattan, “Fibre-optic sensor technologies for humidity and
moisture measurement,” Sensors and Actuators A: Physical, vol. 144, no. 2, pp. 280-295,
[12] S. D. Milne, P. Connolly, H. Al Hamad and I. Seoudi, “Development of Wearable
Sensors for Tailored Patient Wound Care,” in Engineering in Medicine and Biology
Society (EMBC), 2014 36th Annual International Conference of the IEEE, 2014.
[13] G. Mattana, T. Kinkeldei, D. Leuenberger, C. Ataman, J. J. Ruan, F. Molina-Lopez, A.
Vásquez Quintero, G. Nisato, G. Tröster, D. Briand and N. F. de Rooij, “Woven
Temperature and Humidity Sensors on Flexible Plastic Substrates for E-Textile
Applications,” IEEE Sensors Journal, vol. 13, no. 10, pp. 3901-3909, 2013.
[14] R. Soukup, A. Hamacek, L. Mracek and J. Reboun, “Textile Based Temperature and
Humidity Sensor Elements for Healthcare Applications,” in 37th International Spring
Seminar on Electronics Technology (ISSE), Dresden, Germany, 2014.
[15] D. Gomez, S. P. Morgan, B. R. Hayes-Gill and S. Korposh, “Polymeric fibre optic sensor
based on a SiO2 nanoparticle film for humidity sensing on wounds,” in Sixth European
Workshop on Optical Fibre Sensors, Limerick, Ireland, 2016.
[16] S. K. Khijwania, K. L. Srinivasan and J. P. Singh, “An evanescent-wave optical fiber
relative humidity sensor with enhanced sensitivity,” Sensors and Actuators B: Chemical,
vol. 104, no. 2, pp. 217-222, 2005.
[17] F. S. Ligler and C. Rower Taitt, Optical Biosensors: Today and Tomorrow, Oxford:
Elsevier, 2008.
[18] B. D. Gupta and Ratnanjali, “A novel probe for fiber optic humidity sensor,” Sensors and
Actuators B: Chemical, vol. 80, pp. 132-135, 2001.
[19] L. Xu, J. C. Fanguy, K. Soni and S. Tao, “Optical fiber humidity sensor based on
evanescent-wave scattering,” Optics Letters, vol. 29, no. 11, pp. 1191-1193, 2004.
[20] K. S. C. Kuang, S. T. Quek, C. G. Koh, W. J. Cantwell and P. J. Scully, “Plastic Optical
Fibre Sensors for Structural Health Monitoring: Areview of recent progress,” Journal of
Sensors, vol. 2009, pp. 1-13, 2009.
[21] S. Korposh, T. Wang, S. James, R. Tatam and S.-W. Lee, “Pronounced Aromatic
Fibre Long Period Grating,” Sensors and Actuators B: Chemical, vol. 173, pp. 300-309,
2012.
[22] T. R. Dargaville, B. L. Farrugia, J. A. Broadbent, S. Pace, Z. Upton and N. H. Voelcker,
“Sensors and Imaging for Wound Healing: A Review,” Biosensors and Bioelectronics,
vol. 41, pp. 30-42, 2013.
[23] D. Viegas, J. Goicoechea, J. L. Santos, F. Moita Araujo, L. A. Ferreira, F. J. Arregui and
I. R. Matias, “Sensitivity Improvement of a Humidity Sensor Based on Silica
Nanospheres on a Long-Perios Fiber Grating,” Sensors, vol. 9, pp. 519 - 527, 2009.
[24] S. Korposh, S. James, R. Tatam and S.-W. Lee, “Fibre-Optic Chemical Sensor
Approaches Based on Nanoassembled Thin Films: A Challenge to Future Sensor
Technology,” Current Developments in Optical Fiber Technology, pp. 237-264, 2013.
[25] J. Bravo, L. Zhai, Z. Wu, R. E. Cohen and M. F. Rubner, “Transparent Superhydrophobic
Films Based on Silica Nnaoparticles,” Langmuir, vol. 23, no. 13, pp. 7293-7298, 2007.
[26] K. V. Lambert, P. Hayes and M. McCarthy, “Vacuum Assisted Closure: A review of
development and current applications,” European Journal of Vascular and Endovascular