INCOME SUPPORT
AND WORK INCENTIVES:
IRELAND AND THE UK
Copies of this paper may be obtained from The Economic and Social Research Institute (Limited Company No. 18269). Registered Office: 4 Burlington Road, Dublin 4.
Price IR£12.00
INCOME SUPPORT
AND WORK INCENTIVES."
IRELAND AND THE UK
Edited by Tim Callan
© THE ECONOMIC AND SOCIAL RESEARCH INSTITUTE, DUBLIN, 1997
Dedication
Mary McElhone
CONTENTS
Chapter
I
4
5
6
Acknowledgements Preface
WORK INCENTIVES, TAXES AND TRANSFER PROGRAMMES
lan Walker
SWITCH: THE ESRI TAX-BENEFIT MODEL
Tim Callan
MAKING WORK PAY: THE OECD STUDY OF TAXES, BENEFITS, EMPLOYMENT AND UNEMPLOYMENT
Mark Pearson and Edward Whitehouse
INCOME SUPPORTS IN IRELAND AND THE UK
Tim Callan and Holly Sutherland
MICROSIM ULATION ANALYSES OF TAXES, BENEFITS AND FINANCIAL RETURNS TO EMPLOYMENT: UNITED KINGDOM, 1993-94
Alan Duncan and Christopher Giles
MICROSIMULATION ANALYSES OF REPLACEMENT RATES IN IRELAND
Tim Callan and Brian Nolan
Page
vii
18
32
83
I06
Acknowledgements
The papers included in this publication were first presented at a conference co-hosted by the ESRI and the Foundation for Fiscal Studies in
September 1996. The authors would like to thank the Minister for Social Welfare, Proinsias de Rossa, for opening the conference, and all those who assisted in its organisation. Particular thanks are due to Frances Ruane of the Foundation for Fiscal Studies and to Kieran Kennedy, Brendan Whelan and John Fitz Gerald of the ESRI for their help. Thanks are also due to Patrick Honohan, Gerry Hughes and to participants at the conference for helpful comments.
The organisational burden for the conference fell largely on Mary Cleary, Patricia Byrne and Charlie O’Regan. Conference documentation was copied with customary skill and efficiency by Pat Hopkins.
PREFACE
The papers gathered together in this volume were originally presented at a conference in September 1996, co-hosted by The Economic and Social Research Institute and the Foundation for Fiscal Studies. The theme of the conference was to examine the r61e of the tax/transfer system in providing income supports, while minimising negative consequences for work incentives - one of the issues highlighted in the recent report of the Expert Working Group on the Integration of the Income Tax and Social Welfare Systems (1996). The conference papers focused particularly on what could be learned from tax-benefit models, which deal with the consequences of tax and benefit policy changes at individual and family level; and on what could be learned by comparisons of the Irish and UK situations.
The rationale for using microsimulation models - i.e., models which are based on detailed data for a representative sample of households and individuals, and which simulate the impact of actual or potential tax and benefit policies on that sample - is set out in Chapters 1 (Walker) and 2 (Callan). ,.qWITCH, the ESRI tax-benefit model is now capable of very similar analyses to those undertaken with the most widely used UK models (POLIMOD, from the Microsimulation Unit in Cambridge, and TAXBEN, from the Institute for Fiscal Studies). These models represent a major advance on earlier methods of assessing tax and benefit policy changes, which relied on a small number of supposedly "typical" cases, but could be highly misleading. Chapter I illustrates how this approach can be further developed, to take into account estimates of the labour supply responsiveness of particular groups to tax and benefit policy changes,
At international level, the recent OECD Jobs Study (OECD, 1995) highlighted tax/transfer systems as one of the key areas where policy changes could help to reduce unemployment and stimulate employment. A further OECD study, examining these issues in more depth, contributed both directly and indirectly to the present volume. Chapter 3 (Pearson and
Whitehouse) summarises the overall results, which help to put the Irish and UK tax-transfer systems into a broader perspective, and provide the latest insights from OECD work into the complex relationships between taxes, benefits, employment and unemployment.
The last three chapters undertake more detailed bilateral comparisons of the tax and transfer systems, and the pattern of work incentives for Ireland and the UK The work in Chapters 5 (Duncan and Giles) and 6 (Callan and Nolan) is based on, and develops further, the contributions from the national microsimulation models to the OECD project. Chapter 4 (Callan and Sutherland) draws on a work done as part of the exploratory phase for EUROMOD, a tax-benefit model for European Union countries (Sutherland, 1996).
The Irish and UK tax/transfer systems have much in common, reflecting historic and continuing links between the two countries. But the relative levels of income support provided by the Irish and UK systems have changed quite dramatically in recent decades. For example, in 1978, a three-child family on Unemployment Assistance would have received just under half the average wage in manufacturing in Ireland, while a similar UK family would have received up to 60 per cent of the average UK wage. By 1994, payments under the UK safety-net scheme had fallen to 43 per cent of the average wage, while payments under the Irish scheme had risen to close to 60 per cent of the average Irish wage. Callan and Sutherland (Chapter 4) set out some of the main changes in tax and transfer policy in the two countries, and explore some of the issues arising from these changes.
Much of the analysis in Chapters 5 (Duncan and Giles) and 6 (Callan and Nolan) is based on "static" microsimulation modelling. These analyses document the pattern of incentives faced by individuals in their current situation, using "replacement rates" and "average effective tax rates" - summary measures of the financial incentive to work, based on simulations of the incomes individuals would receive in and out of work. Individuals may respond to high marginal tax rates by reducing or increasing their hours of work to avoid them: under these circumstances, high marginal tax rates may simply not be observed. But unemployed
individuals facing high average tax rates (or high replacement rates) cannot avoid them in this way, and high average tax rates will be observed. Thus, replacement rates and average effective tax rates can be used, as in these chapters, to provide a comparison of the financial incentive to work faced in Ireland and Britain by different sub-groups of the population.
Overall, the results of the bilateral comparisons in Chapters 4, 5 and 6 can be seen as indicating that changes in Irish and UK tax and transfer policies over the past two decades have tended to increase the relative level of income support in Ireland, and disimprove the financial incentive to work in Ireland relative to that in the UK. Unemployment in Ireland rose more rapidly than in the UK over the past two decades, but rates of income poverty rose much more sharply in the UK than in Ireland. While the papers gathered here can contribute to our understanding of such changes, a great deal of further work is needed - particularly on the responsiveness of labour market participation, unemployment and employment to tax and welfare policy changes - to improve our understanding and guide policy changes in future.
Chapter 1
WORK INCENTIVES, TAXES AND TRANSFER PROGRAMMESI
lanWalker
1.1 Introduction
The analysis of the impact of tax and welfare reforms has advanced rapidly in the last fifteen years. In the early 1980s it was typical to evaluate reforms, if at all, by using simple arithmetic on a small number of hypothetical households. This first generation approach was shown to be woefully inadequate by work associated with the Institute for Fiscal Studies (IFS - see, for example, Dilnot, Kay and Morris (1984)) and the Suntory Toyota International Centre for Economics and Related Disciplines (STICERD) at the London School of Economics (see, for example, Atkinson, King and Sutherland (1983)). This body of research replaced the small number of hypothetical households with a large number of real ones and exploited the power and flexibility of modern microcomputers, and the availability of detailed household surveys, to achieve a great deal more sophistication in the analysis as well as a quantum leap in its credibility. Recent work in Ireland (see Callan et al. (1996)) and Australia (see Harding (1995)) has replicated this second generation microsimulation
~This paper is based on joint research with Paul Bingley at the Centre for Labour Market Studies at the University of Arhus. I am grateful to the European Union Training and Mobility of Researchers programme for supporting a research fellowship that facilitated the writing of this paper, and the Economic and Social Research Council for their support for the Centre for the Microeconomic Analysis of Fiscal Policy at the Institute for Fiscal Studies which has been a focus for much of my labour market research. The data has been made available with the permission of the Controller of Her
2 INCOME SUPPORT AND WORK INCENTIVES
methodology pioneered by the IFS and STICERD researchers for other countries.
However, even this second generation microsimulation approach has many limitations and these need to be borne in mind when evaluating their findings. Among other problems the approach makes extreme assumptions about the incidence of taxes, transfers and subsidies and about the impact of the induced changes in wages and incomes on labour market behaviour. Moreover, they will not be able to capture the full complexity of all potential refornls because of shortcomings in the data, and they typically make no allowance for possible macroeconomic effects of reforms.
The importance of these shortcomings will depend on the precise question being asked and the nature of the environment where the reform is being implemented. In some cases existing simulation routines (such as ESRI’s SWITCH, IFS’s TAXBEN2 and others) seem likely to yield reasonable approximations to the effects of reforms - for example, reforms to relatively competitive economies, which are close to revenue neutral, and which do not have sizeable effects of the marginal wages and the relative prices that agents face seem likely to be good candidates for the likes of SWITCH and TAXBEN2. However, there will be other cases where reforms are specifically intended to generate incentive effects where these non-behavioural simulation models are not likely to capture the effects of the reform very well - unless, of course, the elasticity of
behaviour to changes in incentives is actually small.2
There are several third generation policy simulation models which are specifically designed to allow for the behavioural effects of the reform -indeed, these are typically motivated by a desire to measure the magnitude of such effects in order to evaluate the incentive effects of reforms.3 The essence of these third generation models is that they embed econometric
2 If that were the case, however, there would not be much point in implementing reforms designed to address an unimportant problem.
WORK INCENTIVES, TAXES AND TRANSFER PROGRAMMES 3 estimates of some feature of the behaviour of agents which are of interest:
typically this would be an estimated labour supply equation to capture the effects of income tax (or income support) reforms on work incentives. While there are many examples in the literature where econometric models have been estimated and the resulting estimates used to predict the impact of some policy change (see Hausman (1981) and Hoynes (1996) for example), there are relatively few examples where the locus has been to develop a simulation model that could easily be used to analyse any desired reform. The earliest work that relates to work incentives specifically is the simulation model known as SPAIN (Simulation Programme for the Analysis of Incentives) developed in conjunction with Elizabeth Symons exploiting much of the computer code in an early version of TAXBEN and econometric estimates provided in Blundell and Walker (1986). Examples of its use are in Symons and Walker (1986), and Blundell, Meghir, Symons and Walker (1989). The simulation routine has subsequently been developed at IFS by Alan Duncan.4 The model we use here as an illustration is one of the labour supply of lone mothers in the UK.5 One of the major issues is the analysis of incentives in the UK and US (see also Callan et al. (1995) for Ireland) is the extent to which in-work transfer programmes can be used to outweigh the disincentive effects of out-of-work transfers. Our results provide hard evidence that is encouraging: we find that the UK in-work transfer (Family Credit) is quite effective at enconraging lone mothers to work, and has little adverse effect on the incentive to work long hours. Indeed, Family Credit would be all the more effective if its low take-up rate could be improved.6
While such third generation work allows, in principle, quite detailed predictions of the labour market effects of reforms it is important to bear in mind that these predictions will be subject to considerable uncertainty.
4 Now rewritten in GAUSS and referred to as SPAIN II. An example of its use can be found in Duncan (1991).
5 See Blundell (1992) for a general review of labour supply issues, including references to other studies of the labour supply of lone mothers.
4 INCOME SUPPORT AND WORK INCENTIVES
There is uncertainty associated with using samples of the population which may be quite small samples in some areas of the population - for example, minority groups such as high income households, containing taxpayers who pay high marginal rates, will typically be under-represented in household survey data. In addition to this, third generation studies are based on econometric models of individual labour market behaviour and the estimates in these models are often subject to large standard errors adding further to the potential for predictions to be imprecise.
Nevertheless, it is the fact that third generation models provide hard evidence that is important. All too often, policy proposals have been based on a view of the world based more on prejudice, ignorance or hope than a detached evaluation of evidence. A recent report of the Social Security Advisory Committee (1994) concluded that:
Most unemployed people ... are anxious to return to the labour force at almost any price which does not leave them poorer than the benefits they received while unemployed.
It is difficult to envisage a statement that is more at variance with the available empirical evidence (see Atkinson and Micklewright (1991). Despite their inability or willingness to grasp how the labour market works the report goes on, on the same page, to add that:
... we do not believe that this [a disregard of maintenance in Income Support] would have any influence on decisions about taking employment or remaining on income support.
That such a policy would increase the replacement rate for parents bringing up children alone because maintenance payments count as income for purposes of computing Income Support entitlement was acknowledged earlier in the report.7
The Committee could hardly have been more confusing in its attempt to argue in favour of its own prejudices for reform. The importance
7The report referred to the decision to allow a maintenance disregard in the Family Credit (an in-work benefit) rules which would increase the net incomes of FC recipients
(who, by definition, work) as major steps forward in removing disincentives for lone
parents. See Bingley, Lanot, Symons and Walker (1995) for an evaluation of the
WORK INCENTIVES, TAXES AND TRANSFER PROGRAMMES 5 of the third generation methodology is that it clears away such confusions and prejudice and replaces it with scientific predictions - albeit statistically imprecise ones.
This strength of the third generation methodology reveals a weakness in second generation work which is important to realise. That is, second generation work allows one not only to compute net income pre-and post-reform, which one might regard as a short-run first round effect, but also allows one to compute the marginal tax rates (or replacement rates, in the case of the unemployed) that individuals face. One might then be tempted to evaluate reforms on the basis of, not just the effects on the distribution of net incomes, but also on the number of individuals facing high marginal tax rates. The argument behind this is that the efficiency loss of a tax is proportional to the square of the tax rate. However, the argument ignores the fact that, if the labour supply behaviour of individuals were relatively sensitive to the marginal tax rate, so that disincentive effects were important, then they would not choose to be in positions where they faced high marginal rates. Indeed, if we observe that a high proportion of the population are in positions where they do face high marginal rates then this would be evidence that their behaviour was actually not very sensitive to this and therefore the disincentive effects of high marginal rates could be said to be unimportant.8 Evaluating the incentive effect of reforms by counting the number of people facing high marginal rates is not a well-found approach.
Moreover, if it is the case that individuals put some value of their "leisure" time (which induces then to forgo more of it when the net return for doing so is higher) then the implications of reforms which change net incomes and change the amount of leisure that individuals consume for the well-being of individuals cannot be evaluated by net income alone. One needs to know how individuals value their time in order to know how to price the reform-induced change in the amount that they enjoy.
INCOME SUPPORT AND WORK INCENTIVES
Thus, a second generation approach to the analysis of tax reforms should be regarded as a stepping stone towards more sophisticated and useful work.
1.2 Labour Supply Theory
Computing the impact of tax and benefit reforms on the labour market behaviour of individuals requires a knowledge of the determinants of that behaviour. Economic theory9 suggests that individuals are more likely to work longer hours the poorer they are (for example, the less unearned income they have) because the need for earned income to finance an adequate level of consumption will be correspondingly higher. Thus, one might expect women with poor working husbands to be more likely to work and more likely to work full-time as opposed to part-time than an otherwise identical woman with a richer husband (on the assumption that the wife regards her husband’s earnings as her unearned income~°). Economic theory also suggests that individuals working low hours would work longer hours if the wage increased because the return to working longer had risen; this "incentive" or substitution effect outweighs the effect that a higher wage has on reducing one’s need for higher income because earnings at the existing level of hours will have risen (this latter effect is known as the income effect). On the other hand, individuals working long hours may find that a wage rise causes such a large increase in earnings at the existing level of hours that they would rather reduce hours - that is they would trade some of their additional income for additional "leisure". In this case the income effect outweighs the substitution effect and labour supply (hours of work) falls in response to a wage rise.
WORK INCENTIVES, TAXES AND TRANSFER PROGRAMMES 7 income at the existing hours (unless hours are zero) and this has an income effect which tends to reduce hours. Thus the net effect depends on the relative strengths of these two effects - the income effect will be stronger at high hours. So at low hours we would expect a wage rise to raise hours, and at high hours we might expect a wage rise to induce a labour supply fall, i.e., backward bending labour supply.
These propositions can be derived from the assumption that individu’..ds do the best they can given the constraints that they face (i.e., that they are rational - or at least not systematically irrational). More precisely, it is assumed that an individual will maximise (or, behave as if they maximise) a utility function which describes his/her preferences,~ by choosing the level of hours of work (h) and the level of net income or consumption 0’) subject to the economic constraint the individual faces that consumption expenditure equals earned plus unearned income (i.e.,
y=w.h + la where w is the wage per hour and I1 is the level of unearned
income). The utility function describes precisely how willing the individual is to trade more leisure for less consumption and is therefore a function of both, i.e., U = U(y,h: Z) and of Z, a vector of characteristics that affect preferences (such as the number and ages of dependent children in the household, say).
The solution to this problem defines the labour supply equation,
h = h(w,H; Z) which indicates precisely how hours of work depend on the
economic factors that determine the nature of the economic constraints that individuals face, and on Z, a vector of individual characteristics that affect preferences (for example, the number and ages of dependent children).
However, the theory itself does not tell us any more than this. In particular, it does not tell us how strong these income and substitution effects might be in practice. This requires that we attempt to estimate the sizes of these effects by investigating the relationship between hours of work (and labour force participation) and the levels of the wage and unearned income for a large sample of individuals. The empirical literature
8
INCOME SUPPORT AND WORK INCENTIVESon labour supply is, at least for the US, voluminous. In the UK a relatively
small number of studies have been conducted (see Blundell (1992) for a
short survey). It is traditional to summarise the findings of labour supply
studies in the form of wage and income elasticities, which show the effects
of a 1 per cent change in wage and in unearned income, respectively, on
hours of work. Typically, it is found that the labour supply elasticities for
males are very small (see Pencavel (1986)) while those for women are
somewhat larger.~2
1.3 An Empirical Example
Here we illustrate the theory with empirical estimates of the labour
supply of UK lone mothers. These are an interesting group because: their
numbers have risen dramatically, their attachment to the labour force has
fallen dramatically, and they attract much policy interest in many countries.
The difficulty with this group is that the budget constraints faced by
UK lone mothers are likely to take a complicated piecewise-linear form
with two important non-convexities due to the Family Credit system - one
due to the notch at 24 hours interacting with the 100 per cent tax faced by
those on Income Support, and one arising from eligibility ceasing as
earnings rise.13There are severe difficulties associated with estimating a
model that allows for the possibility of continuous hours substitution~4 in
~2 However, recent work suggests that the larger elasticity for women arises partly because of the effect of wages and income on labour force participation rather than on hours of work for participants. Methods that allow for economic variables to have different effects on hours than on participation tend to have smaller elasticities compared to methods which restrict participation and hours to have the same responsiveness to economic variables. See B lundell (1992) and M roz (1987).
WORK INCENTIVES, TAXES AND TRANSFER PROGRAMMES 9 the face of such complex budget constraints. Our approach follows much of the literature on sit’nultaneous labour supply and programme participation modelling and approximates the continuous choice with a choice among discrete alternatives. Each alternative is characterised by some specific hours level and individuals choose between these alternatives. Though obviously an approximation, one could argue that choice between discrete hours offers is an empirical regularity, and modelling hours as a continuous choice may, in fact, be a mis-specification.
The model applied here is an extension to the Random Utility
Model introduced by Hausman and Wise (1978) and is detailed in Bingley
and Walker (1996). Labour market behaviour is driven, in our modelling, by the level of net income corresponding to each labour market state.~5 The estimates allow us to compute probabilities of being in each labour market state for each individual, which then allow us to evaluate refomls by computing these probabilities pre- and post-refon’n.
In order to address the question of the effects of economic opportunities on labour market behaviour we need to compute exactly what these opportunities might be. We use predicted gross wages to generate income levels at each labour market state via a version of the IFS tax/benefit program which also computed out-of-work income. The essential structure of the model is that the probability of choosing a position is a cumulative Normal transformation of the utility differences between labour market states - and these, in turn, are assumed to be a linear function of the income differences. In contrast to ’all of the existing published work we also allow for there to be non-takeup of Family Credit
10 INCOME SUPPORT AND WORK INCENTIVES
and for non-workers to be involuntary unemployed as well as voluntary non-participants.
We approximate the budget constraint by just four discrete points which we think of as labour market non-participation (NP), part-time work (PT) and full-time (FT) work~6 where part-time workers may choose to participate in FC (PT(I)) or not (PT(0)). Since FC entitlement at zero hours is zero and is typically small at full-time hours, and since the participation rates for IS and HB are close to 100 per cent for lone parents we assume that FC participation is the only welfare participation issue, and even then only at the part-time position.
The Family Expenditure Survey (FES) asks those with zero hours in the labour market whether they are actively looking for a job and we use this infomlation to discriminate between voluntary non-participation and involuntary unemployment. This is important because individuals who are involuntary unemployed are not observed to be in their most preferred state, and must be classified appropriately in a choice model. This group is assumed to reveal that some positive hours state is preferred to zero. Individuals observed in zmy positive hours labour market state are assumed to prefer their observed state to all alternatives and are not rationed in exercising this preference.
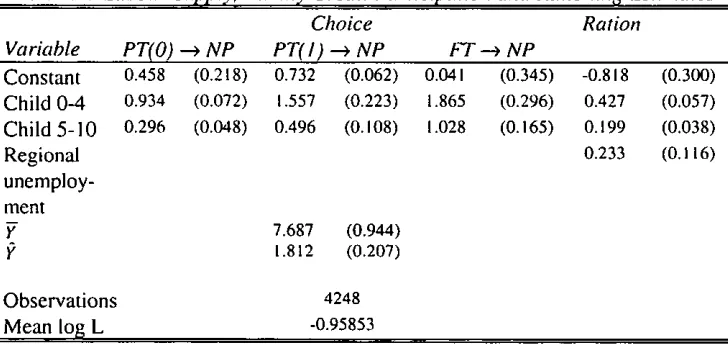
Selected results are given in Table 1.1.~7 PT(0) is part-time with FC non-participation, PT(I) is part-time work with FC participation. The maintained hypothesis is that individuals know what their budget constraints look like. Despite the importance of this assumption, it has proved difficult to test and attempts to allow for it have been made in the
16We define these as: usual weekly hours less than 15, between 15 and 34, and 35 or greater, respectively. We then compute their incomes at zero hours, 24 hours and 40 hours. An important criticism of discrete choice modelling is the arbitrary nature of the definition of the alternatives. Sensitivity of the estimates to different definitions of what constitutes part-time and full-time was tested. The parameters were not significantly affected by the definition of part-time but the full-time criteria of 35 hours is obviously more crucial since increasing this brings the "full-time" hours peak into the pan-time definition.
WORK INCENTIVES, TAXES AND TRANSFER PROGRAMMES I I simplest of cases. Thus, it is important to bear these points in mind when interpreting the parameters.
Indeed, leaving these issues aside, the interpretation of the parameters is less than transparent since they tell us about the impact of characteristics on the probability of choosing one state rather than the default (of voluntary non-participation). Thus the constant terms tell us what the utility rise would be of a move to voluntary non-participation for the defauh individual, while the coefficients on the characteristics tell us how different individuals depart from this default.~8 Thus, denoting utility as uO,,h, PP) where y is income, h is hours of work, and PP is an indicator of FC programme participation, it is interesting to derive the utility difference associated with FC programme participation as
U(y, PT, I ) - U(y, PT,0) = I U(y, PT, I ) - U(y, NP, O)] - I U(y.PT;O) - U(y.NP.O)]
which for the default individual is 0.274 (=0.732-0.458). In order to put some perspective on this figure we need to compare it with the utility gain associated with an additional pound on income (the coefficient on Y in Table I.I divided by 100) which is estimated to be 0.077. Thus, we can infer that the utility loss associated with participating in FC is, for given income, the same as the utility loss associated with a reduction in income of £3.56 (i.e., 0.274/0.077) which can be thought of as psychic (stigma) costs or real (transaction) costs. The association between low take-up probabilities and low entitlements is generating this resul! and our interpretation is consistent with the maintained hypothesis that individuals do not suffer from any imperfect information with respect to their budget sets. If imperfect information were the problem behind low take-up we would not expect a correlation with the level of entitlement (unless imperfect information is endogenous in which case it begins to sound like a transactions costs explanation). We can compute this figure for ’,all individuals in the data and we find that the average utility loss from FC participation is £5.91 (s.d. = 1.47).
12 INCOME SUPPORT AND WORK INCENTIVES
We can also use the estimates to infer the utility loss associated with working. That is, we can compute the loss associated with part-time work as U(y, PT, O) - uO,,NP, O) which, again by comparing it with the utility gain associated with an additional pound of income, implies that part-time work reduces utility by an average of £16.34 (s.d. = 2.77). Similarly, full-time work reduces utility by £26.93 (s.d. = 4.86), and the average utility loss from rationing is £10.67 (s.d. = 3.50). Note that although the standard deviations around these estimated means are high the distributions are highly skewed and there are, in fact, no instances where the value falls to
[image:21.506.77.441.246.418.2]zero.
Table 1. I: Labour Supply, Famil), Credit Participation and Rationin~ Estimates
Choice Ration
Variable PT(O) ~ NP PT( I ) ----) NP FF ---) NP
Constant Child 0-4 Child 5-10 Regional unemploy-ment
0.458 (0.218) 0.732 (0.062) 0.041 (0.345) -0.818 (0.300) 0.934 (0.072) 1.557 (0.223) 1.865 (0.296) 0.427 (0.057) 0.296 (0.048) 0.496 (0.108) 1.028 (0.165) 0.199 (0.038) 0.233 (0.116)
7.687 (0.944) 1.812 (0.207)
Observations 4248
Mean log L -0.95853
Thus the estimates suggest that the economic framework appears to be broadly supported by the data in that there is a utility loss associated
with FC programme participation, there is a gain associated with additional income, and there is a loss associated with additional work.
WORK INCENTIVES, TAXES AND TRANSFER PROGRAMMES 13 disappear, and as MFC increases more and more individuals become entitled and the levels of entitlement rise. In Figure I.I we show the effect of variations in the MFC on the proportion of individuals in each category.
Doubling the MFC effectively: reduces voluntary non-participation by about 10 percentage points from a base of 66.1 per cent, increases the involuntary unemployed (because more individuals wish to work the higher is FC), reduces PT workers who do not participate in FC (PT(0)) because participation is more attractive the greater is the level of entitlement, increases PT(I) for the same reason, and FT also rises (even more so than PT(1)) because of greater income at FT hours (as well as at PT hours).19 Eliminating FC by setting MFC to zero has the opposite effects although not symmetrically so.
One might hope that, by reducing expenditure on IS, increasing the MFC would be relatively inexpensive. Figure 1.2 shows that FC expenditure rises (falls) steeply as MFC rises from its existing level and that this offsets the additional cost by around 40 per cent through rising income tax and NI and falling IS. Note that abolishing FC altogether reduces FC expenditure to zero from its current (1992 on lone parents) cost of approximately £350m. However, the impact of reducing the MFC on total government expenditure (tax and NI less benefits payments) leads to a reduction in total expenditure as MFC falls to around £35 per week but that governlnent expenditure rises as MFC falls below this point. The reason for this is that a small reduction in MFC causes a large rise in non-participation and hence additional Income Support expenditure, while a larger drop causes full-time work to begin to rise and FC participation falls steeply as entitlements get very small.
14 INCOME SUPPORT AND WORK INCENTIVES
Figure I. I : Simulated Labour Market and Programme Participation
Effects of Variations in Maximum Family Credit
Lobour Supply Chonge oo
.0.-"
go
2 7 s
t(O) ..Q
LJ I "~-- pT( 1 )
R ~ ,~__ FT
\
(~_ r J I I r r r ~3~
I 20 40 60 80 I OO 120 140 160
MFC (pounds/week)
Figure 1.2: Simulated Effects of Variations in Maximum Family Credit on Government Expenditure
Government Expenditure Chonge o
Io/
-- -- -- e ~
r i i i i . i
WORK INCENTIVES, TAXES AND TRANSFER PROGRAMMES 15
1.4 Conclusion
This paper was motivated by the desire to demonstrate the power of third generation methods for analysing tax and welfare reforms. The essential ingredient is some model of labour market behaviour. The results
are extremely important for public policy and could only have been demonstrated with third generation methods.
There are two important findings. First, we show that an increase in FC has a large impact on the probability of taking up part-time work and some impact on wanting (but not being able) to participate but essenti~ly no adverse effect on the probability of working full-time. Thus, FC seems to contribute to overcoming the unemployment trap without inducing a serious poverty trap problem for those already in work. Second, however, we find evidence of not inconsiderable "stigma" (and/or other costs) which implies that FC is not as effective at countering the disincentive effect of the Income Support programme or at countering poverty amongst the working poor as it might otherwise. If it were possible to simply eliminate the costs associated with claiming FC this would have an important impact on the labour force non-participation rate for lone mothers and would imply large savings in government expenditure on Income Support for non-working lone mothers.
REFERENCES
ATKINSON, A.B., and J. MICKLEWRIGHT, 1991. "Unemployment Compensation and Labour Market Transitions: A Critical Review",
Journal of Economic Literature, Vol. 29, pp. 1,679-1,727.
ATKINSON, A.B., M.A. KING, and H. SUTHERLAND, 1983. "The Analysis of Personal Taxation and Social Security", National
Institute for Economic Research, pp. 63-74.
16 INCOME SUPPORT AND WORK INCENTIVES
BINGLEY, P., and I. WALKER, 1996. Labour Supply, Unemployment and Participation in In-Work Transfer Programmes, mimeo, IFS. BLUNDELL, R.W., 1992. "Labour Supply and Taxation: A Survey",
Fiscal Studies, Vol. 3, pp. 15-40.
BLUNDELL, R.W., A. DUNCAN, and C. MEGHIR, 1992. "Taxation in Empirical Labour Supply Models: Lone Mothers in the UK",
Economic JounTal, Vol. 102, pp. 265-278.
BLUNDELL, R.W., A. DUNCAN, and C. MEGHIR, 1996. Estimating Labour Supply Responses Using Tax Reforms, mimeo, IFS.
BLUNDELL, R.W., J. HAM, and C. MEGHIR, 1987. "Unemployment and Female Labour Supply", Economic Journal, Vol. 97, pp. 44-64.
BLUNDELL, R.W., and I. WALKER, 1986. "A Lifecycle Consistent Model of Family Labour Supply Using Cross Section Data", Review
of Economic Studies, Vol. 53, pp. 539-558.
BLUNDELL, R.W., C. MEGHIR, E. SYMONS and 1. WALKER 1989. "Labour Supply Specification and the Evaluation of Tax Refonns",
Journal of Public Economics, Vol. 36, pp. 23-52.
CALLAN, T., C.J. O’NEILL, and C O’DONOGHUE, 1995.
Supplementing Family Income, Policy Research Series Paper No.
23, Dublin: The Economic and Social Research Institute.
CALLAN, T., C.J. O’NEILL, and C. O’DONOGHUE, 1996. SWITCH:
The ESRI Tax-Benefit Model, Dublin: The Economic and Social
Research Institute.
D[LNOT, A., J. KAY, and N. MORRIS, 1993. The Reform of Social
Security, Oxford: Oxford University Press.
DUNCAN, A.S., 1991. "Labour Supply Decisions and Non-Convex Budget Constraints", in A. Heimler and D. Meulders (eds.),
Empirical Approaches to Fiscal Policy, London: Chapman Hall.
HARDING, A., 1995. "The Price of Means Tested Transfers: Effective Marginal Tax Rates in Australia in 1994", Australian Economic
WORK INCENTIVES, TAXES AND TRANSFER PROGRAMMES 17 HAUSMAN, J., 1981. "Labor Supply", in H. Aaron and J. Pechman (eds.),
How TcL~’es Affect Economic Behavior, Washington, D.C.:
Brookings Institution.
HAUSMAN, I., and D.A. WISE, 1978. "A Conditional Probit Model for Qualitative Choice: Discrete Decisions Recognizing Interdependence and Heterogeneous Preferences", Econometrica, Vol. 46, pp. 403-426.
HOYNES, H.W., 1996. "Welfare Transfers in Two-Parent Families: The Case of AFDC-UP", Econometrica, Vol. 64, no. 2, pp. 295-332. KILLINGSWORTH, M., 1983. l.x~bour Supply, Cambridge: CUP.
MaCURDY, T., D. GREEN and H.J. PAASCH, 1990. "Assessing Empirical Approaches for Analysing Taxes and Labour Supply",
Journal of Human Resources, Vol. 25, pp. 415-490.
MROZ, T., 1987. "The Sensitivity of an Empirical Model of Married Women’s Hours of Work to Economic and Statistical Assumptions", Econometrica, Vol. 55, pp. 765-800.
PENCAVEL, J., 1986. "Labour Supply of Men: A Survey", in O. Ashenfelter and R. Layard (eds.), Handbook of Labour
Economics, North-Holland.
SOCIAL SECURITY ADVISORY COMMITTEE, 1994. The Review of
Social Security - Paper 1: In Work - Out of Work: The R~le of Incentives and Disincentives in the Benefits System, Leeds: BA
Publishing.
SYMONS, E., and I. WALKER, 1986. "The Reform of Personal Taxation", Fiscal Studies, Vol. 7, pp. 38-47.
SYMONS, E., and I. WALKER, 1989. "The Revenue and Welfare Effects of Fiscal Harmonisation", Oxford Review of Economic Policy, Vol.
Chapter 2
SWITCH: THE ESRI TAX.BENEFIT MODEL
Tim Callan
2.1 Introduction
The publication of a report documenting SWITCH, the ESRI tax-benefit model (Callan, O’Donoghue and O’Neill, 1996) marked the culmination of a long-term programnle of work on microsimulation modelling at the Institute. The release of the model software to academic users and government departments represented a new phase of the ESRI model’s development. This chapter takes stock of the current state of the model - used in new ways in later chapters in this volume - and outlines potential future developments, some of which are already under way as part of a new research programme.
The need for a tax-benefit model was identified at an early stage in the design of the ESRI Project on Income Distribution, Poverty and Usage of State Services. Section 2.2 briefly sunamarises the key reasons why a tax-benefit model is needed. The ESRI’s 1987 Survey included detailed information on incomes, family composition, labour market participation, and social welfare receipts designed to allow the construction of a tax-benefit model. An initial project, focusing primarily on taxation modelling, was co-funded by the Foundation for Fiscal Studies and the ESRI. A programme of work leading to the construction of a full-scale tax and benefit model was then sponsored by the Department of Social Welfare, and it is this model which is described in Callan et al. (1996). An outline of the model structure is given in Section 2.3, and an illustration of its use in exploring alternative forms of tax cut is given in Section 2.4.
Section 2.5 deals with future developments. A new model, based on data gathered in the 1994 Living in Ireland Survey, is currently being constructed. The redesigned model will have greater capabilities, and substantially greater flexibility than the current version. There is potential,
SWITCH: THE ESRI TAX-BENEFIT MODEL 19 too, for extensions to the new model which could incorporate estimation and simulation of behavioural responses, along the lines discussed in the previous chapter (Walker, 1996).
2.2 The Need for a Tax-benefit Model
During the past 20 years, few areas of public policy have received such a high and sustained level of interest as the reform of the income tax and social welfare systems. However, much of the debate on tax and welfare reforms has had to proceed on the basis of rather restricted analyses. Usually, these analyses have looked at the effects of tax and social welfare policy changes on a small number of supposedly "typical" families. While this approach can help to understand the nature of a policy change, it can also be highly misleading. The most commonly analysed "typical" family at Budget time is a one-earner couple, with 2 children, taxed under PAYE. Less than 1 family in 20 actually falls into this category, and those who do differ widely in terms of income, housing tenure and other characteristics relevant to their social welfare entitlements and income tax liabilities.
Concentration on the effects of a policy change on a small number of hypothetical households cannot provide an overall picture of the gains and losses associated with complex reform packages; and by concentrating on a small number of supposedly "typical" families may lead to the neglect of effects which are important for significant groups. Carefully chosen hypothetical examples may be constructed "to prove almost anything" (Johnson, Stark and Webb, 1990).
Microsimulation models, simulote the tax and benefit position of a large-scale sample of families, using micro-level data on individual and
20 INCOME SUPPORT AND WORK INCENTIVES
2.3 An Overview of SWITCH, the ESRI Tax-benefit Model
SWITCH, a model for Simulating Welfare and Income Tax
CHanges, is the tax-benefit model constructed by the ESRI, as part of the programme of research sponsored by the Department of Social Welfare. It simulates the amounts of social welfare entitlements and tax liabilities at the
individual and family level for a large scale national sample of [fish households on a "static" basis, i.e., it does not incorporate behavioural responses to the policy change. The usefulness of static microsimulation models in analysing tax and social security policy has been amply demonstrated by international experience. Tax-benefit models have been constructed for most OECD countries, with the US and the UK having a particularly rich experience in their construction and use. (For a recent cross-country survey, see Sutherland, 1995.) In many instances, models of this type are the only way in which aggregate costing of complex changes to taxes and benefits can be derived. But the more fundamental advantage of such models is that they permit a representative picture to be constructed of the overall effects of a policy change, from which it is possible to identify the characteristics of gainers and losers from a policy change, the overall impact of a change on the distribution of income, and the impact on financial incentives to work.
A tax-benefit model requires a dataset containing detailed information on the characteristics relevant to taxes and benefits of a large-scale representative sample of individuals and households. The database for
SWITCH, the ESRI tax-benefit model, comes from the ESRI’s 1987
SWITCH: THE ESRI TAX-BENEFIT MODEL 21 The tax-benefit model groups these individuals into almost 6,000 "tax units" - a sub-household level comprising single persons or married couples, together with their dependent children, if any.~ Given the structure of the current income tax and social welfare systems, this "family unit" or "tax unit" is fundamental to the operation of the tax/transfer system.
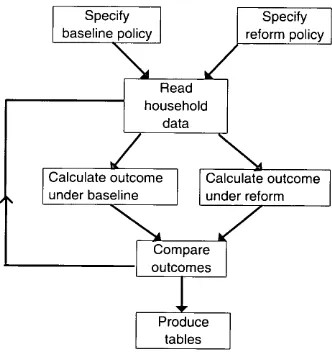
The other main component of a tax-benefit model is a suite of programmes which calculate the social welfare entitlements and tax liabilities of the sample households. Figure I.I gives an overview of how these programmes work. The operations performed by the programme can be broken down into three main stages. The first stage involves setting the policy parameters for the baseline simulation and for the policy change of interest. In most cases, an up-to-date baseline simulation, setting policy parameters such as social welfare rates, tax rates and tax bands equal to their current values is of greatest interest. The reform policy could be a simple change to income tax rates and bands, or a more complex package involving substantial changes to the income tax and social welfare systems.
The second stage is to read in the information referring to all the tax units in an individual household, and calculate the tax-benefit position for each tax unit under both the baseline and reform policies. As shown in Figure 1.1, this involves reading the household data; and then simulating the social welfare entitlements and tax liabilities for the tax units in that household, first under the baseline policy and then under the reform policy. This calculation yields the level of disposable income for each tax unit in the household and the marginal income tax rate it faces for each policy regime. At this stage, the model also calculates the changes which are brought about by the policy change of interest (the gain or loss in disposable income for each tax unit; and the increase or decrease in the
marginal tax rate faced by each tax unit). These detailed calculations are repeated for each tax unit in the sample.
22 INCOME SUPPORT AND WORK INCENTIVES Figure 2. I: Structure of the ESRI Tax-benefit Model
Specify
baseline policy
\
Read
household
data
/
IK~ Specify [
reform policy
I
Calculate outcome
under baseline
l
Produce
tables
Calculate outcome
under reform
SWITCH: THE ESRI TAX-BENEFIT MODEL 23 The information gathered in the survey is sufficient to predict or "model" current receipt of most social welfare benefits.2 For social insurance (contributory) benefits, we model the amount of the payment, which depends on farnily circumstances including the earnings of a spouse. For social assistance (non-contributory) benefiL% the model uses information from the survey to establish whether the individual falls into a category covered by a particular scheme; and then whether the individual is entitled to any payment, based on the means test applicable to that scheme or broad group of schemes. Similarly, information gathered in the survey is used to estimate gross income for tax purposes, allowances depending on age, employment status and family situation, deductions for mortgage interest and medical insurance premia. This allows simulation of income tax liabilities for each tax unit. PRSI contributions are also modelled, distinguishing between private sector employees, public sector employees on the modified rate, and the self-employed.
The usefulness of the model depends largely on the representativeness of the data which underlie it, and the accuracy of the model’s procedures in capturing the key features of the tax and social welfare systems. A battery of checks and cross-checks on the 1987 survey (see Callan, Nolan et al., 1989) has already shown that the database is generally representative of the national situation. More specific investigations (Callan, 1991) have attested to the model’s capacity to represent the income tax base and the broad social welfare client population in 1987 temas, despite underrepresentation of some of the smaller schemes. The size of the sample (about 3,300 households) does, of course, impose limits on the the analysis of policy changes to small schemes, or policy changes which affect only small groups of people. The fact that the data are drawn from 1987 is a further limitation, but Callan, O’Donoghue and O’Neill (1996, Chapter 3) outline the procedures used to adjust or "uprate" the data to represent the 1994 situation, and present some additional checks of the model’s representativeness. These suggest that it is
2 It is not sufficient to predict receipts of social welfare payments during the past year;
24 INCOME SUPPORT AND WORK INCENTIVES
reasonable to continue to use the model to investigate incentive and distributional issues, while cross-checking aggregate costs of policy changes against official estimates.
The trade-offs which are at the heart of many policy debates can be explored using this uprated model. The capabilities of the model include:
¯ Estimation of the net budgetary cost of packages of tax and welfare changes. Alternative reform packages with the same budgetary cost can therefore be constructed.
¯ Estimation of the pattern of gains and losses from a policy change. The numbers of families gaining and losing and the size of their gains and losses can be estimated, and the distribution of gains and losses across family types and income levels can be investigated.
¯ Investigation of the effects of a policy change on work incentives, focusing in particular on the impact on marginal tax rates for employees, and, with some additional modelling effort, on replacement rates and average effective tax rates for employees, the unemployed, and those not in the paid labour force.
Model results can be tabulated to show the patterns of gains and losses over the income distribution, or by family type, and to give an indication of the changes in marginal tax rates over the working population.3 The policy change under consideration could be a simple change in one tax rate; or a complex programme of tax and welfare reform. The model can be used to explore Iong-tem~ packages of reforms, and then examine alternative paths towards the selected long-term objective.
SWITCH: THE ESRI TAX-BENEFIT MODEL 25 uses to which it has been put. To date, SWITCH has been used to explore policy options such as a shift away from child dependant additions in the social welfare code towards a (taxable or non-taxable) child benefit payment (Callan, O’Donoghue and O’Neill, 1994); reforms to the Family Income Supplement scheme, or its replacement by a Child Benefit Supplement (Callan, O’Neill and O’Donoghue, 1995); and the evolution of work incentives facing the unemployed (Callan, Nolan and O’Donoghue,
1996). In the next section, we give a further illustration of how the model can be used.
2.4 An Illustration: Alternative Forms of TtLr Cut
Tax rate cuts, band-widening and allowance increases can, potentially, have quite different effects on the incentives facing particular groups and on the distribution of gains from the tax cuts over the income distribution. When, as in recent years, tax cuts are being contemplated, budgetary policy must decide on what mix of these or other routes will be used. In recent years, there have been some quite substantial changes in each of these areas: the standard and top tax rates have fallen from 35 and 58 per cent to 27 and 48 per cent respectively; the standard rate tax band has been substantially widened; but personal allowances have not kept pace with earnings or with price inflation in the 1987 to 1994 period. A detailed analysis of the impact of policy changes over that period will be the subject of another report. Here we simply illustrate some of the differences between alternative fomas of tax cuts, each involving similar total cost to the exchequer. The analysis is undertaken from a baseline which represents the 1994/5 situation.
The model suggests that a cut in the standard rate of tax of 2 percentage points would cost in the region of £140m per annum on a full year basis.4 Alternatively, it is estimated that such a sum could finance an increase in the personal allowance of approximately £350, or a widening of the standard rate band by roughly £1,400.
26 INCOME SUPPORT AND WORK INCENTIVES
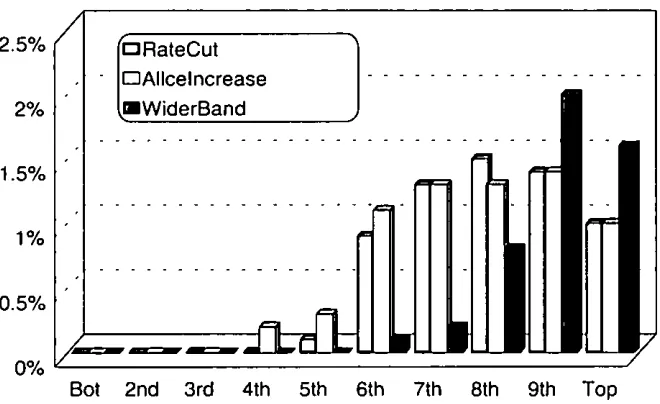
Figure 2.2: Distributive hnpact of Alternative Ta~" Cuts
/
2.5*/*IORateCut
1
-iE3Aiicelncrease ... ~,mWiderBand
0.5%
0% "~
Bot 2nd 3rd 4th 5th 6th 7th 8th 9th Top
Figure 2.2 illustrates the distributive impact of these alternative forms of tax cut. It shows the percentage change in disposable income for tax units ranked from the lowest to the highest incomes, adjusted for family size and composition, in ten groups of approximately equal size (deciles). The lowest income groups see little or no change in their income,s as most tax units at these income levels are below the income tax threshold. The middle income groups (deciles 4 to 6) gain more from an increase in personal allowances than from either a rate cut or a widening of the band. For both rate cuts and allowance increases the greatest proportionate gains are in the upper middle reaches of the income distribution (particularly deciles 6 to 9) with substantial proportionate gains also at the top.6 Widening of the standard rate band is of greatest benefit to those towards the top of the
5 Some people - mainly young, unemployed and living with their parents - could actually lose from a tax cut: the results above abstract from this factor, which is dealt with in Chapter 4 of Callan, O’ Donoghue and O’ Neill (1996).
SWITCH: THE ESRI TAX-BENEFIT MODEL 27 income distribution. A widening of the standard rate band gives no immediate benefit to those who are already standard rate taxpayers (though it may help to avoid increases in income moving them into the top rate band). Its immediate impact is on those who are top rate taxpayers, who are concentrated in the top third, and particularly in the top fifth of the income distribution. For those who remain top rate taxpayers, the absolute amount of the gain from the widening of the band is a fixed amount; this explains why the greatest proportionate increase does not occur at the very top of the income distribution, but among those close to the top (in the ninth decile of income).
Some indication of the differences in incentive impact can be gleaned from the model’s estimates of changes in marginal tax rates. The standard rate cut leads to a fall in the marginal tax rate of 2 percentage points for over 400,000 tax uniLs; a further 20,000 see a more substantial fall as they move off the marginal relief rate of 40 per cent on to the new standard rate of 25 per cent. An allowance increase sees a fall of more than 10 percentage points for over 60,000 tax units: some top rate laxpayers are drawn onto the standard rate, while others, at lower incomes, are taken out of the income tax net or move off the marginal relief rate and on to the standard rate. A widening of the standard rate band would see over 70,000 tax units move from the top rate of tax to the standard rate of tax - a fall of
13 percentage points.
28 INCOME SUPPORT AND WORK INCENTIVES
2.5 Current and Future Developments
SWITCH now constitutes a valuable tool in the analysis of
budgetary options for income tax, PRSI and social welfare changes. It allows analysis of long-term strategic changes, and possible phasing-in of changes over a number of years. In order to realise the full potential of the model for policy analysis within government departments and other public sector bodies, and to allow these bodies to understand and interpret results generated by independent users of the model, a Microsimulation Forum has been established. This is a group comprising government departments and institutions with a central interest in tax and social welfare policy, including the Departments of Finance, Social Welfare, Enterprise and Employment, as well as the Revenue Comissioners, the Combat Poverty Agency and the ESRI.
A new model is currently being developed. It will use the 1994 data gathered as part of the Living in Ireland Survey - the first wave of the Irish element of the European Household Panel Survey. This work forms part of a programme of research sponsored by the Department of Social Welfare and the Combat Poverty Agency. The redevelopment of the model involves much more than simply updating the data on which it is based. Many enhancements to the power and flexibility of the model to undertake policy-relevant analyses are also being developed. For example, it will be possible to analyse the impact of policy changes on the effective marginal tax rates facing different groups in the population and on the "replacement rates" - a measure of the balance between incomes in and out of work - facing employees and the unemployed. A number of applications of the model-based analysis will be undertaken as the model’s capacity is developed. These will begin with an examination of the rate of take-up for the Family Income Supplement; and will include an assessment of policy changes in the 1987 to 1994 period.
SWITCH: THE ESRI TAX-BENEFIT MODEL 29 labour supply decisions - a high withdrawal rate on benefit income, and the high effective tax rates on second earners which arise from the income-splitting provisions of the tax code. It also uses the type of infornlation gathered on work search for ILO definitions of unemployment to distinguish between those who are involuntarily unemployed - or "rationed" at zero hours, as in Walker (1996) - and those who choose not to seek work. Married women’s labour supply decisions are found to be more sensitive than those of their husbands to wage rates, in line with findings elsewhere. A revenue-neutral change in the tax structure, involving greater independence of taxation between husbands and wives, is found to have a positive effect on married women’s labour supply which greatly outweighs any negative effect on the labour supply of married men.
The 1994 data and model have the potential to support more in-depth analysis of labour supply responses than was undertaken with the 1987 data. A full-scale "third generation" model, along the lines outlined by Walker (1996), is an ambitious target, but something close to this could be achieved, given the type of data gathered in the Living in Ireland surveys, and the flexibility of the new model structures.
Some of the chapters which follow will show how irish and UK models can be used, with some adjustments, to provide useful comparative analyses. But there can be considerable difficulties in widening the comparisons to include other countries or in deepening the analysis to deal
with some obstacles which are currently "side-stepped" e.g., the nature of housing supports in Ireland and the OK.7 A proposed European-wide tax-benefit model (EUROMOD) aims to overcome many of these problems. The design of EUROMOD a taxbenefit model for most EU countries
-would take these inter-country comparability issues into account. This would involve a degree of harmonisation of data, of methods of describing taxes and benefits, and of modelling structures. The end result would be a model which would greatly facilitate cross-country comparative modelling, and would, uniquely, allow an exploration of the impact of common policy changes (e.g., some form of common minimum income standard) on a
3O INCOME SUPPORT AND WORK INCENTIVES
Europe-wide basis. A feasibility study for EUROMOD is currently under way, including the assembly of information on data and policy structures, and the construction of a prototype model for a small selection of countries. A conference in April 1997 will report on the results of this work, and will assess the potential benefits of EUROMOD as an ,analytic tool.
The wider release of the current version of SWITCH, and the planned future developments to its capabilities, mean that the ESRI tax-benefit model can help to move the policy debate on income tax and social welfare issues onto a new plane. Proposals can be developed, investigated and refined quite rapidly using the model. Information on the cost, distributive and incentive implications of alternative refomls can complement existing analyses of policy changes to provide a much fuller picture of the likely impact of a reform package. Model-based analyses can be of enormous assistance in analysing the strategic choices for the income tax and social welfare systems, and in planning the implementation of a long-term strategy. It is our hope that the potential of the model in these areas will be fully exploited by policy makers and by academic analysts; and that future developments will enhance the contribution made by the ESRI model to the policy debate.
REFERENCES
CALLAN, T., 1991. Income Tar and Welfare Reforms: Microsimulation
Modelling and Analysis, General Research Series Paper No. 155,
Dublin: The Economic and Social Research Institute.
CALLAN, T., and B. FARRELL, 1991. Women’s Participation in the
Irish Labour Market, National Economic and Social Council
Report No. 91, Dublin: Stationery Office.
CALLAN, T., B. NOLAN and C. O’DONOGHUE, 1996 "What Has Happened to Replacement Rates?", The Economic and Social
Review, Vol. 27, No. 5, pp. 439-456.
SWITCH: THE ESRI TAX-BENEFIT MODEL 31 General Research Series Paper No. 146, Dublin: The Economic and Social Research Institute.
CALLAN, T., C. O’DONOGHUE and C. O’NEILL, 1994. Analysis of
Basic Income Schemes for Ireland, Policy Research Series Paper
No. 21, Dublin: The Economic and Social Research Institute.
CALLAN, T., C. O’NEILL and C. O’DONOGHUE, 1995. Supplementing
Family Income, Policy Research Series Paper No. 23, Dublin: The
Economic and Social Research Institute.
CALLAN, T., C. O’DONOGHUE and C. O’ NEILL, 1996. SWITCH: The
ESRI Tax-Benefit Model, Dublin: The Economic and Social
Research Institute.
CALLAN, T., and H. SUTHERLAND, 1997. "The Impact of Comparable Policies in European Countries: Microsimulation Approaches",
European Economic Review, forthcoming.
CALLAN, T., and A. VAN SOEST, 1996. "Family Labour Supply and Taxation in Ireland", The Economic and Social Research Institute Working Paper No. 78.
EXPERT WORKING GROUP ON THE INTEGRATION OF THE INCOME TAX AND SOCIAL WELFARE SYSTEMS, 1996.
h~tegrating Tax and Social Welfare, Dublin: Stationery Office.
JOHNSON, P., G. STARK and S. WEBB, 1990. "TAXBEN2: The New IFS Tax-Benefit Model", Institute for Fiscal Studies Working Paper No. W90/5.
PEARSON, M., and E. WH1TEHOUSE, 1996. "Taxes, Benefits, Work Incentives and Employment: An OECD Perspective", Chapter 3,
this volume.
SUTHERLAND, H., 1995. "Static Microsimulation Models in Europe: A Survey", Microsimulation Unit Discussion Paper MU9503, DAE, University of Cambridge.
Chapter 3
MAKING WORK PA Y: THE OECD STUDY OF TAXES, BENEFITS, EMPLOYMENT AND UNEMPLOYMENT
Mark Pearson and Edward Whitehouse’
3.1 Introduction
Taxes and benefits are the most direct way in which governments can affect the financial incentives for individuals to work and for employers to hire them. But current tax and benefit systems owe many of their features to a bygone era and have failed to keep pace with recent changes in the labour market. The OECD Jobs Study highlighted tax and benefit systems as a cause of some labour market problems. Taxes increase the costs of employing workers, particularly low-wage workers; and benefit systems may leave little incentive to work, especially for low-wage families. Restructuring tax and benefit systems to improve work incentives must be consistent with the fundamental purpose of the systems. Taxes must raise revenues and benefits provide for those with insufficient incomes. Nearly all reforms which "make work pay" involve trade-offs between these fundamental objectives.
Financial incentives to work are important for three reasons. Although many people will seek work even if they would get more money receiving benefits, still more will seek work when there is a financial incentive to do so. Second, taking up work involves costs for travel, work clothing and equipment and possibly child care. If work does not pay, those with very few resources may not be able to afford to undertake it. Employers will not offer jobs at wages which they know no job-seeker could accept without being worse off than they would be were they to
’ Social Policy and Fiscal Affairs divisions respectively, Organsisation for Economic Co-operation and Development, Paris. The authors would like to thank Delegates to the OECD Working Parties on Social Affairs and on Tax Policy Analysis and Tax Statistics and John Martin, Jeffrey Owens and Peter Scherer of the OECD Secretariat for their contributions. The authors express a personal view.
MAKING WORK PAY 33 remain unemployed. Finally, empirical studies suggest financial incentives to work matter (see OECD (1994b)). This is not to deny the importance of other factors which influence whether people work or not. A low-paid job is often the first step on the ladder towards higher earnings or there may be non-pecuniary, for example, social benefits to working.
Section 3.2 outlines some of the main changes in the labour market since unemployment benefit schemes first appeared in something like their
modern form. Section 3.3 considers in more detail the level of incomes available to those without jobs relative to the incomes they might receive were they to be employed, and notes some recent policy changes to systems of income support. Section 3.4 looks at the rate at which benefits are reduced and taxes increase as family incomes rise. Particular attention is given to two areas where there has recently been a great deal of interest among policy makers: employment conditional lax credits or benefits, and the interactions of the tax and benefit system with part-time work. Conclusions are drawn together in Section 3.5.
3.2 Taxes, Benefits and the Changing Nature of the Labour Market
The 1994 Australian White Paper recently stated, in proposing major reforms, that
Social Security arrangements for unemployed people still largely reflect the unemployment benefit system introduced in the 1940s, around the time of the release of the White Paper on Full Employment [in 1945]. (Australia, 1994, p. 143).
This applies with equal justification to most OECD countries; there have been major changes to OECD labour markets since benefit systems were first designed.
- Unemployment is at a much higher level than when unemployment insurance schemes were put in place after 1945.
34 INCOME SUPPORT AND WORK INCENTIVES
- Youth unemployment is high and has increased in m.’my countries.
Youths have limited or no work experience: they have not contributed to insurance schemes and so are often not entitled to these benefits. - The labour force participation of adult men has declined with many of
those withdrawing on benefits for invalidity, sickness or early retirement. Female participation has grown. Two-earner couples are more common, as are lone-parent families.2 Insuring individuals against loss of wages is less effective in ensuring adequate family incomes when increasing numbers of households of working age are not part of the labour force.
- Part-time work has grown in most OECD countries. Not all part-time
workers have rights to insurance benefits, leaving a gap in benefit coverage.
- The dispersion of income before taxes and transfers has widened since 1980 in Australia, Japan, The Netherlands, Sweden, the United Kingdom and the United States, but in some cases tax and benefit systems have meant that changes in the distribution of disposable incomes have been small.
As working and family patterns have become more diverse, so have the types of benefits received. Although unemployment benefits are the largest single form of social expenditure directed at people below retirement age, they account for less than 25 per cent on average across the OECD.
3.3 The Unemployment Trap
The unemployment benefit system provides insurance against job loss which individuals would find extremely difficult to obtain privately. Benefits allow the unemployed to search for a job which matches their
MAKING WORK PAY 35 abilities. Having the right people in the right jobs raises productivity and
reduces the chance of them becoming unemployed in future. Although unemployment benefits can help labour markets work more effectively, they can also have negative effects. By freeing the unemployed from having to
take less ideal jobs, they increase the duration of unemployment spells. They alter incentives in wage bargaining. If the financial consequences of unemployment are harsh, workers will be wary of pushing tip wages and so risking their jobs. Unemployment benefits can subsidise seasonal employment patterns. Without countervailing factors, the higher benefits are relative to earnings (the so-called "replacement rate"), the higher unemployment will be.
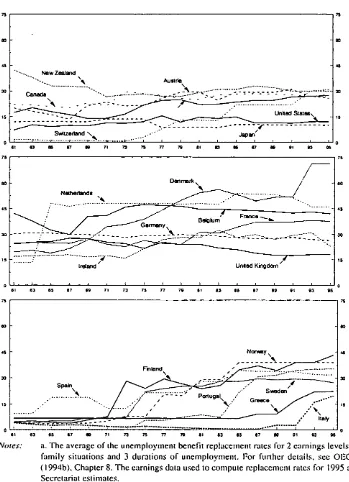
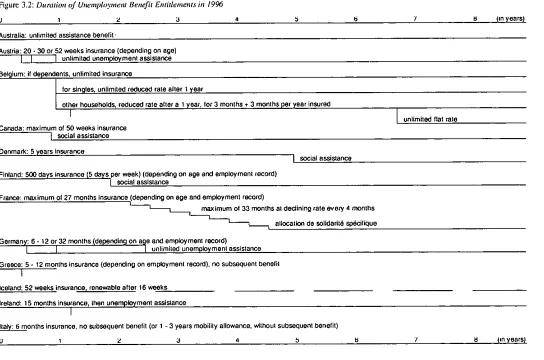
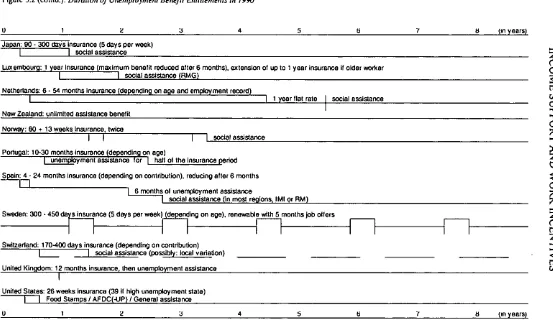
Have unemployment benefit systems become more generous?
The OECD Jobs Study found that gross (before-tax) unemployment benefit entitlements relative to gross earnings increased from an OECD (unweighted) average of 16 per cent of earnings in 1961 to 29 percent in 1991. This rise could have contributed to the increase in unemployment over that period, but long time-lags are likely before the full effects were felt.3 Figure 3.1 updates the analysis to 1995. Governments have not cut benefits in response to high and persistent unemployment (Box I). Indeed, the OECD-wide summary index has risen slightly since
1991, to 31 percent in 1995.